

Bitcoin (BTC) is showing strong signs of a longer-term bullish reversal but is still trading inside a short-term corrective pattern.
Bitcoin has been increasing above an ascending support line (dashed) since Jan. 24. So far, it has validated the line four times, most recently on March 14 (green icon). The rebound that followed led to the ongoing upward move.
The price is currently approaching the $44,500 horizontal resistance area, a level that BTC hasn’t traded above since Jan. 5.
Technical indicators in the daily time frame are bullish and support the continuation of the upward movement. Both the MACD and RSI are moving upwards. The former has just moved into positive territory while the latter is above 50. Both of these are considered signs of bullish trends.
If BTC manages to break out above the $44,500 horizontal area, there would be virtually no resistance major resistances apart from the 0.382 Fib retracement resistance level at $46,750.

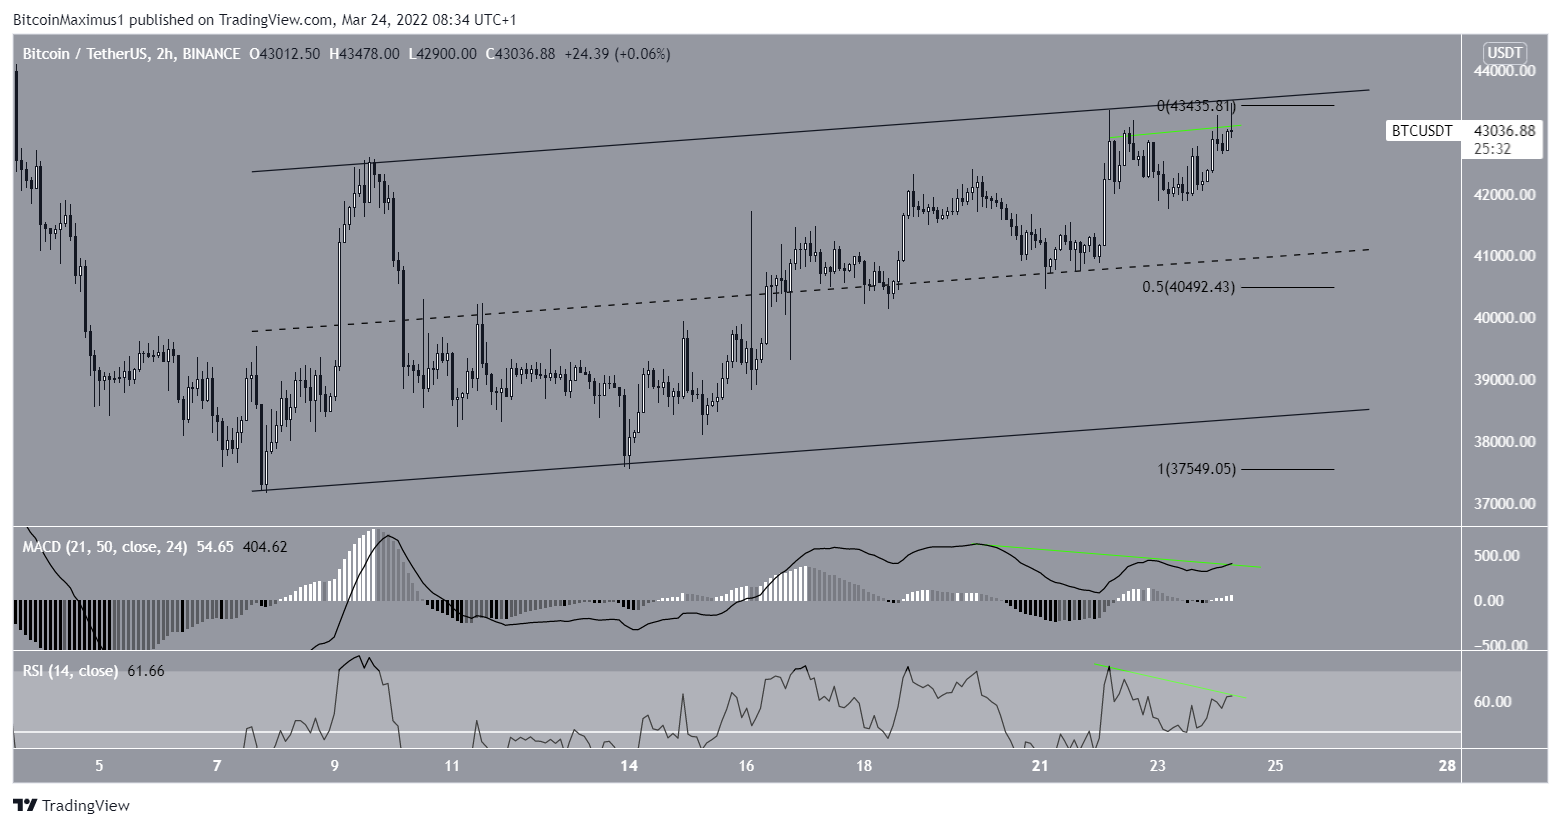
Short-term BTC movement
The two-hour chart shows that BTC has been trading inside an ascending parallel channel since March 7. Currently, it’s trading just under the resistance line of the channel.
In addition to this, both the RSI and MACD have generated bearish divergences (green lines), which often precede reversals.
If a downward movement occurs, the closest support area would be found near $40,500.
Conversely, a breakout from the channel would confirm that the trend is bullish.
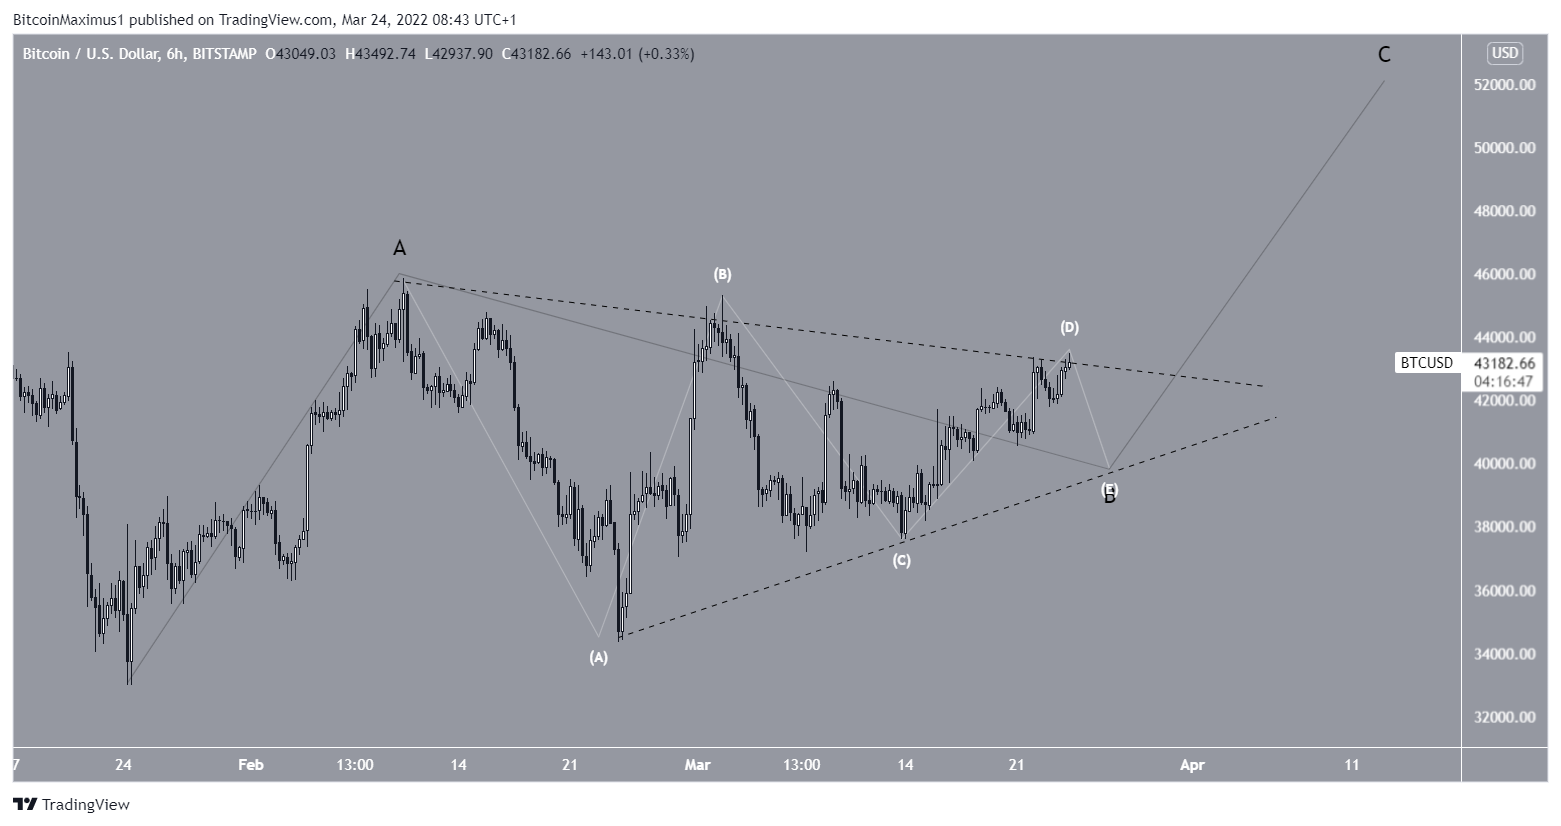
Wave count analysis
The most likely wave count suggests that BTC is in wave B of an A-B-C structure (black). Wave B has taken the shape of a symmetrical triangle.
The sub-wave count is shown in white.
If the count is correct, BTC could experience another short-term dip before resuming its upward movement. A breakout from the triangle could take the price all the way to $50,000.
For BeInCrypto’s previous Bitcoin (BTC) analysis, click here
Disclaimer
In line with the Trust Project guidelines, this price analysis article is for informational purposes only and should not be considered financial or investment advice. BeInCrypto is committed to accurate, unbiased reporting, but market conditions are subject to change without notice. Always conduct your own research and consult with a professional before making any financial decisions. Please note that our Terms and Conditions, Privacy Policy, and Disclaimers have been updated.
