


Bitcoin (BTC) has reclaimed an important short-term horizontal level but is still trading in a bearish pattern.
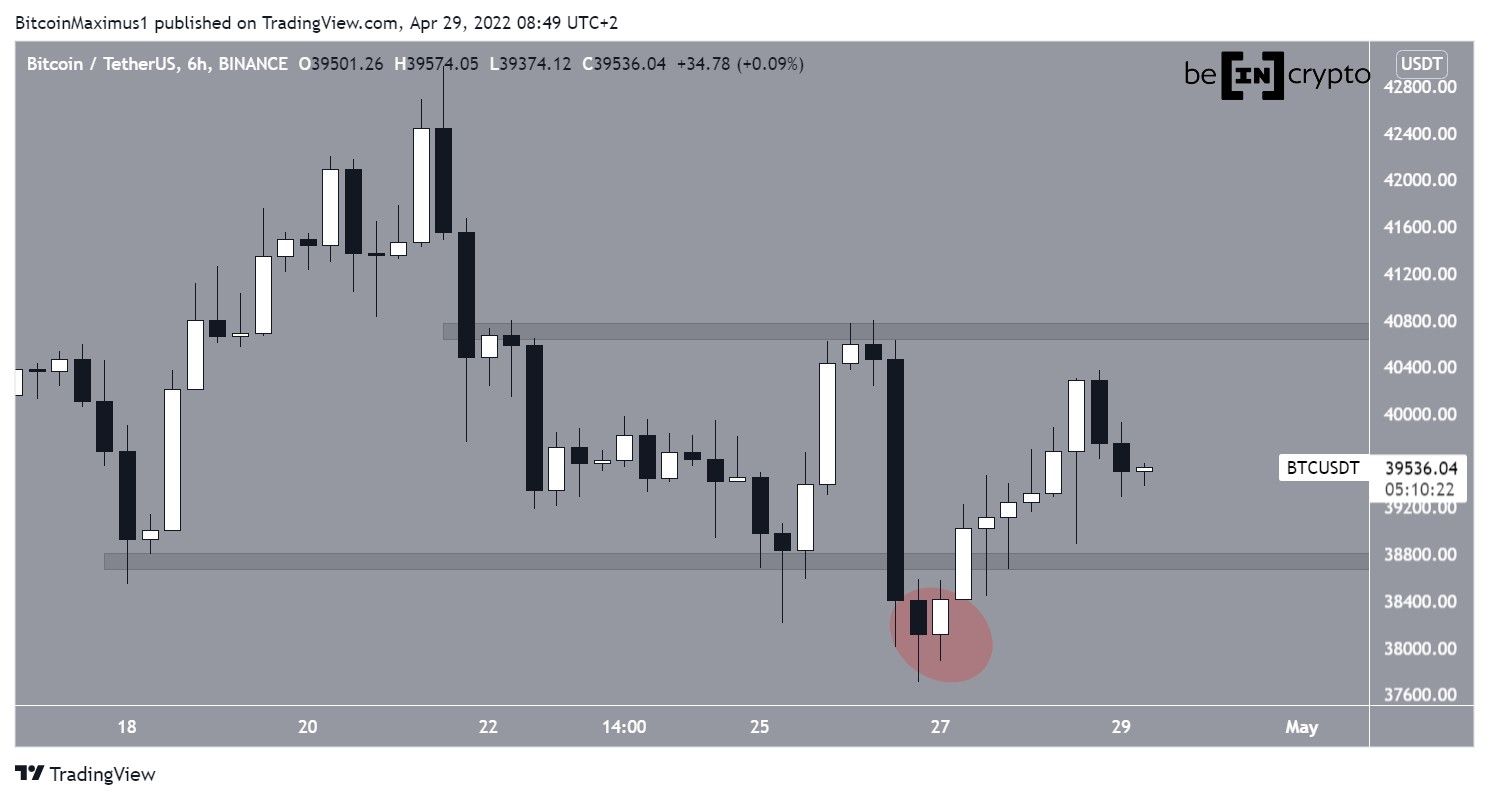
Bitcoin has been falling since reaching a local high of $42,976 on April 21. The downward move led to a low of $37,700 on April 26. The decrease initially caused a breakdown (red circle) from the $37,700 area, which had been acting as support since April 18.
However, the price has been moving upwards since and reclaimed the area on April 27. This renders the previous breakdown just a deviation, which is considered a bullish development.
Currently, BTC is trading between the $37,700 support and the $40,700 resistance area.
Bullish divergences
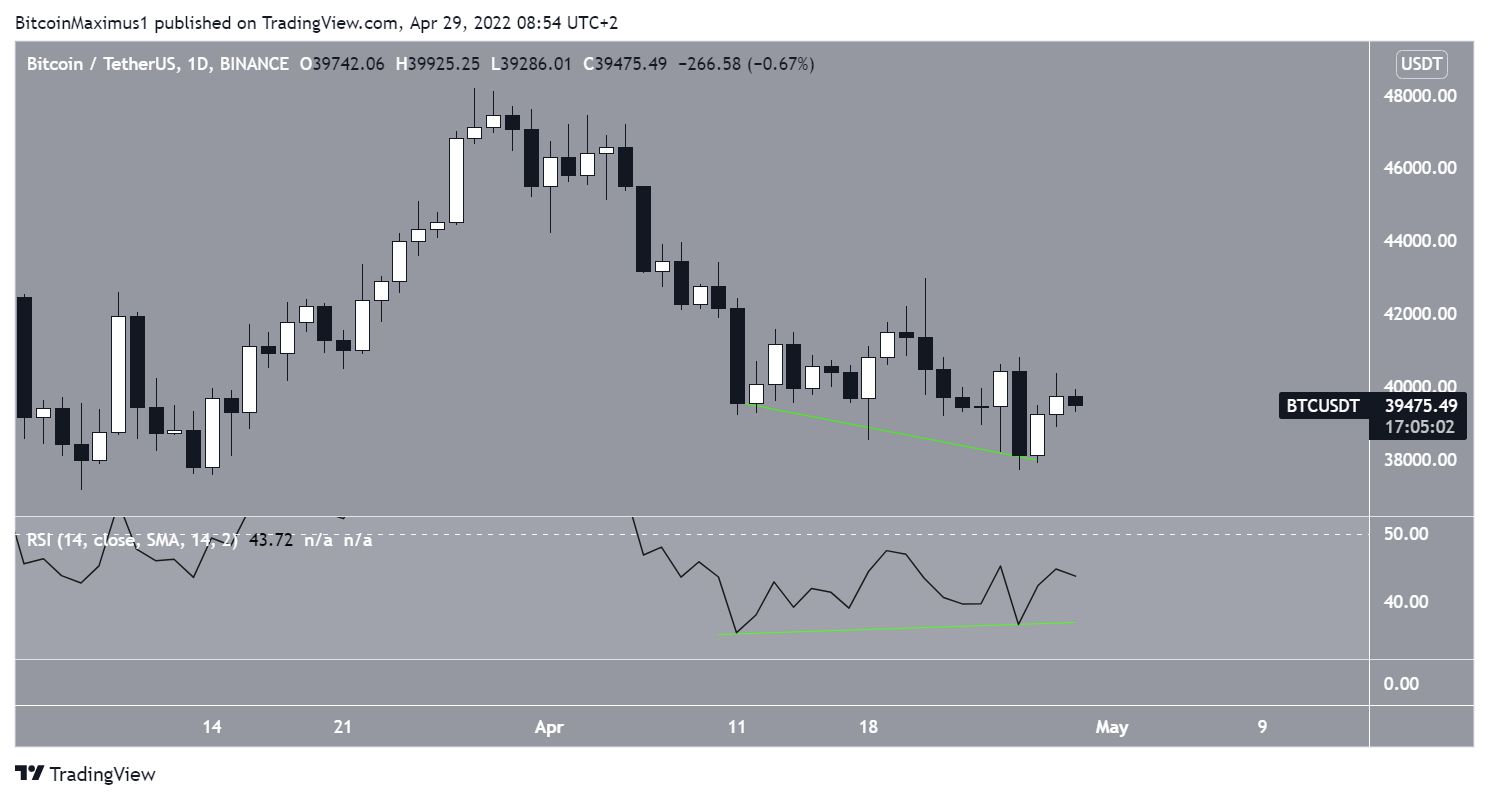
The daily BTC chart suggests that an upward move is likely to follow. The reason for this is the bullish divergence that has been developing since April 10.
Such divergences in the daily time frame often precede significant bullish trend reversals.
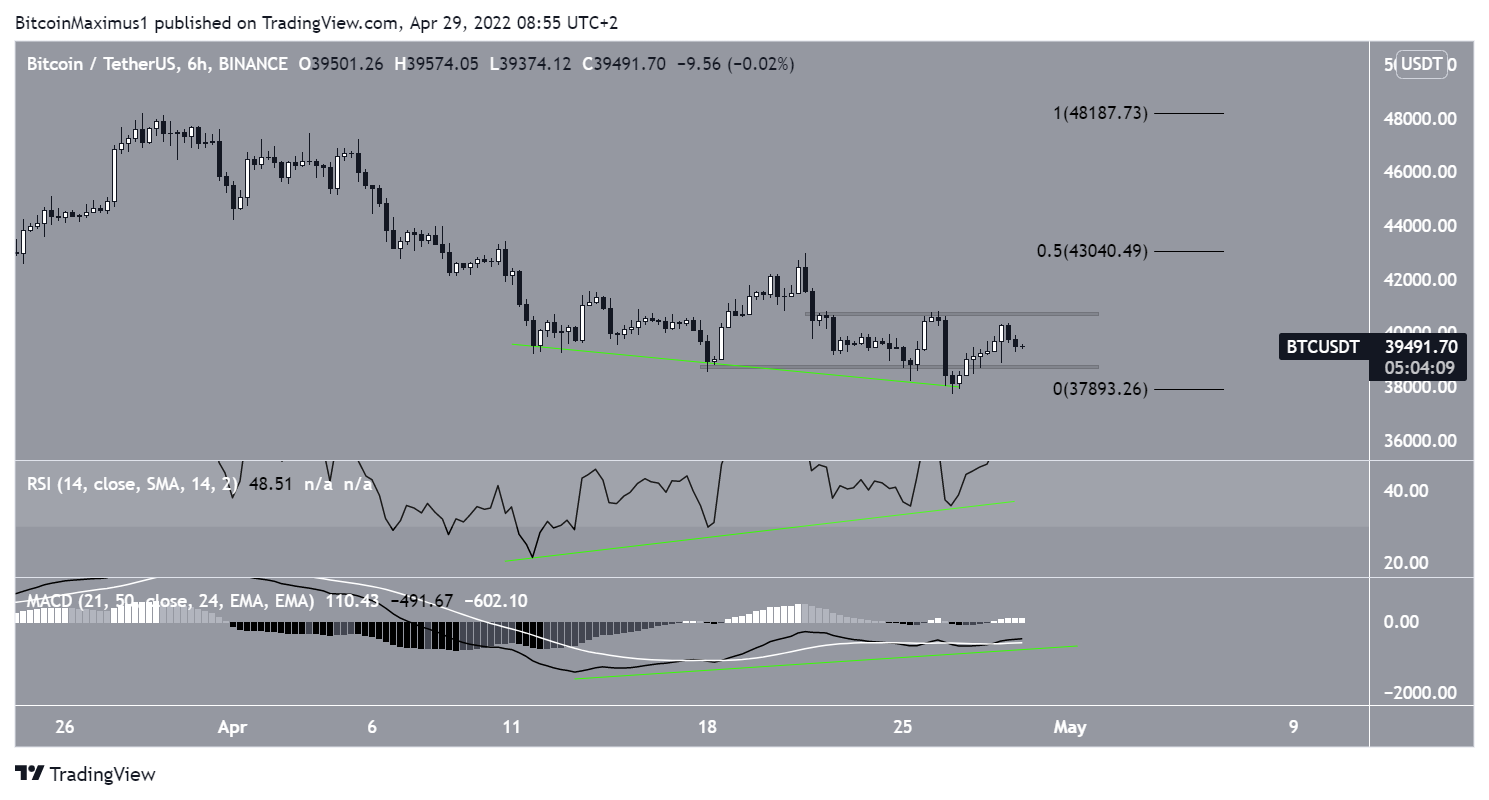
The six-hour time frame supports this possibility since it shows bullish divergences in both the RSI and MACD.
If BTC manages to break out from its range, the next resistance area would be found at $43,000. This target is the 0.5 Fib retracement resistance level.
Short-term BTC movement
Despite the bullish signs from the six-hour and daily time frames, the price action in the two-hour chart is bearish.
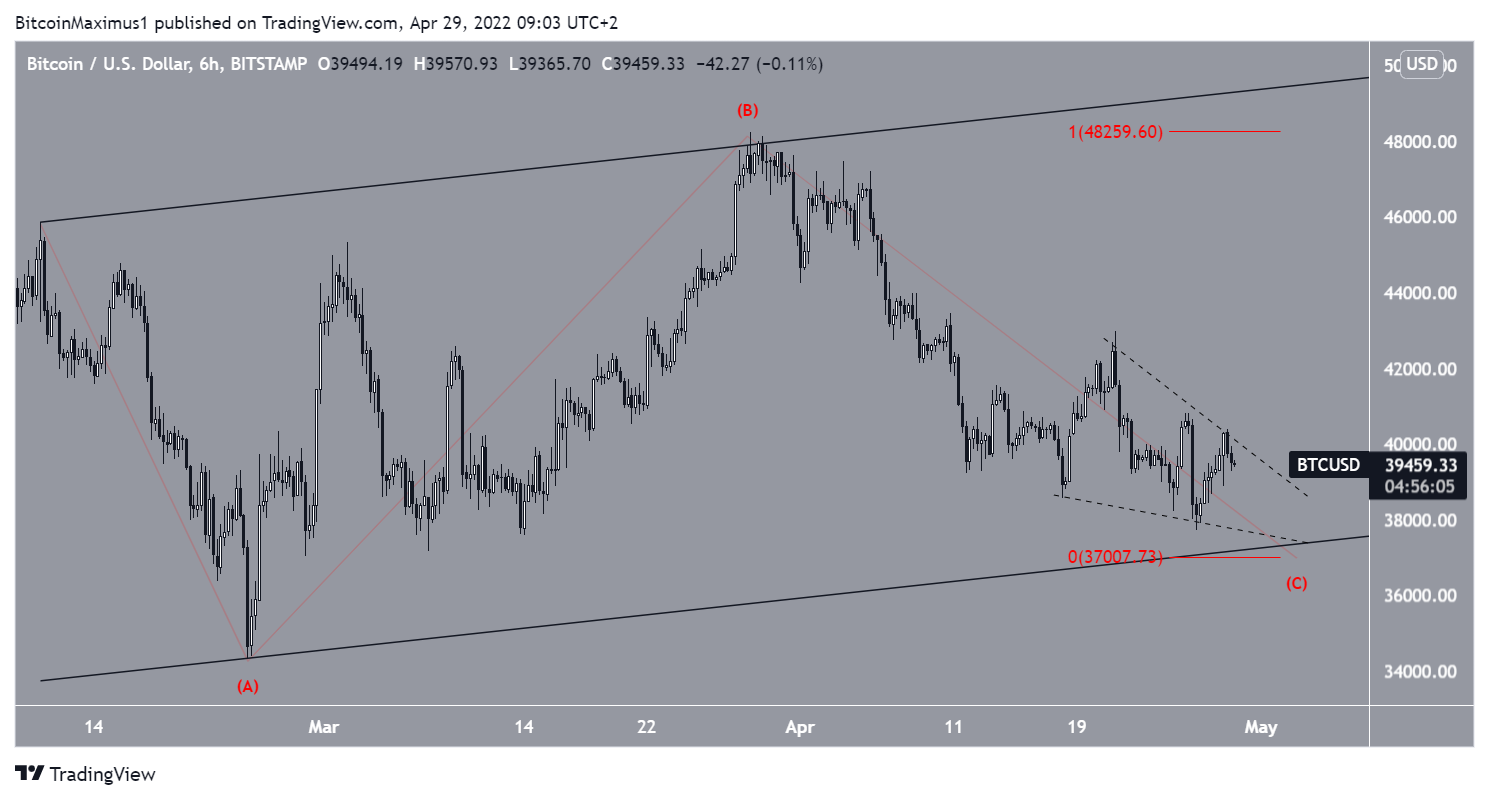
The reason for this is that BTC is trading at the support line of an ascending parallel channel. Such channels usually contain corrective movements, meaning that a breakdown from it would be likely.
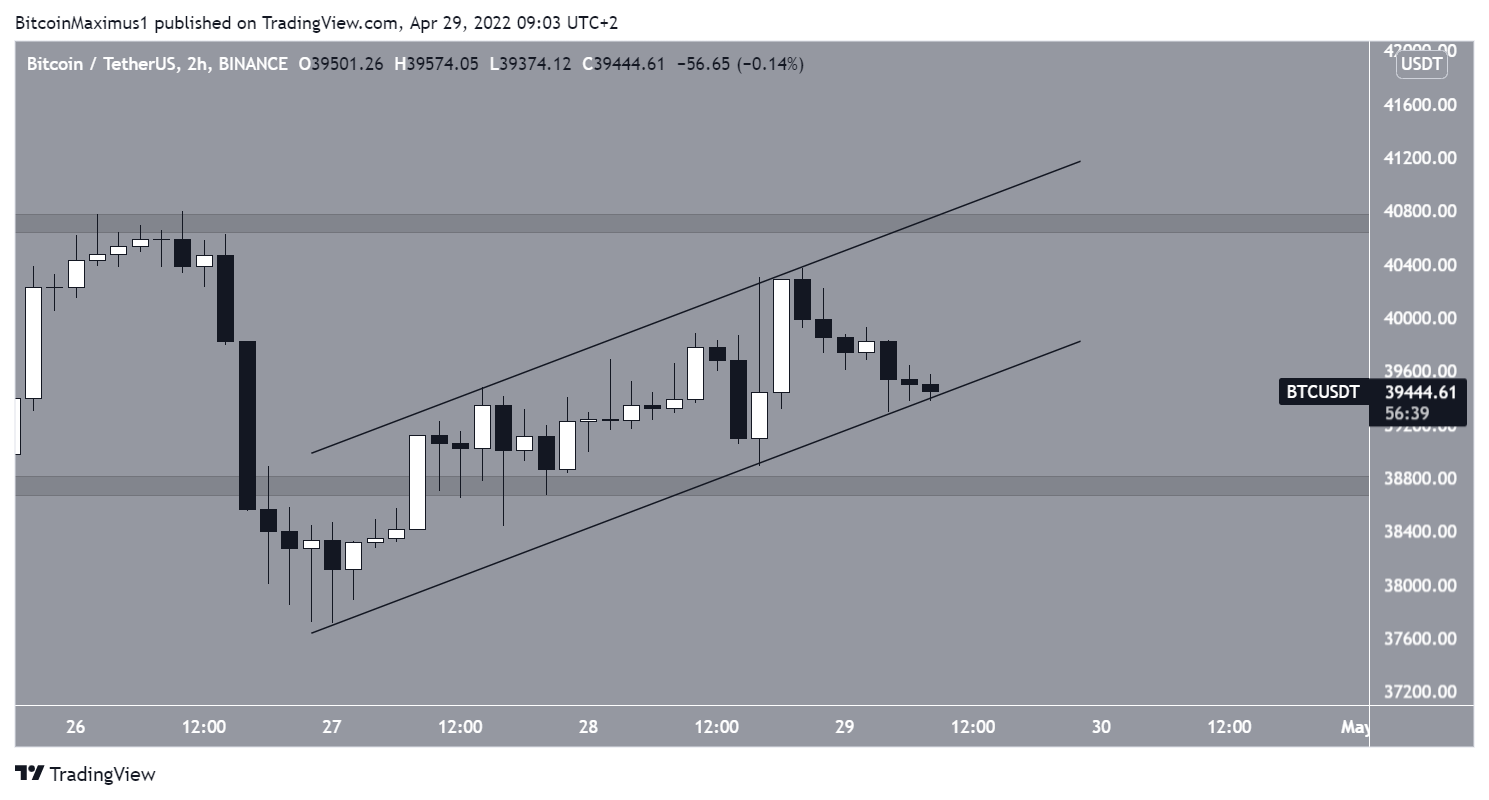
A breakdown from the channel and decrease towards $37,000 would also fit with a potential wave count that suggests that BTC will drop to $37,000. This would give waves A and C an exact 1:1 ratio.
In either case, a bottom seems to be close to being reached.
For BeInCrypto’s previous Bitcoin (BTC) analysis, click here


