


The Bitcoin (BTC) price has finally managed to break through an important resistance level at $52,500.
Bitcoin is expected to continue increasing to $57,000 and could potentially reach a new all-time high price after.
Bitcoin Attempts Reversal
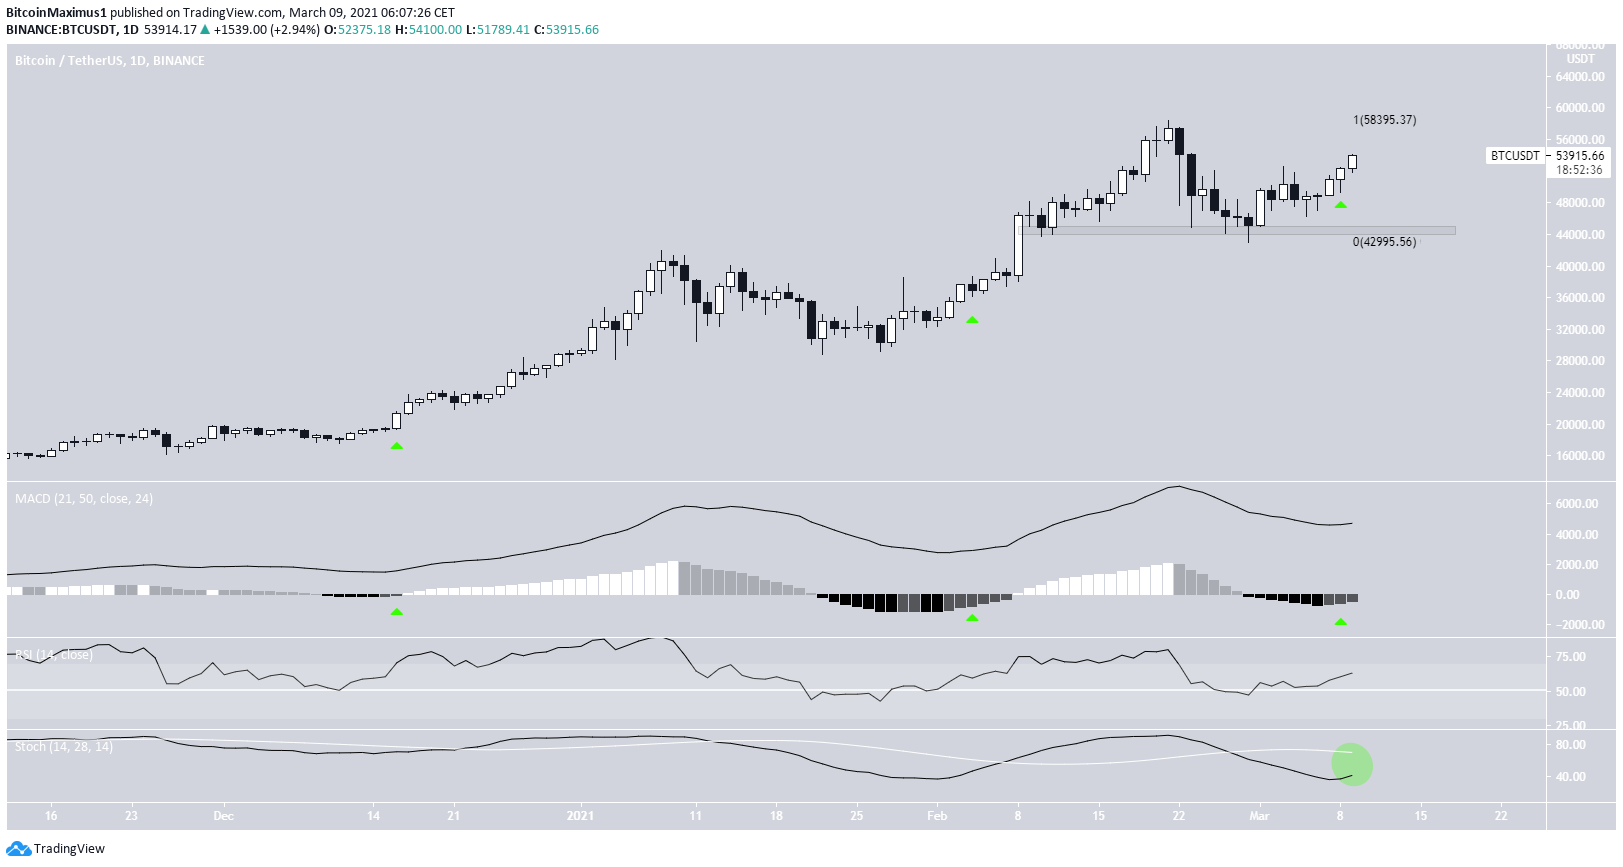
BTC has been moving upwards since bouncing at the $44,500 support level on Feb. 28.
While the upward move looked to have stalled on March 3, BTC created a strong bullish candlestick on March 8. It has moved back above the March 3 high today.
Technical indicators have turned completely bullish. The RSI has clearly bounced at the 50-line and the Stochastic oscillator has begun to turn upwards. It is currently close to making a bullish cross.
Furthermore, the MACD has given bullish reversal signals. The prior two times this occurred (green arrows), the MACD crossed into positive territory and initiated a significant upward movement.
Therefore, it’s possible that the same will happen this time around.
Short-Term Movement
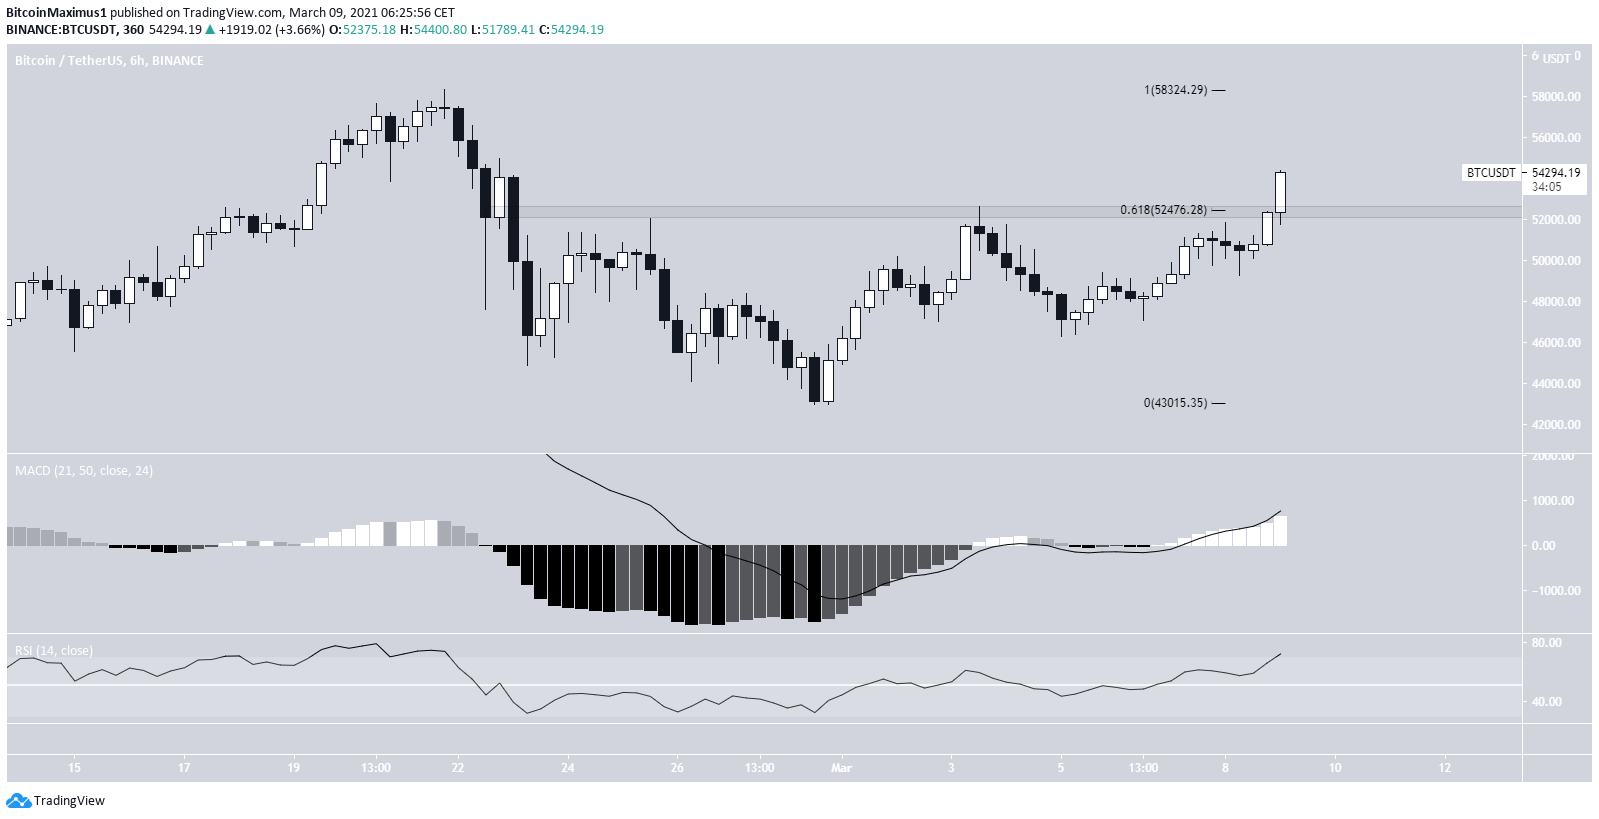
The six-hour chart shows an ongoing breakout above the 0.618 Fib retracement level at $52,500. This is crucial, as BTC had been trading below this line since Feb. 24.
The 0.618 Fib level often acts as the top of retracements after a sharp drop. Thus, reclaiming it is a very positive sign.
On top of that, both the MACD and RSI are increasing.
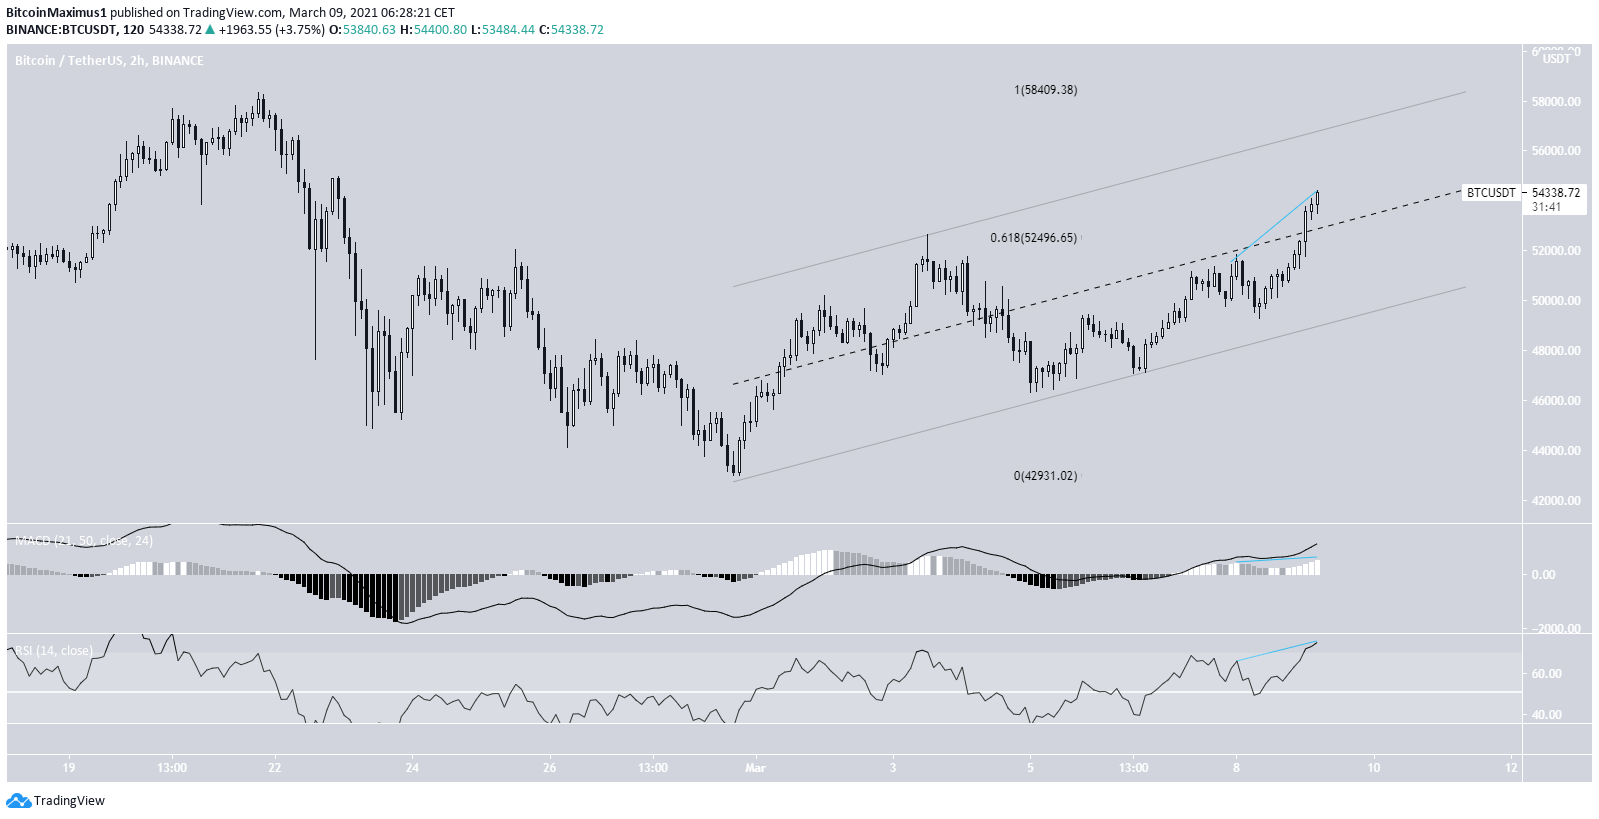
The two-hour chart shows that BTC is potentially trading inside a parallel channel. Currently, it has just moved above the channel and has invalidated numerous potential bearish divergences.
Therefore, it’s likely that the short-term trend is also bullish.
However, movement contained inside parallel channels is often corrective. Iff BTC were to get rejected by the resistance line of the channel near $57,000, it could suggest that another low awaits.
On the other hand, a breakout above this channel would likely take BTC towards a new all-time high.
In either case, BTC is expected to increase to the resistance line of the channel. This target is currently near $57,000.
Wave Count
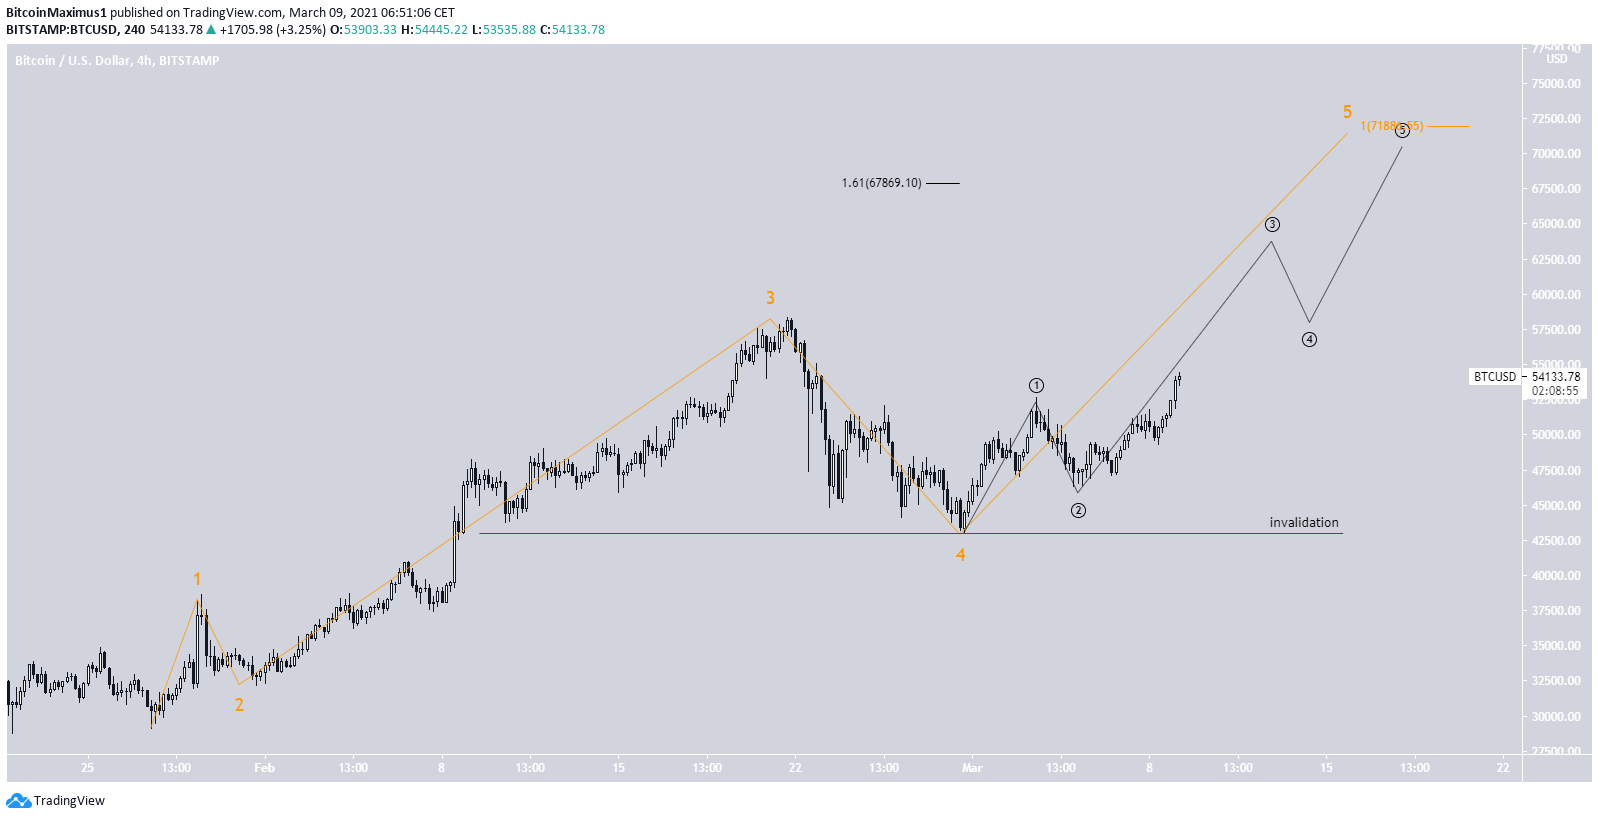
The most likely wave count suggests that BTC is in the fifth and final wave (orange) of a bullish impulse.
The most likely target for the top of the move is found between $67,869-$71,884.
The sub-wave count is shown in black.
A decrease below the sub-wave two low at $42,300 would invalidate this particular wave count and indicate that BTC is correcting instead.
For a longer-term wave count, click here.
Conclusion
Bitcoin is expected to increase at least until it reaches the top of the parallel channel near $57,000. A breakout from the channel would likely lead to a new all-time high price.



