
Bitcoin (BTC) broke out from a descending parallel channel on Sept 1 and is attempting to move above the $51,200 horizontal resistance area.
Due to mixed readings from technical indicators, we cannot accurately determine if BTC will be successful in breaking out the first time. However, an eventual breakout is likely.
Short-term breakout
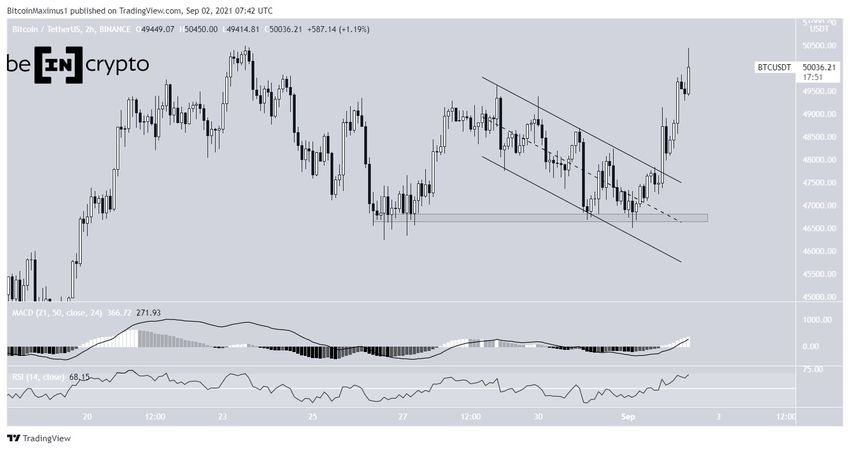
BTC had been trading inside a descending parallel channel since Aug 29. Such channels usually contain corrective structures.
After sweeping the lows on Sept 1, BTC broke out later during the day. So far, it has reached a high of $50,450.
Both the MACD and RSI are bullish, supporting the validity of the breakout.
Long-term resistance
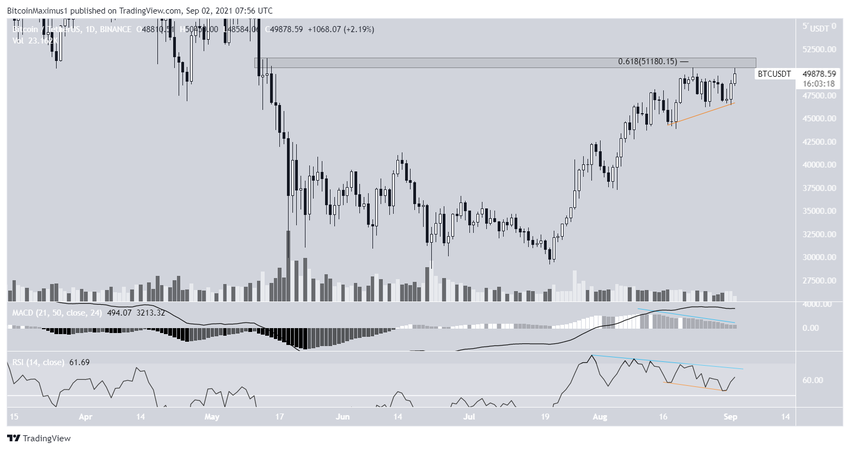
Despite the short-term breakout, BTC is still trading below the $51,200 crucial resistance area. This is both a horizontal resistance area and the 0.618 Fib retracement resistance level.
Technical indicators in the daily time frame are still bearish. The MACD has no strength left and is almost negative. Similarly, the RSI has generated some bearish divergence.
However, a hidden bullish divergence is also developing (yellow), which is normally a strong sign of trend continuation.
Due to the mixed readings, a breakout or rejection will be required to determine the direction of the future trend.
Wave count
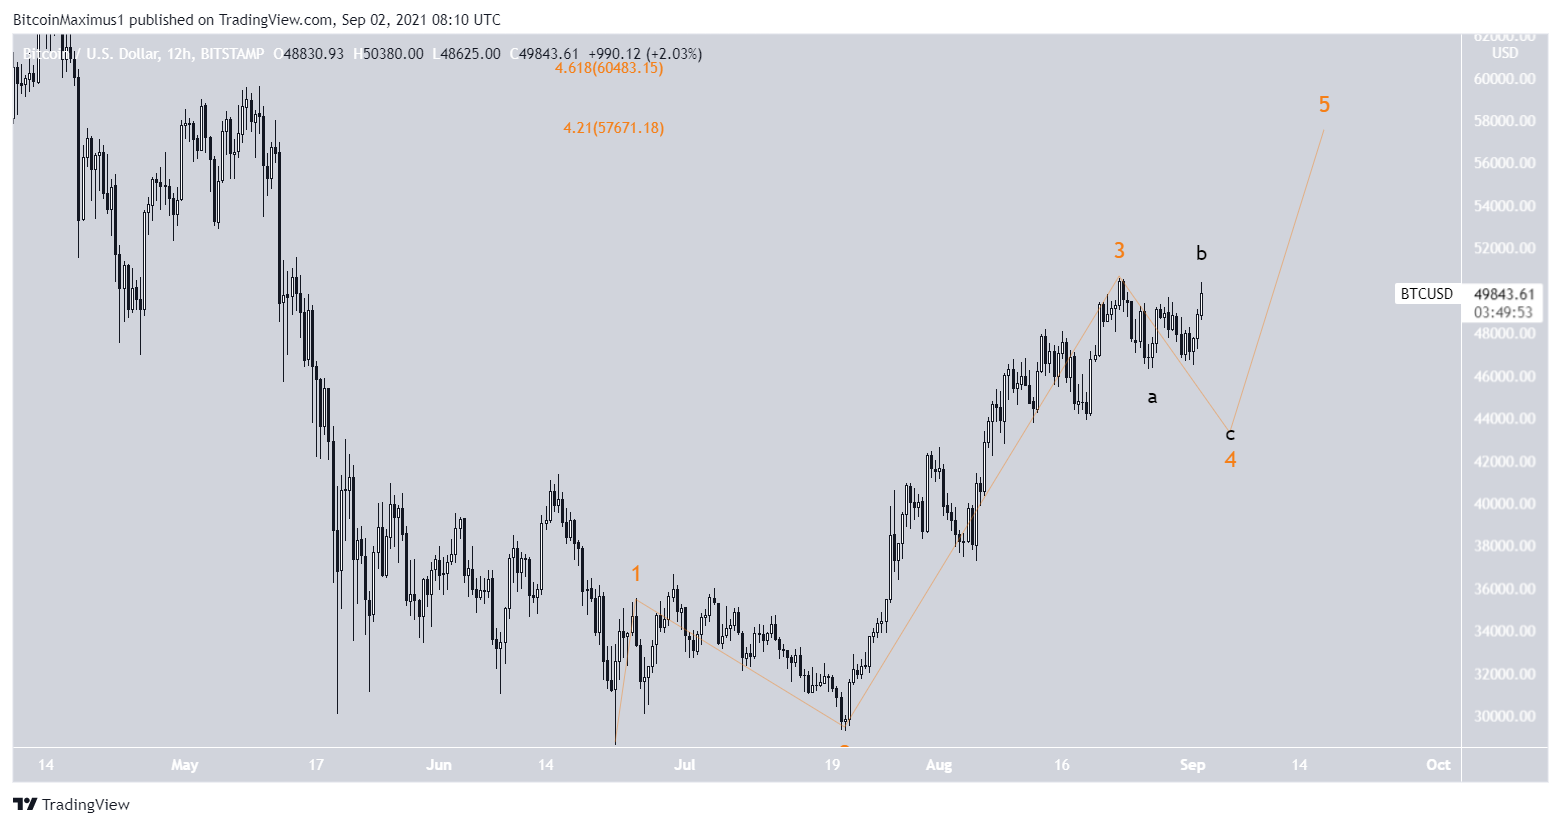
The most likely wave count suggests that BTC is in wave four of a bullish impulse (orange).
Because the breakout looks like a three-wave corrective structure, the most likely scenario would indicate that BTC will complete another slight drop before eventually moving upwards.
While the target for the top of wave five depends on the current bottom, a preliminary level would be between $57,700-$60,500.
For BeInCrypto’s previous Bitcoin (BTC) analysis, click here.
