
Bitcoin (BTC) has increased considerably since its Jan 10 lows and is showing several signs that indicate the corrective phase is complete.
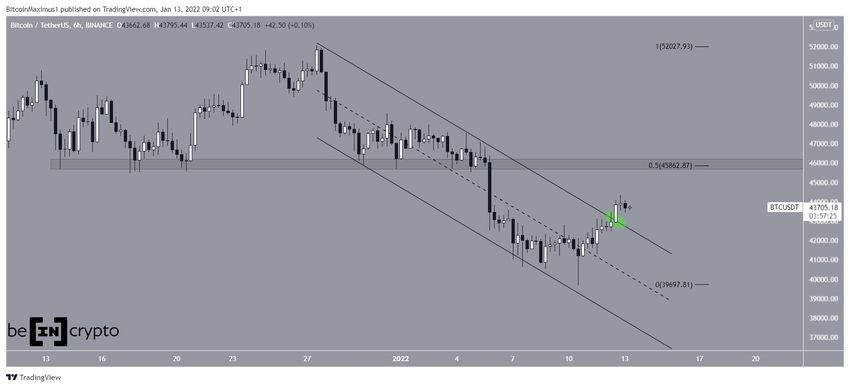
BTC had been trading inside a descending parallel channel since Dec 27. The movement inside it led to a low of $39,650 on Jan 10. However, BTC bounced immediately after and reclaimed the Dec 4 lows at the midline of the channel. This created a long lower wick, which is normally considered a sign of buying pressure.
On Jan 13, BTC broke out from the resistance line of the channel, confirming that the short-term correction had come to an end.
The closest resistance area is found at $45,850 that previously acted as support. This is the 0.5 Fib retracement resistance level and a horizontal resistance area.
Indicator readings
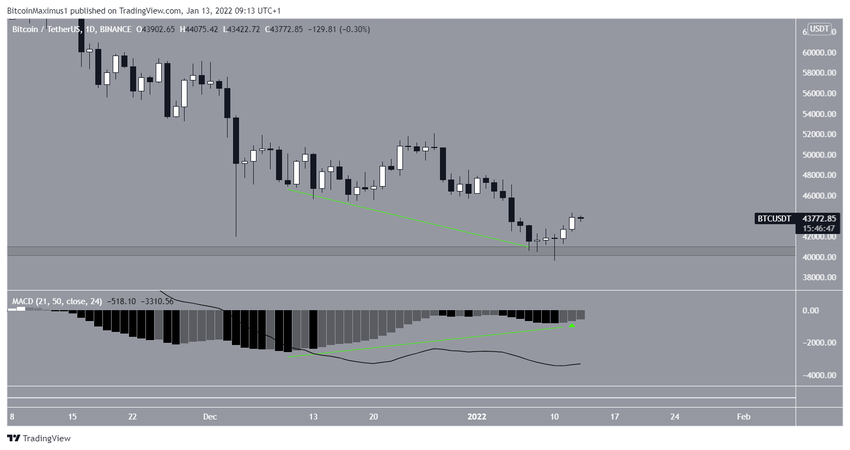
Technical indicators in the daily time frame are showing bullish signs. This is especially visible in the MACD, whose histogram has generated a very significant bullish divergence (green line). This is a sign that often precedes upward moves.
In addition to this, the successive higher momentum bars (green icon) alongside the bullish price close give a bullish reversal signal.
BTC wave count analysis
The long-term wave count still has several valid possibilities left.
However, the short-term count suggests that the ongoing descent measuring from the all-time high is complete (black). The sub-wave count is shown in red.
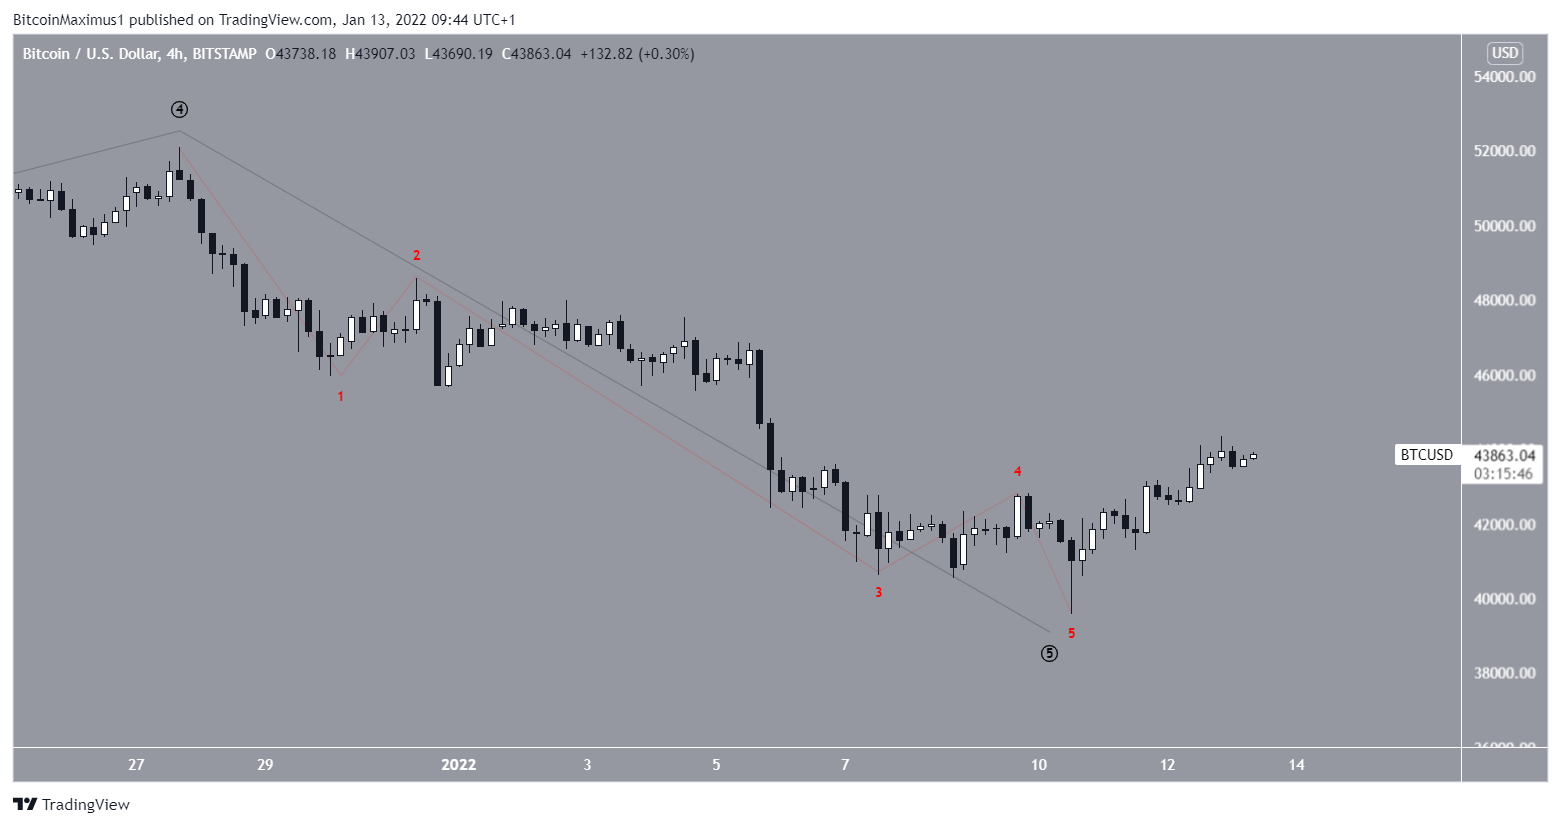
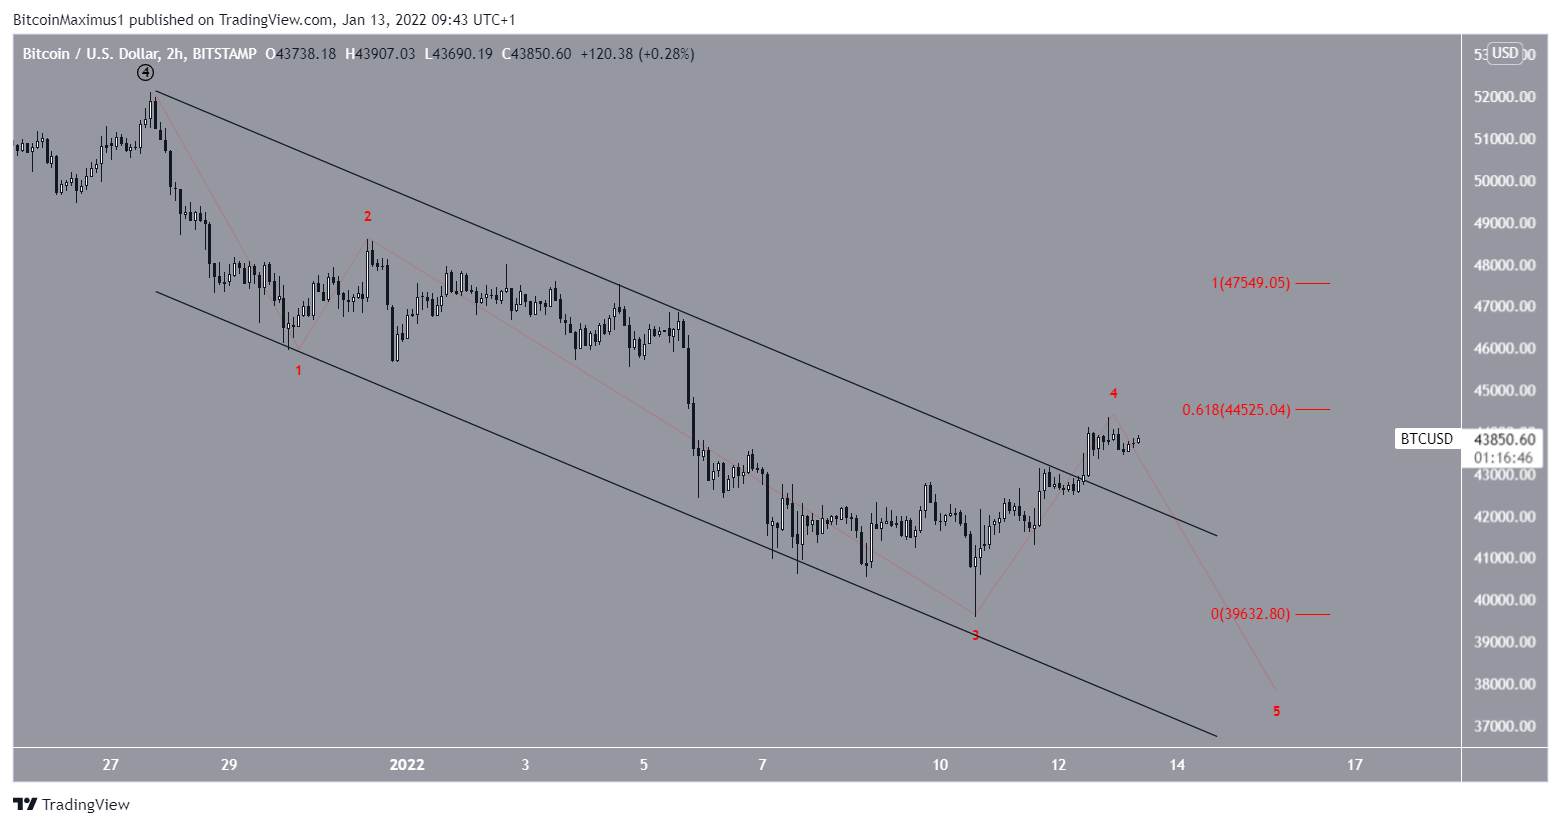
Due to the breakout from the channel and deep retracement of the potential sub-wave four (red), it does not seem likely that the current increase is part of sub-wave four.
So, the most likely scenario suggests that the correction is complete and BTC reached a bottom on Jan 10 after the $39,558 low.
For BeInCrypto’s previous Bitcoin (BTC) analysis, click here.
