


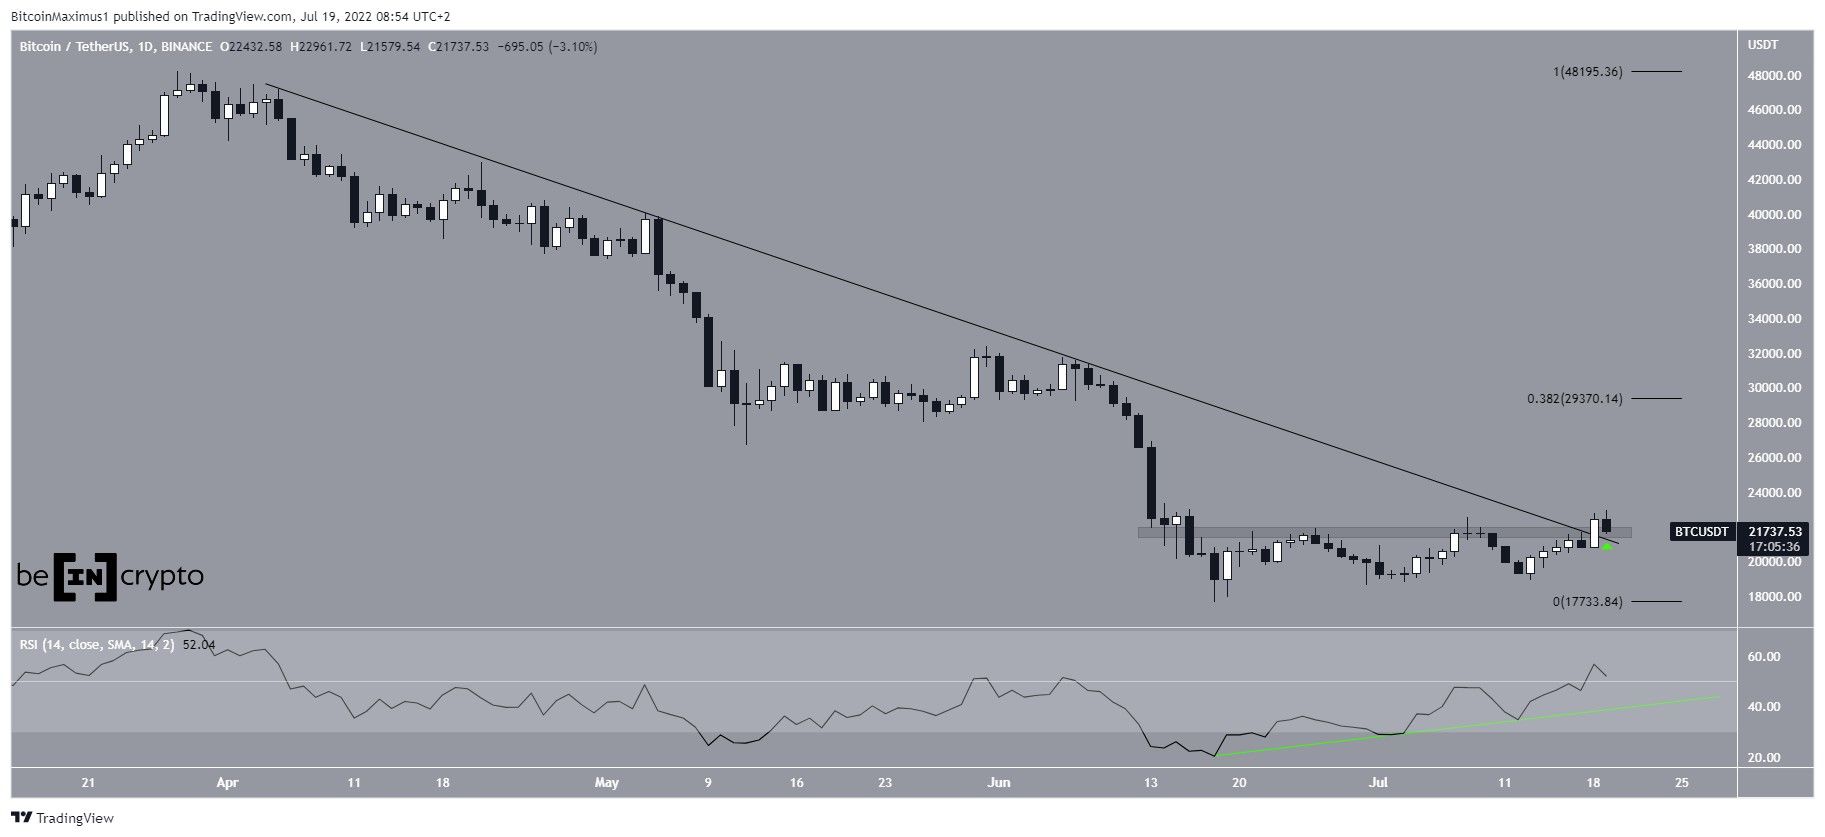
Bitcoin (BTC) has broken out above a descending resistance line that had been in place for three months. It seems to be attempting to validate the level as support, validating the breakout in the process.
Bitcoin had been trading underneath a descending resistance line since the beginning of April. The downward move led to a long-term low of $17,622 on June 18.
The price has been mostly moving sideways since then, but finally managed to break out above the line on July 18. The breakout also coincided with a reclamation of the $20,700 horizontal resistance area. Currently, BTC is attempting to validate both these levels as support.
The daily RSI is above 50 and is increasing above an ascending support line (green line). If the upward trend continues, the next closest resistance area would likely be found near $29,370.
Short-term movement
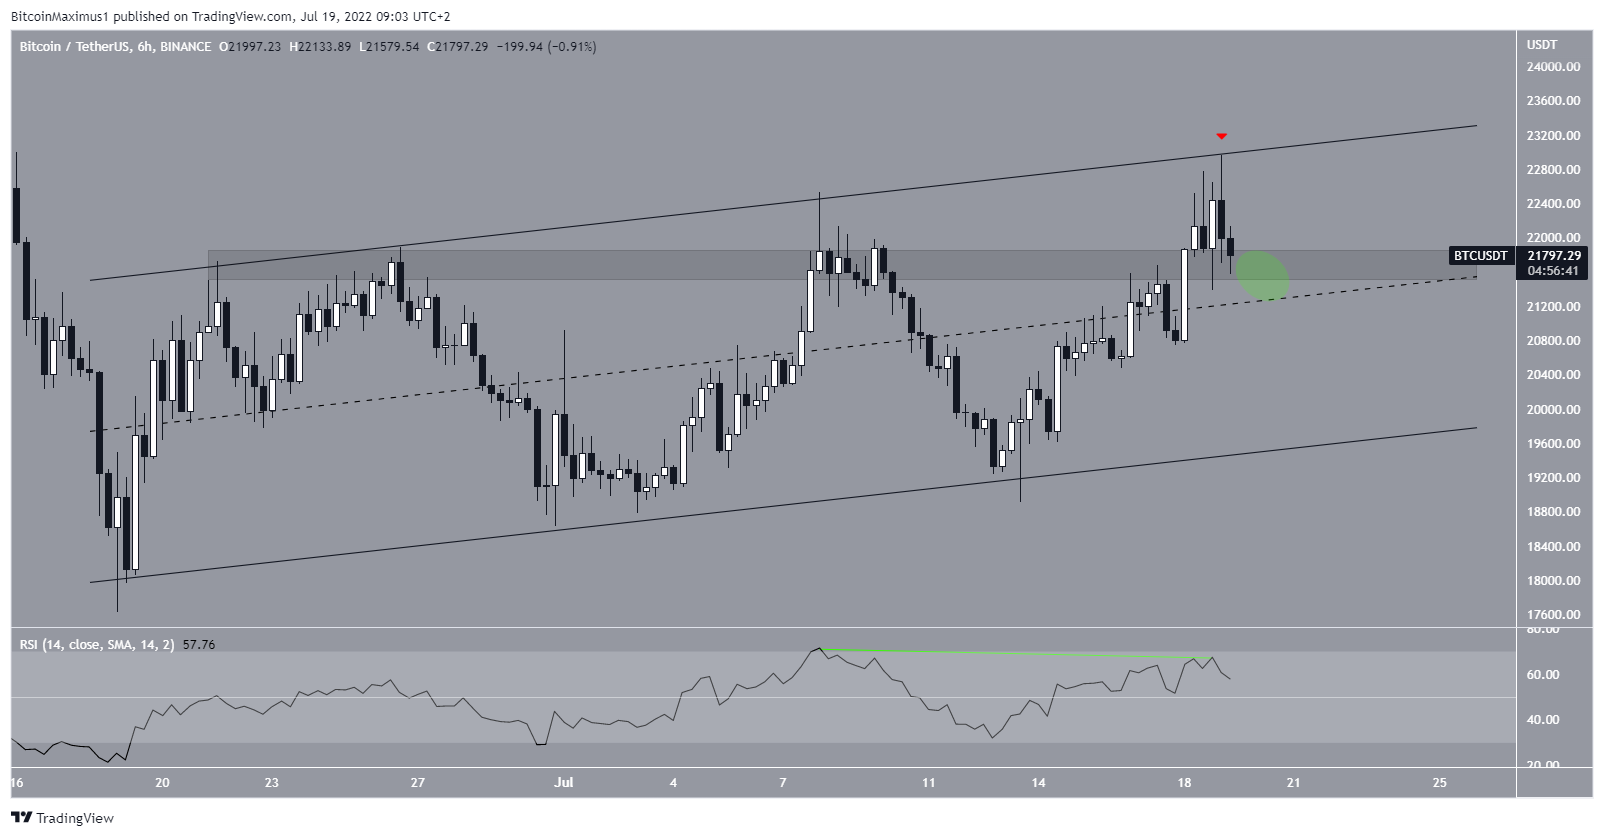
Unlike the daily chart, the six-hour chart provides a mixed outlook.
BTC is trading inside an ascending parallel channel. Such channels usually contain corrective movements, meaning that an eventual breakdown from it would be likely. The price was rejected by the resistance line of the channel (red icon) on July 19 and the RSI has generated a bearish divergence (green line).
On a bullish note, BTC is still trading above the midline of the channel and the previously outlined $21,700 horizontal support area.
Until the price either breaks out from the channel or falls below its midline, the direction of the short-term trend remains unclear.
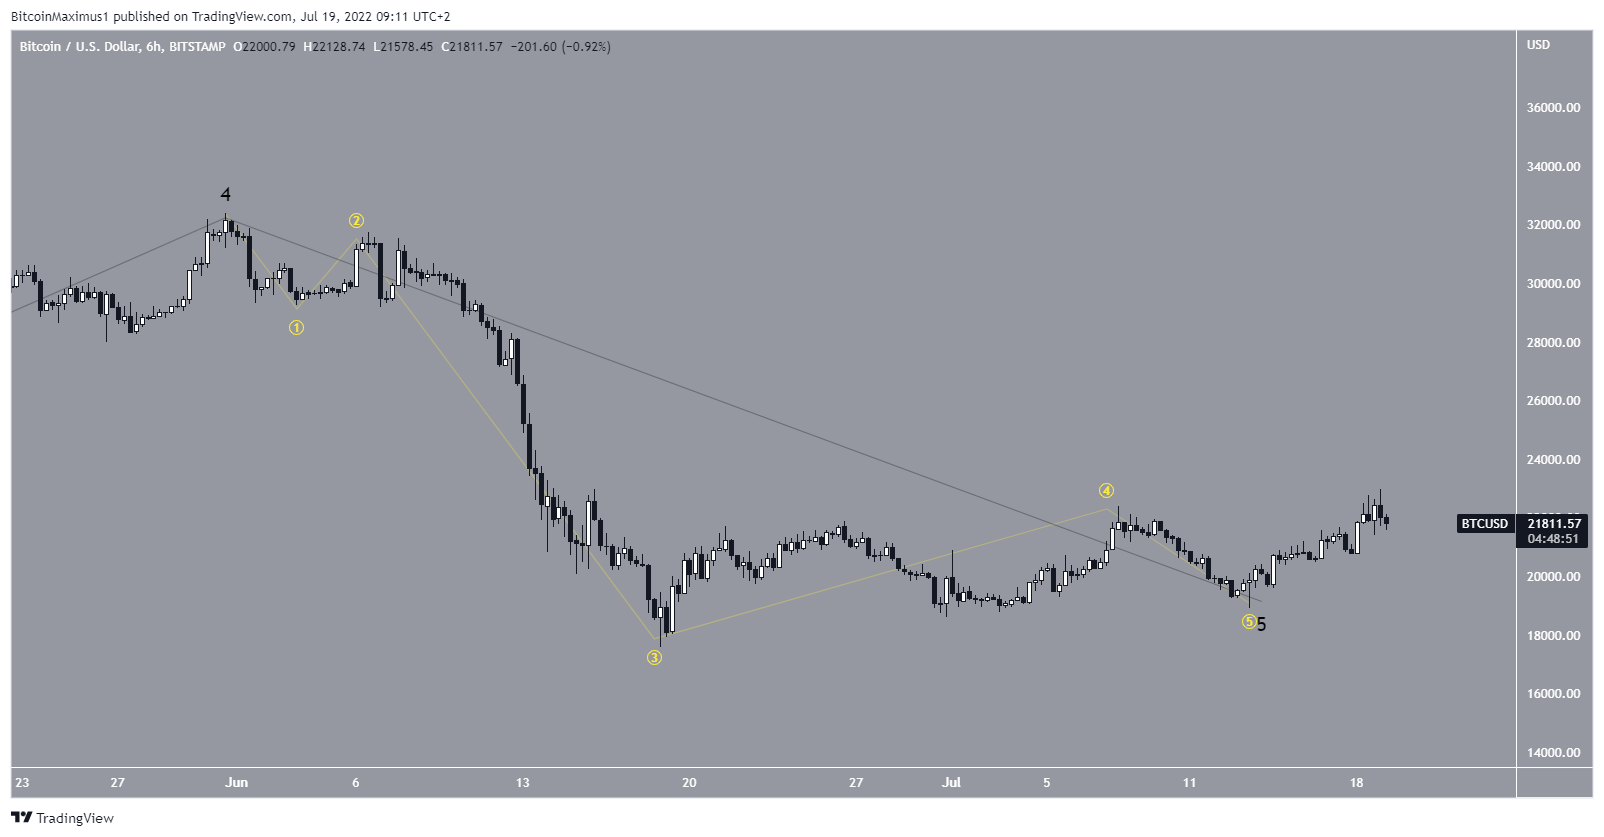
BTC wave count analysis
The most likely wave count suggests that bitcoin has already completed a five-wave downward move (yellow) when measuring from the beginning of April. In this potential count, wave five was truncated, ending above the bottom of wave three.
This count would also complete a longer-term wave five.
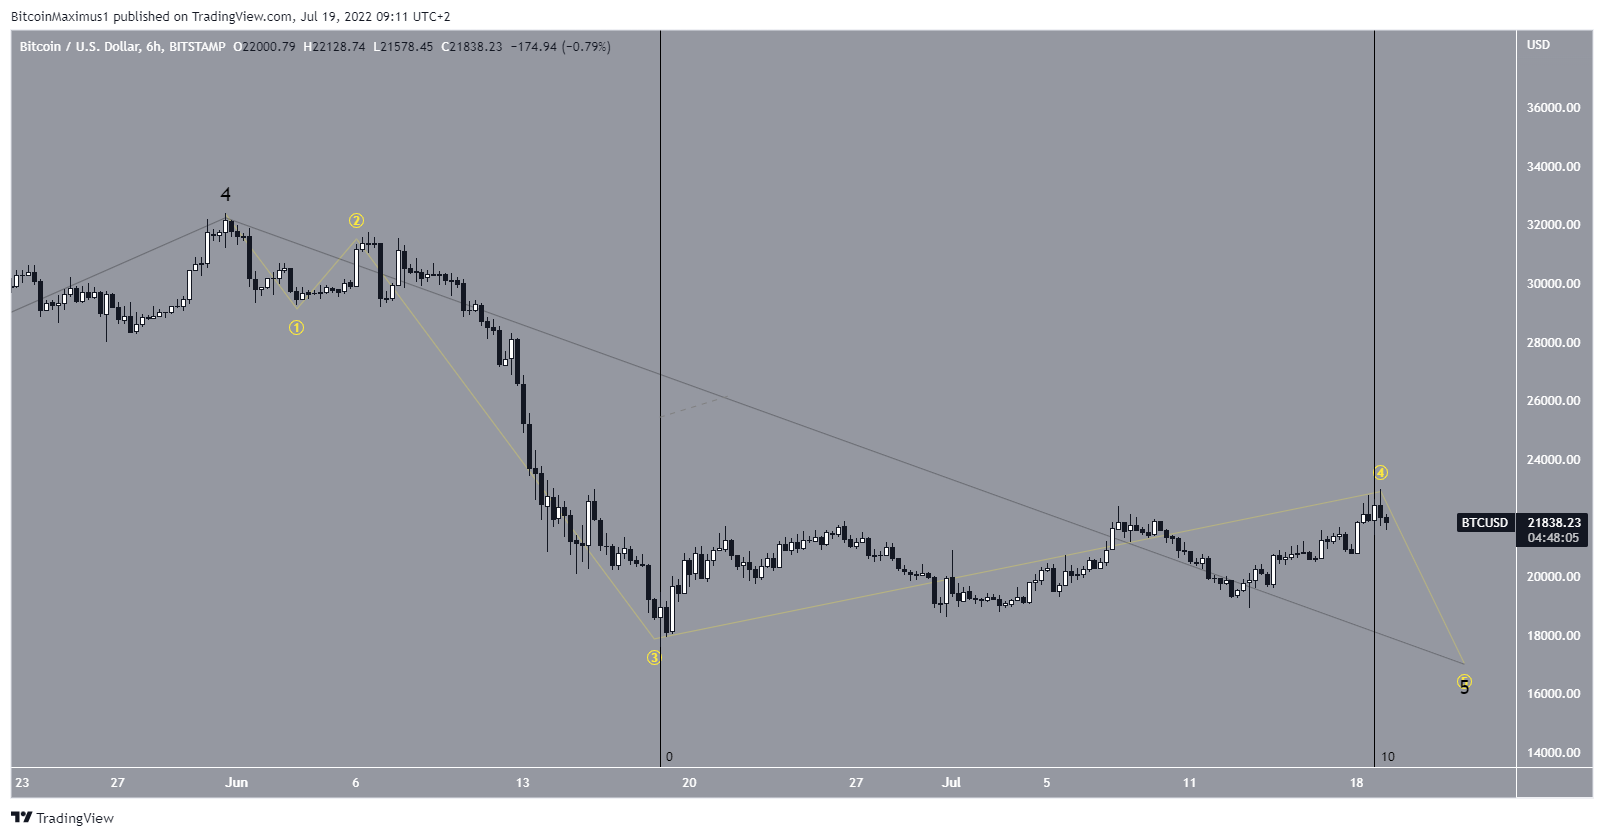
The alternate count comes from the ambiguity in the six-hour chart, which shows some bearish signs. In it, BTC has just completed wave four and could drop once more in order to complete wave five. The issue with this count is the fact that wave four is ten times longer than wave two, which is extremely unusual for such structures.
For Be[in]Crypto’s previous bitcoin (BTC) analysis, click here.


