

The bitcoin (BTC) price briefly moved above $60,000 on April 1 but decreased shortly after.
Bitcoin is expected to validate the $59,500 area as support and gradually increase towards a new all-time high.
Bitcoin Reaches $60,000
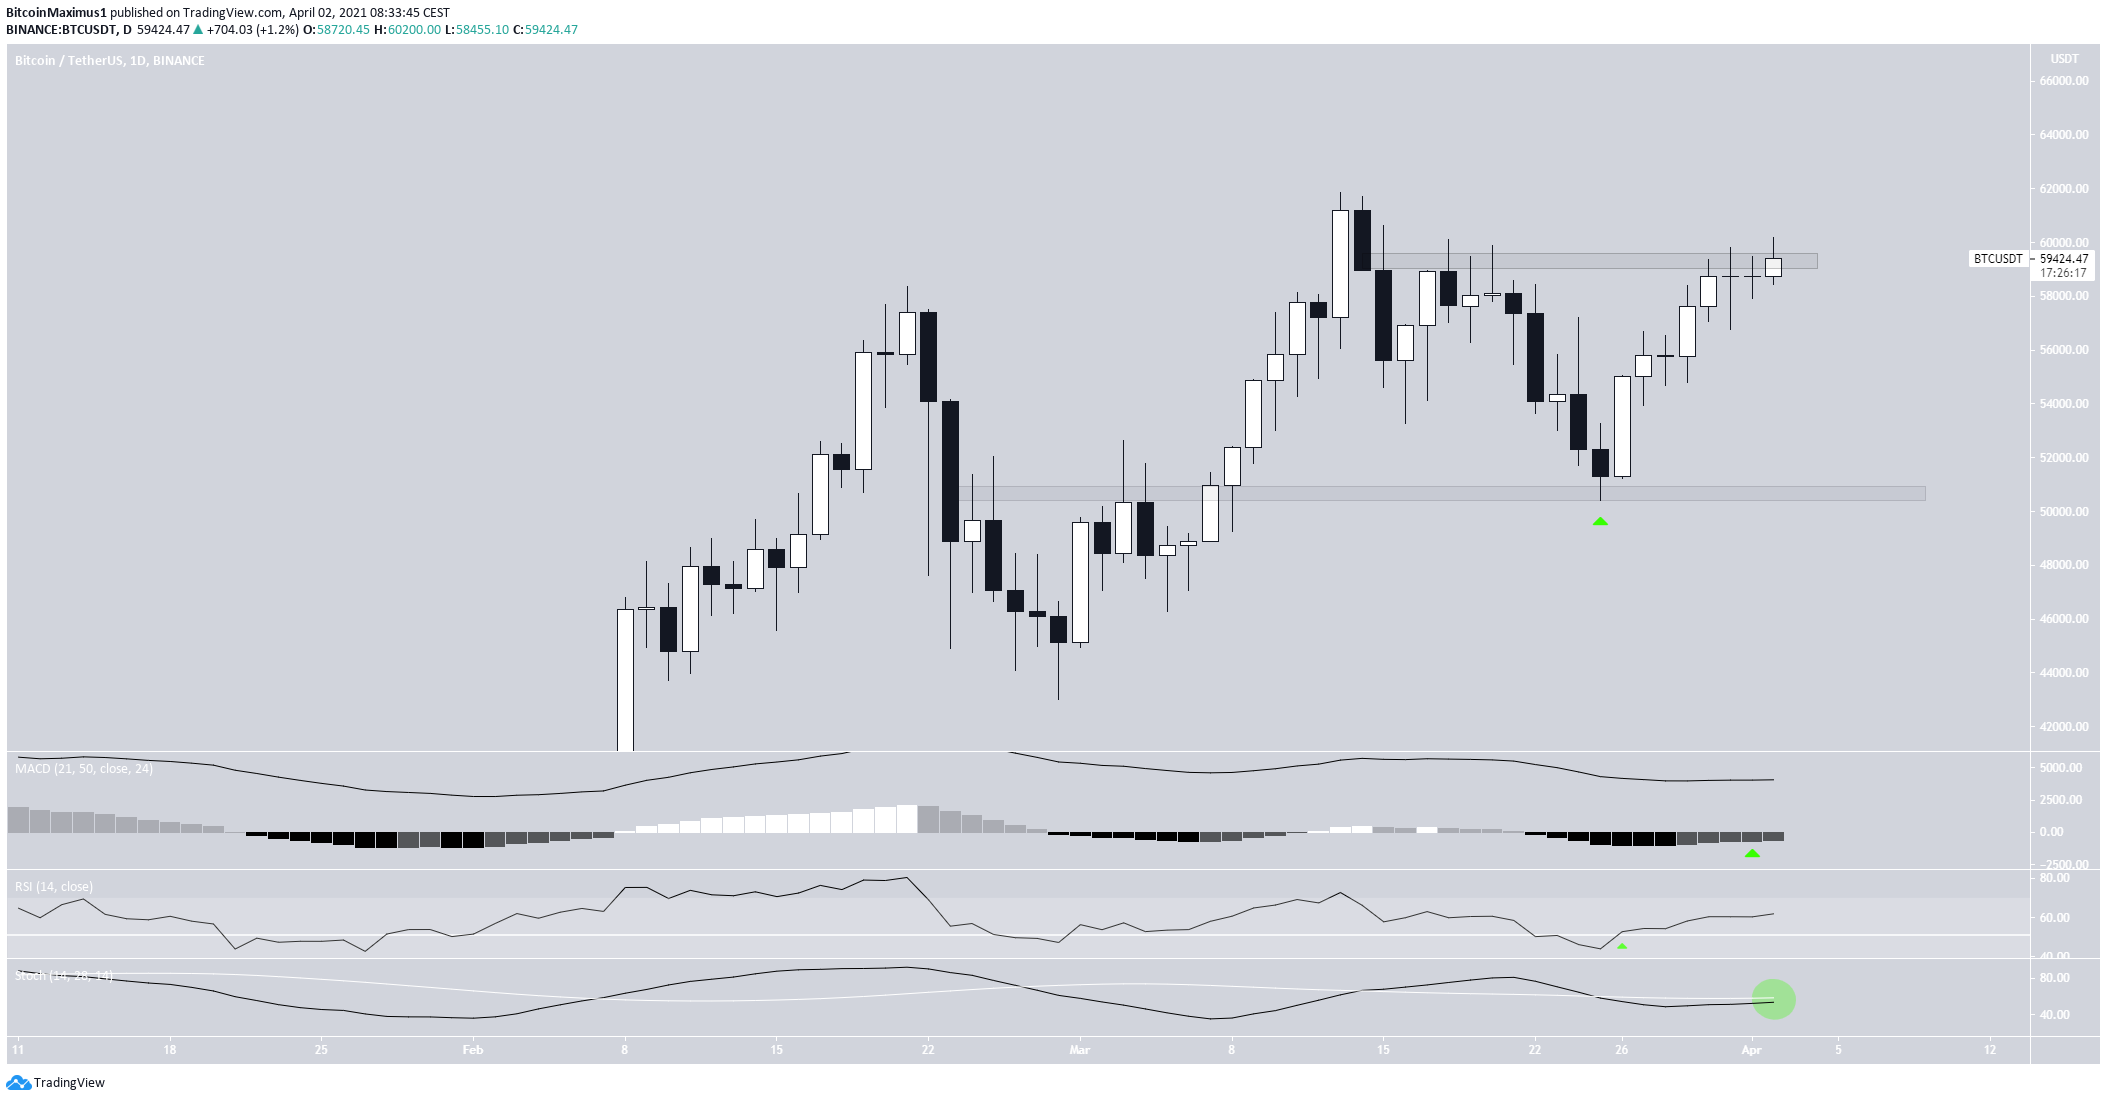
The daily chart shows that BTC has been increasing since March 25. Yesterday, it briefly broke $60,000 before retracing slightly.
However, BTC has yet to reach a close above the $59,500 resistance area. It has not done so since it reached an all-time high on March 13.
Nevertheless, technical indicators are bullish. This is evidenced by the bullish reversal signal in the MACD and bullish cross in the Stochastic oscillator.
Therefore, the trend is likely bullish and BTC is expected to reach a new all-time high price.
Short-Term Movement
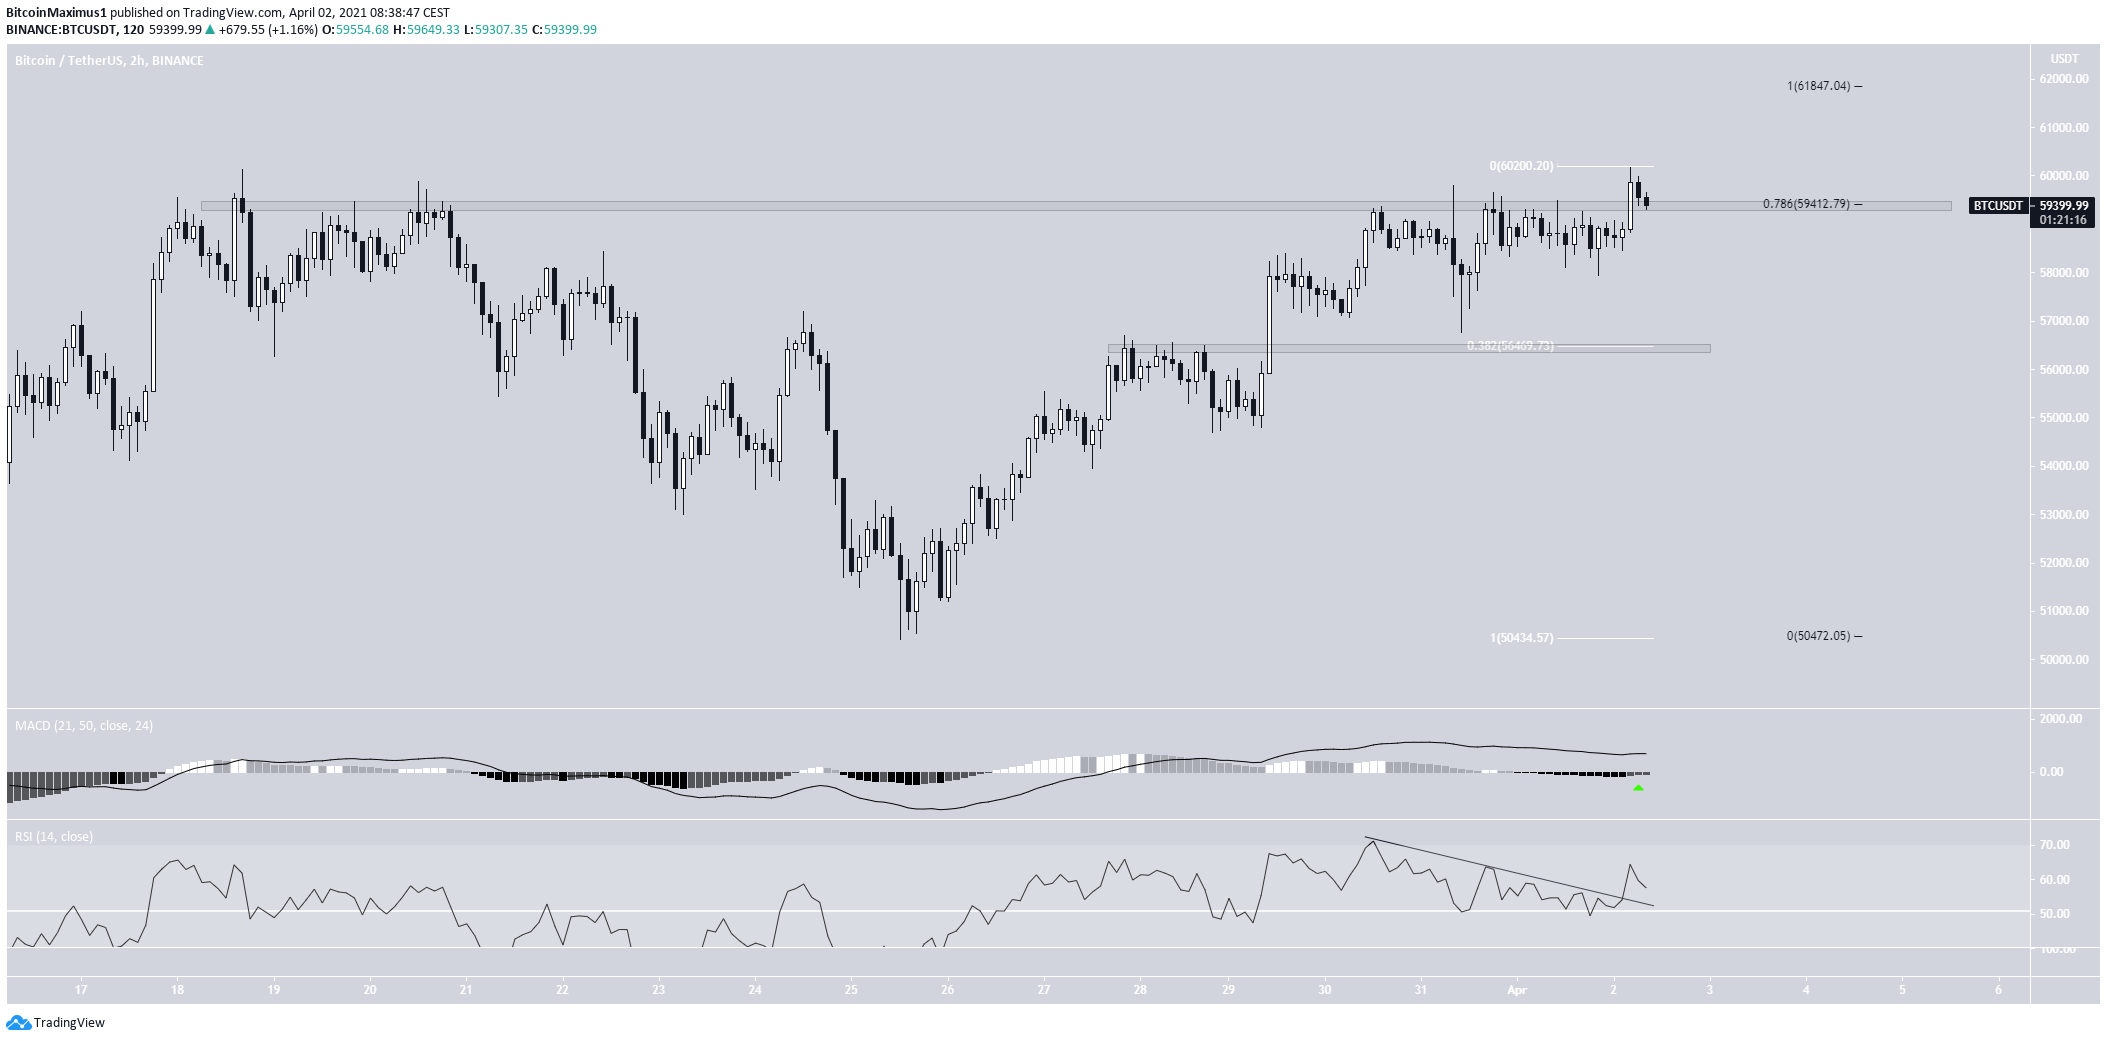
The short-term chart shows that BTC has already broken out above $59,500. Currently, it’s in the process of validating this level as support.
In addition, the RSI has broken the bearish divergence trendline and the MACD is moving upwards. This aligns the short-term readings with those from the daily time frame.
Besides the $59,500 area, the next support is found at $56,500.
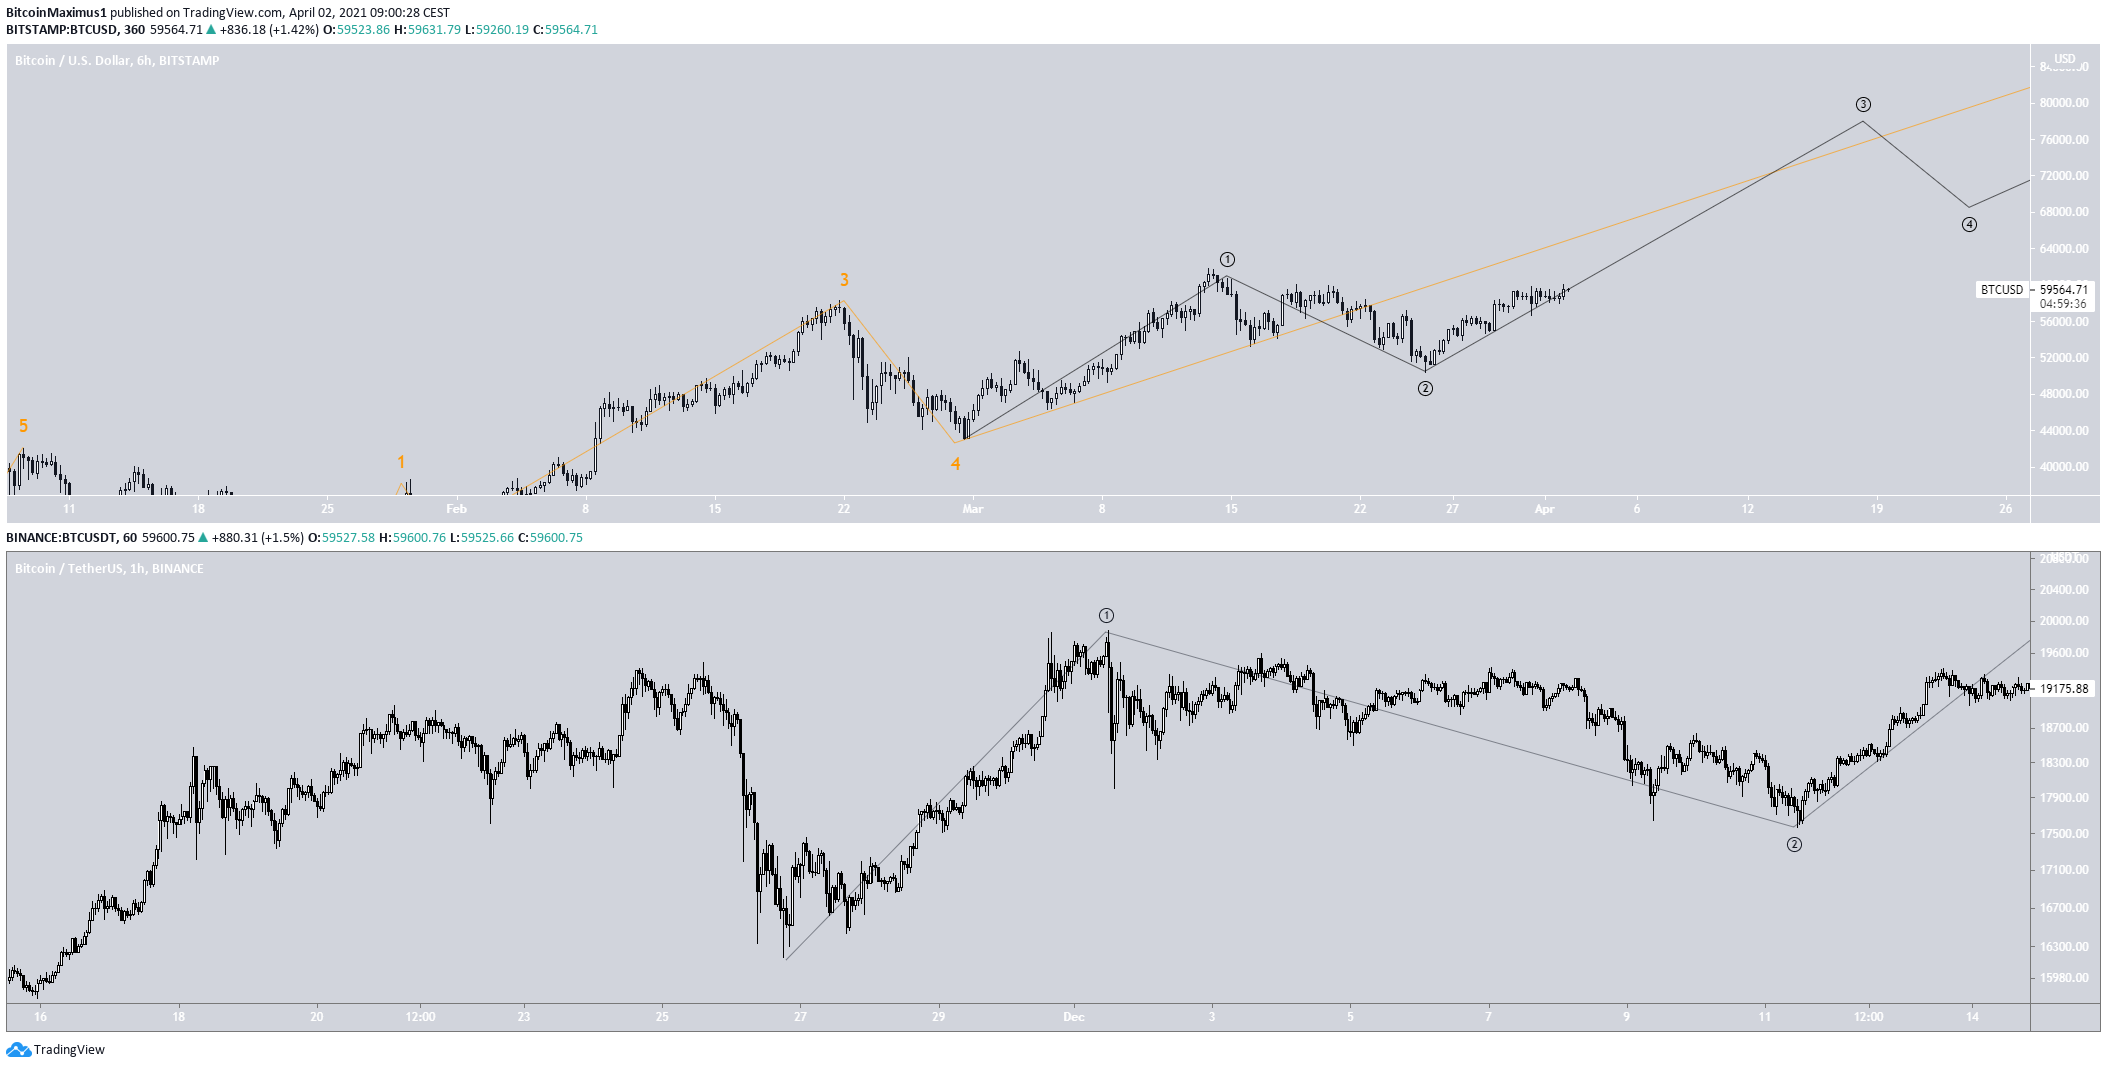
Bitcoin Wave Count
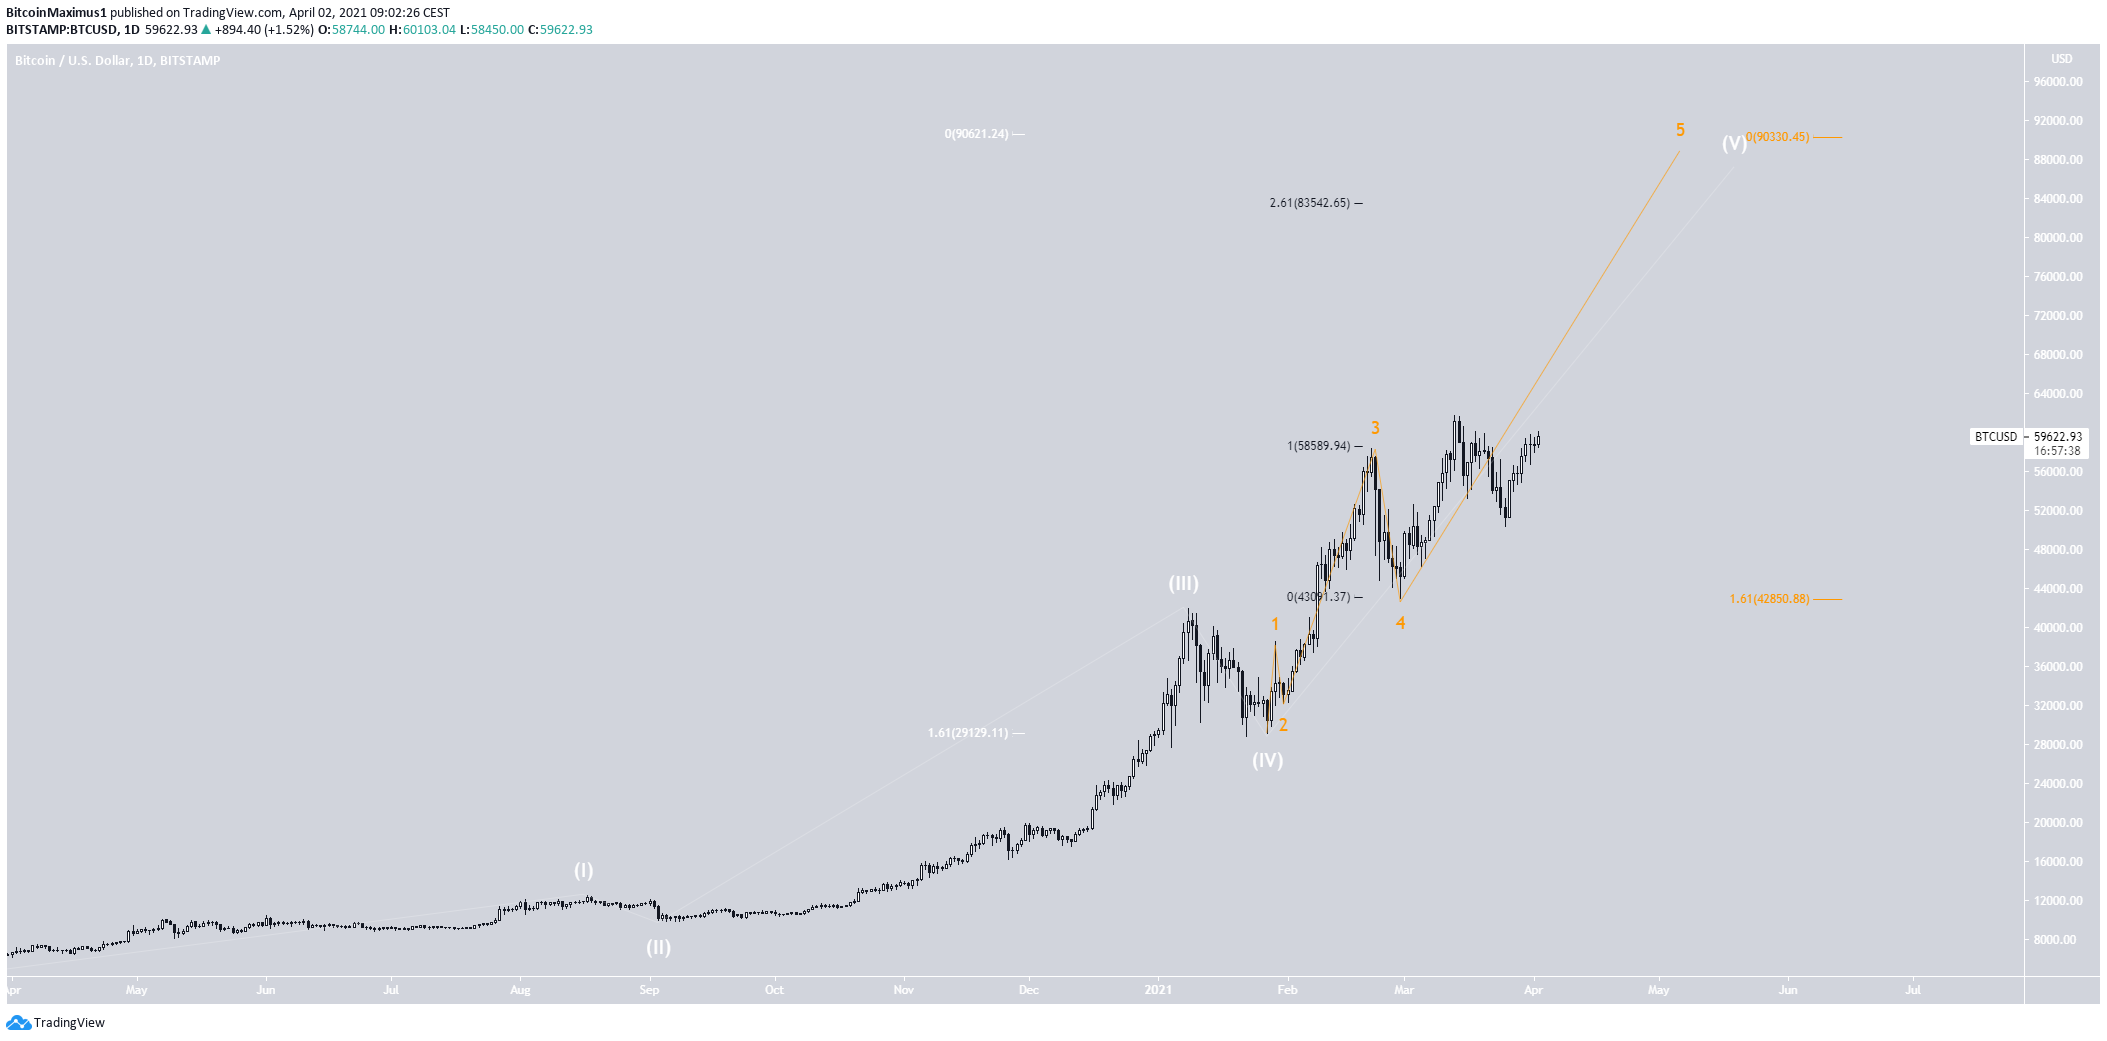
The wave count suggests that bitcoin is in wave five (white) of a bullish impulse that began in March 2020.
The sub-wave count is shown in orange.
While a previous target was given at $70,000, it seems that sub-wave five will extend.
Therefore, the next most likely target is likely between $83,500-$90,000. The upper portion of this target is found by using Fib projections on waves 1-3 and sub-waves 1-3 (white and orange Fib).
In addition, the lower number of this target range was found by using an external retracement on sub-wave four.
There is a distinct similarity between the movement that broke the current all-time high and that which broke the previous all-time high of $20,000.
While both initially seemed to be sub-wave fives, they extended. Therefore, what followed after the retracement from the first breakout was a very significant upward move that led to the current all-time high.
It’s possible that the same will happen this time around.
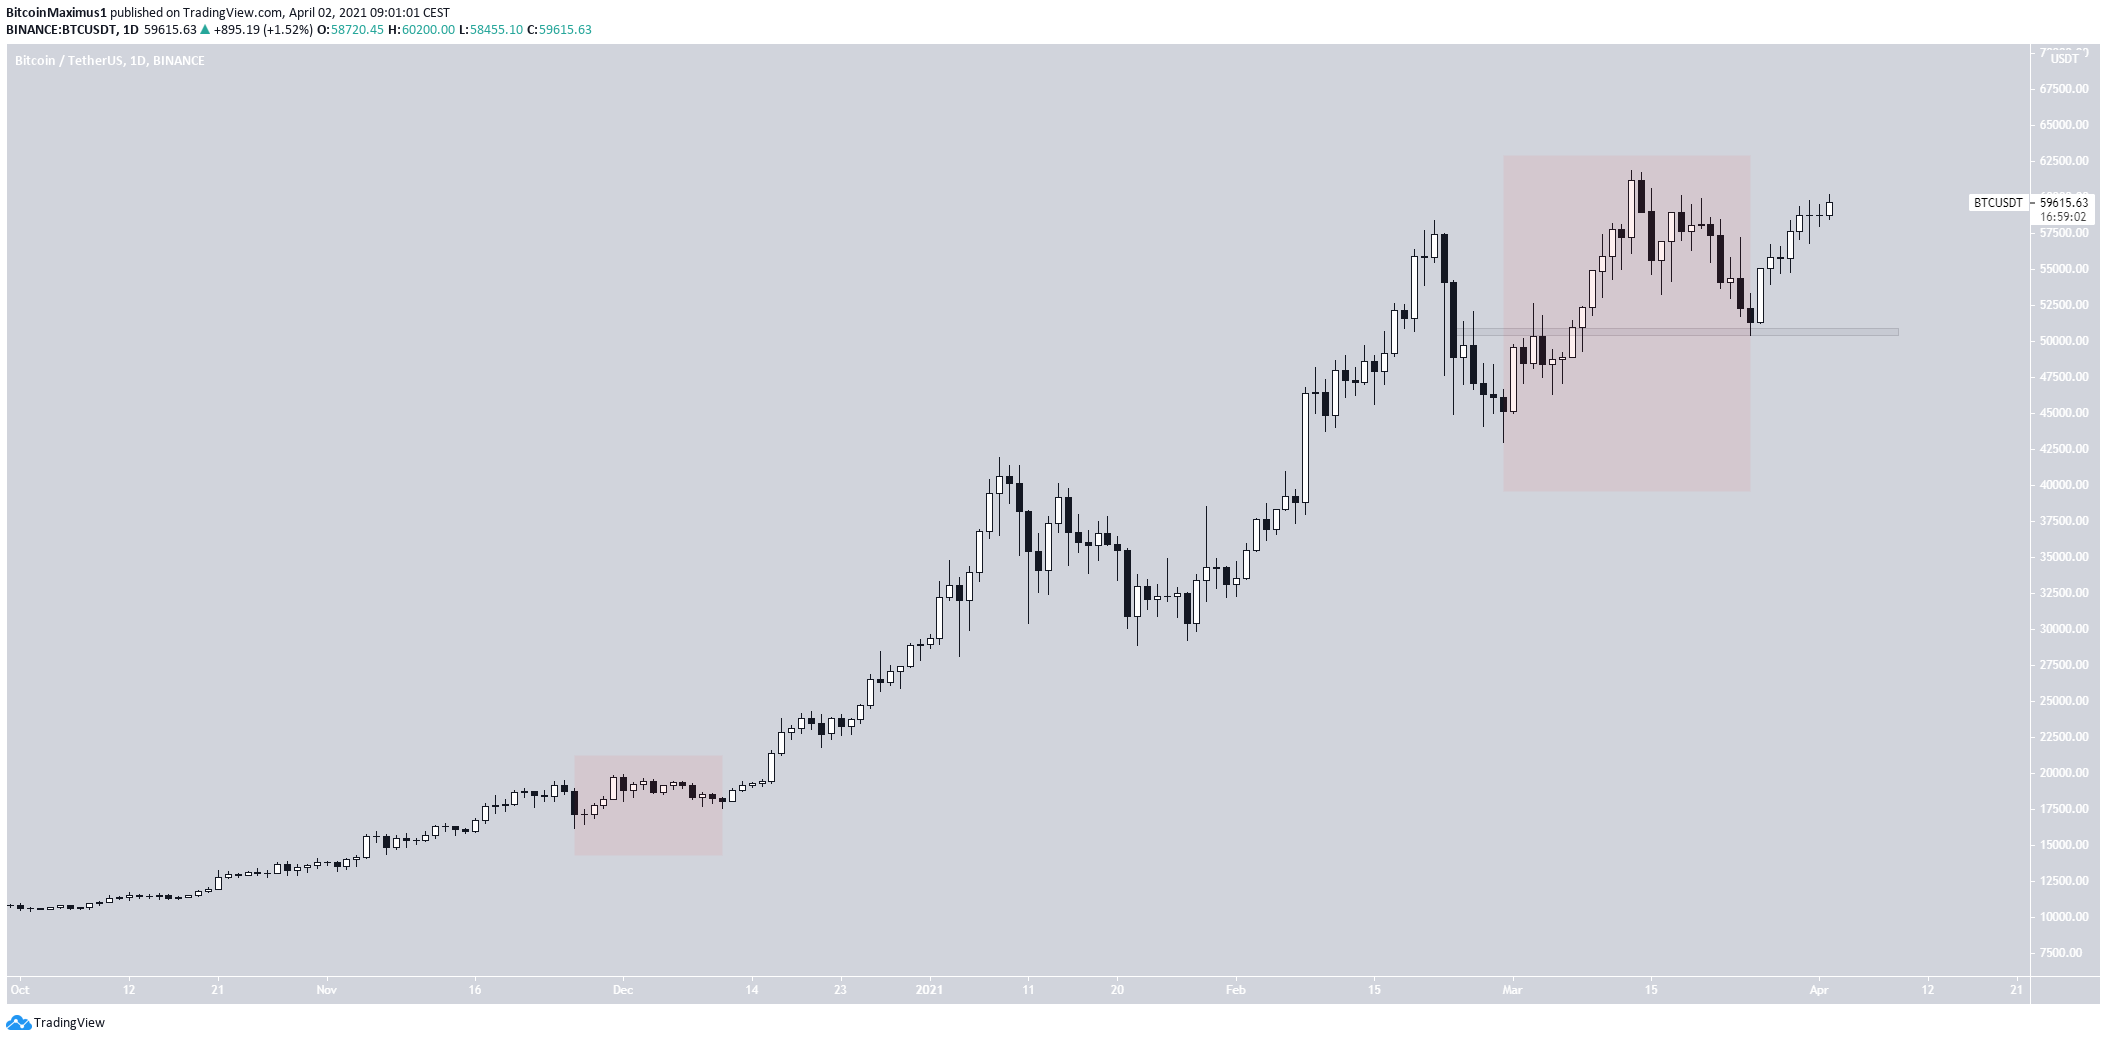
The minor sub-waves (black) for both movements are shown below.
Conclusion
Bitcoin is expected to validate the $59,500 area as support and move towards a new all-time high price.
For BeInCrypto’s previous bitcoin (BTC) analysis, click here.
Disclaimer
In line with the Trust Project guidelines, this price analysis article is for informational purposes only and should not be considered financial or investment advice. BeInCrypto is committed to accurate, unbiased reporting, but market conditions are subject to change without notice. Always conduct your own research and consult with a professional before making any financial decisions. Please note that our Terms and Conditions, Privacy Policy, and Disclaimers have been updated.
