
Bitcoin (BTC) has broken down from a descending parallel channel that has been in place since April 14.
It’s currently attempting to find support, approaching a strong Fib support area near $37,000.
BTC breaks down from channel
BTC had been trading inside a descending parallel channel since April 14. While it initially bounced at the support line of this channel, it proceeded to break down on May 19.
Currently, it’s trading at a horizontal support area found at $39,000.
However, technical indicators are bearish. The Stochastic oscillator has just made a bearish cross and the RSI has fallen below 30. The MACD is also negative and decreasing.
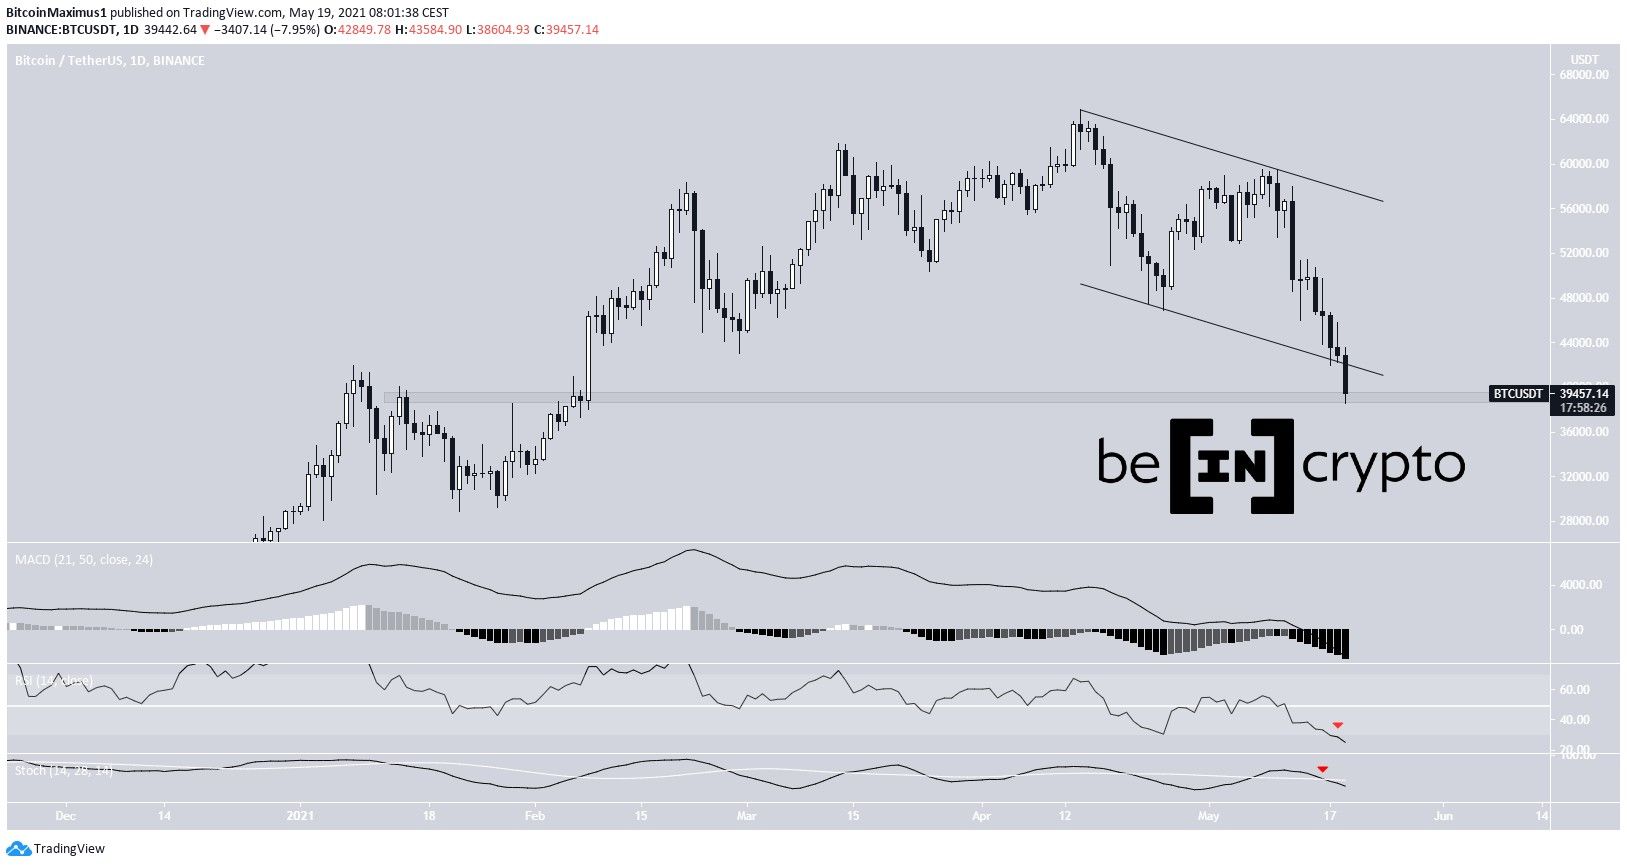
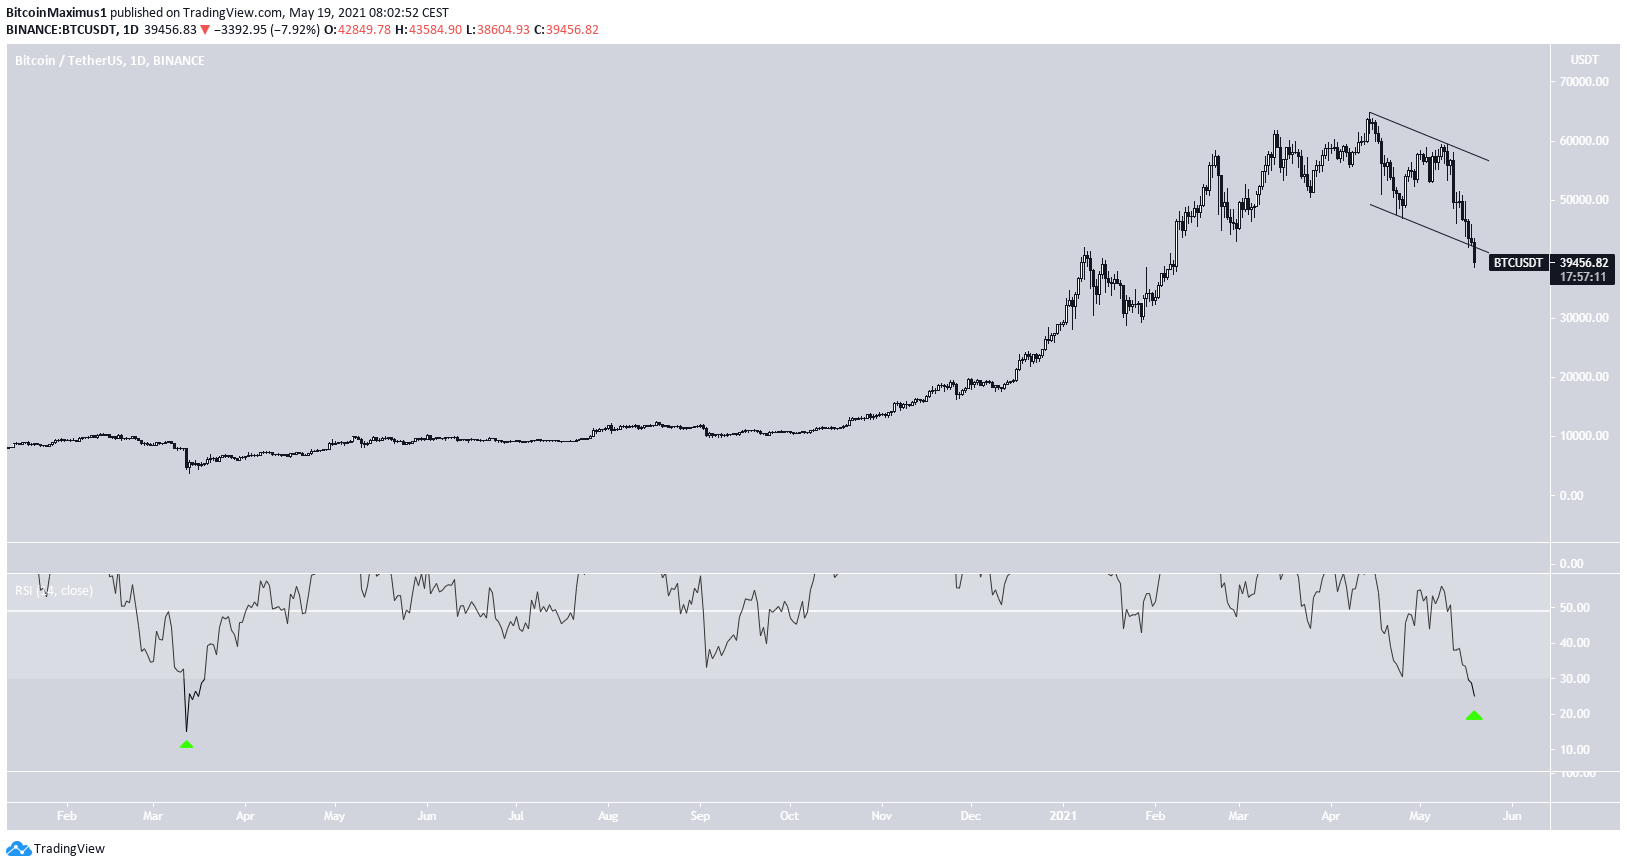
An interesting development is that the daily RSI is at its lowest level since the March 2020 crash, when it was at 14.5. The RSI is currently sitting around 24.5 today.
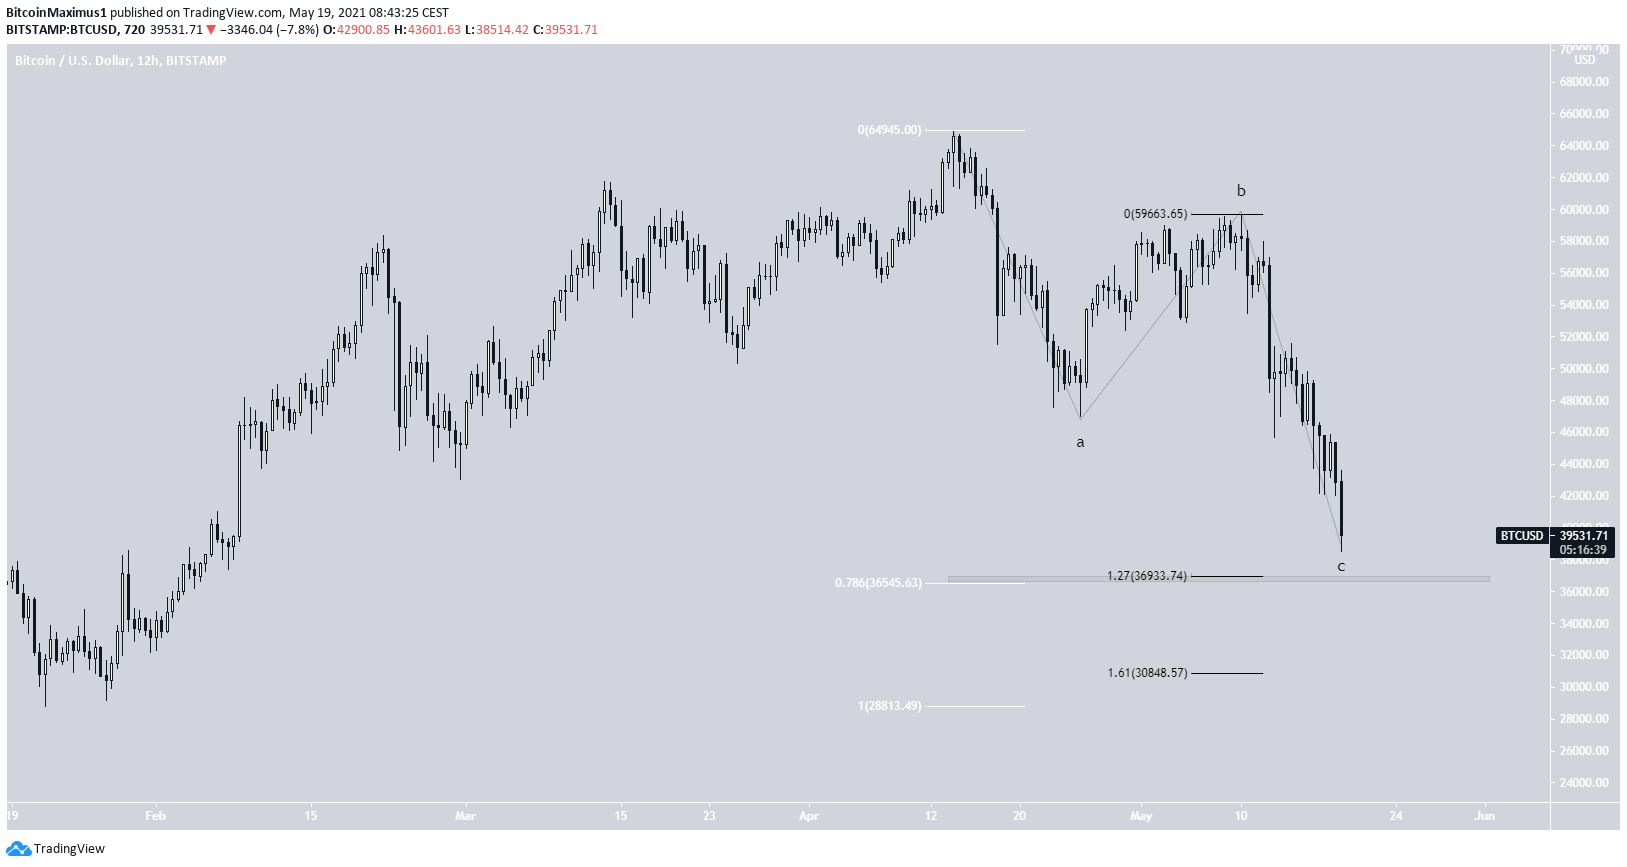
BTC wave count
The wave count suggests that this is wave C of an A-B-C corrective structure.
There is a confluence of Fib targets between $36,500 and $36,930. This is the 0.786 Fib retracement support level of the most recent upward movement (white). In addition, it would give waves A:C a 1:1.27 ratio.
If this zone fails, the next support level would likely be found near $30,848.
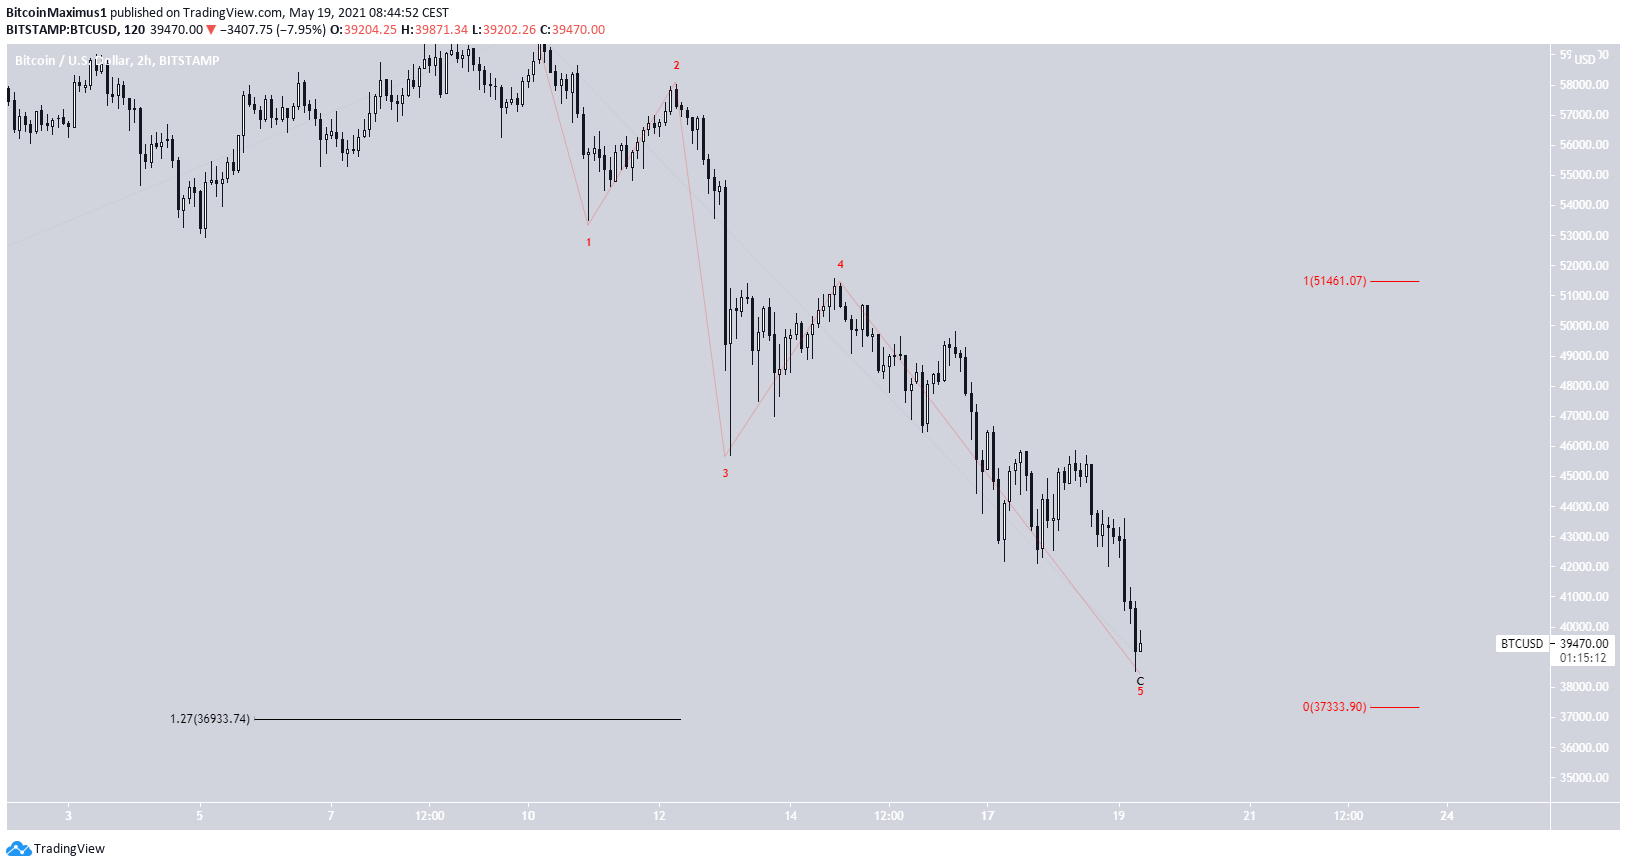
The even shorter-term chart provides a similar target near $37,333. This is found using a Fib projection on sub-waves 1-3 (red).
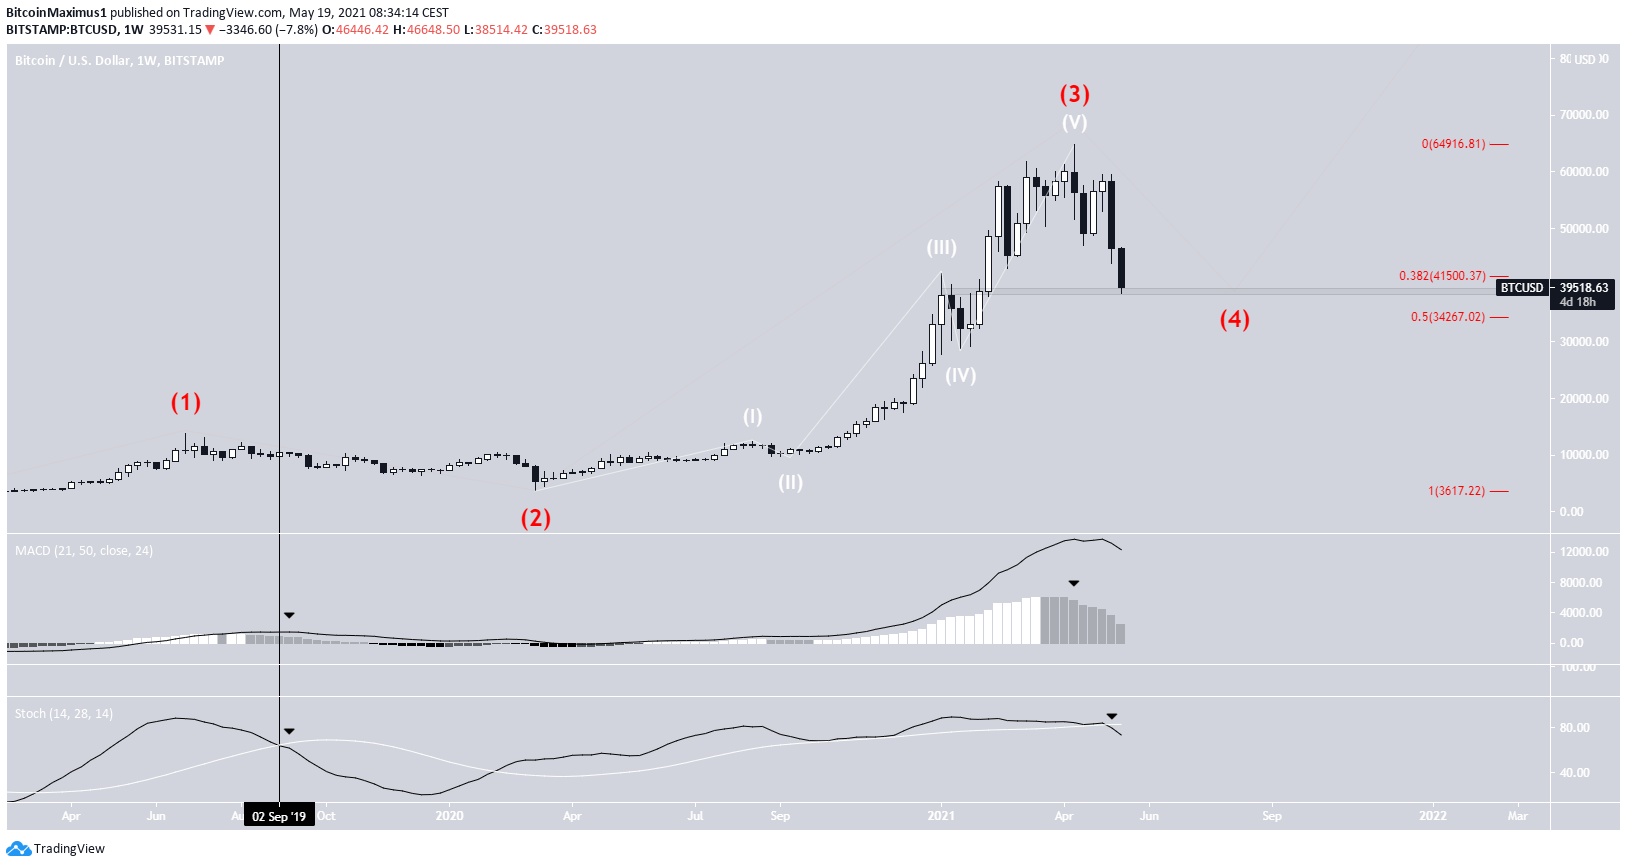
Long-term count
The weekly chart shows two bearish developments. It’s the first time since September 2019 that the MACD has given a bearish reversal signal and the Stochastic oscillator has made a bearish cross.
At the time, BTC was in corrective cycle wave two. Therefore, it makes sense that the price is currently in cycle wave four.
The main support levels are found at $41,500 and $34,267. These are the 0.382 and 0.5 Fib retracement levels.
While it has fallen below the former, the weekly candlestick could still close above it while leaving a long lower wick. This would make sense considering that the price has just reached a horizontal support area, which could be a resistance-to-support flip.
Conclusion
Bitcoin is approaching a strong Fib support area found near $37,000. This level could help BTC to rebound.
For BeInCrypto’s previous bitcoin (BTC) analysis, click here.
