


Bitcoin (BTC) broke out from descending wedge pattern on May 4, but the upward movement could not be sustained and the price fell sharply the next day.
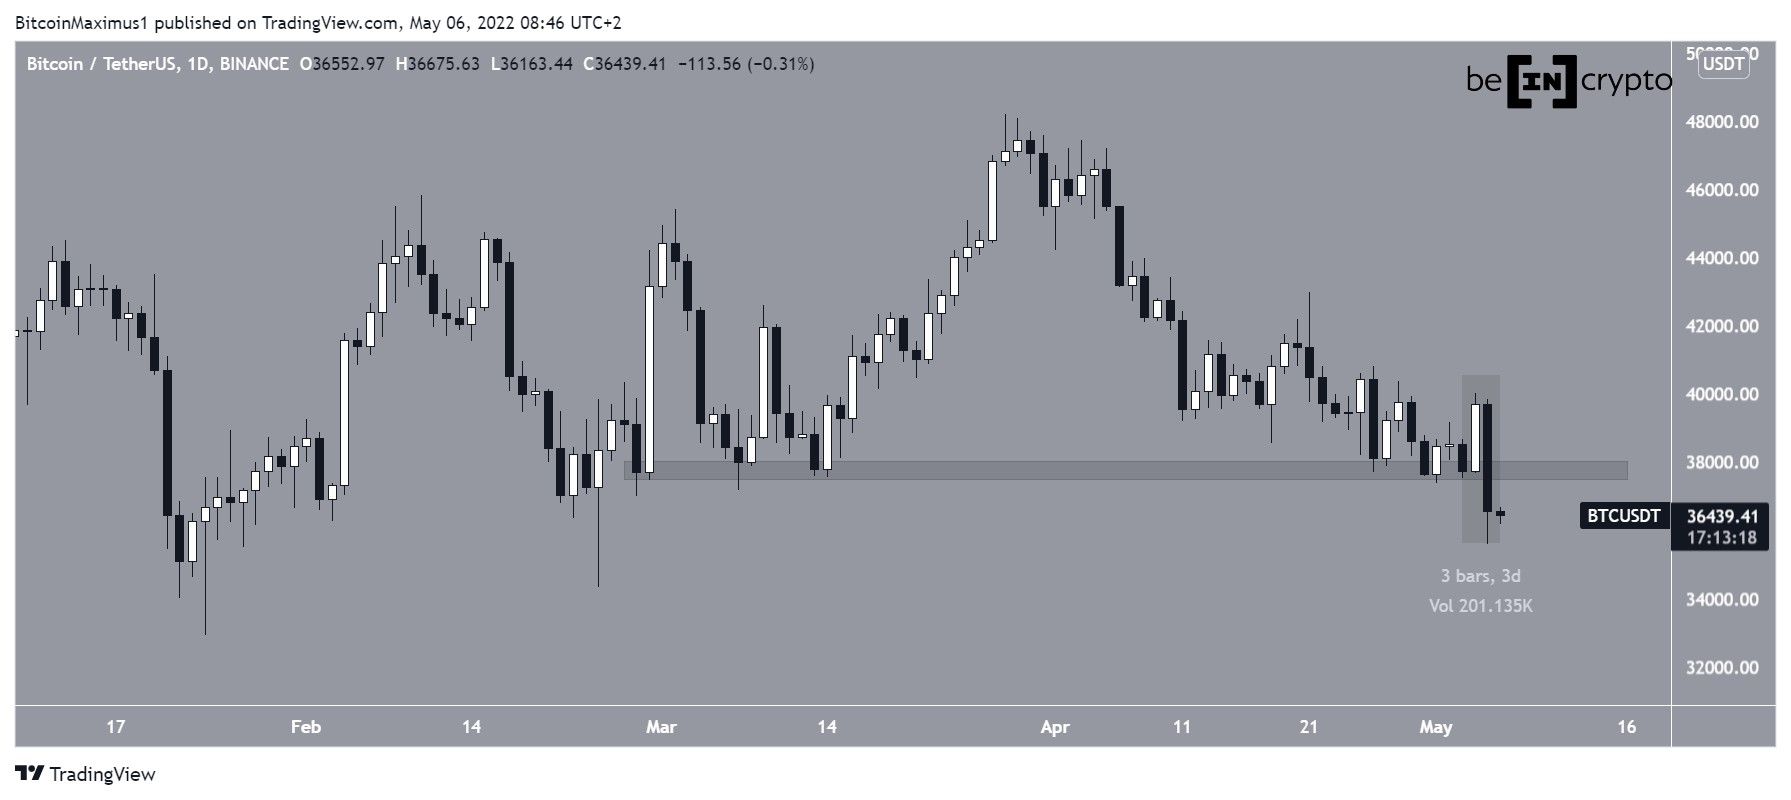
Bitcoin has been falling since reaching a local high of $48,189 on March 28. The downward move led to a low of $37,386 on May 1, which validated the $37,800 horizontal area as support. This level had been providing support since the beginning of March.
While BTC initially reached a high of $40,023 on May 4, it fell sharply the next day.
On May 5, the price created a bearish engulfing candlestick (highlighted). This caused a breakdown from the $37,800 horizontal support level, which had been in place since the beginning of March.
Failed breakout
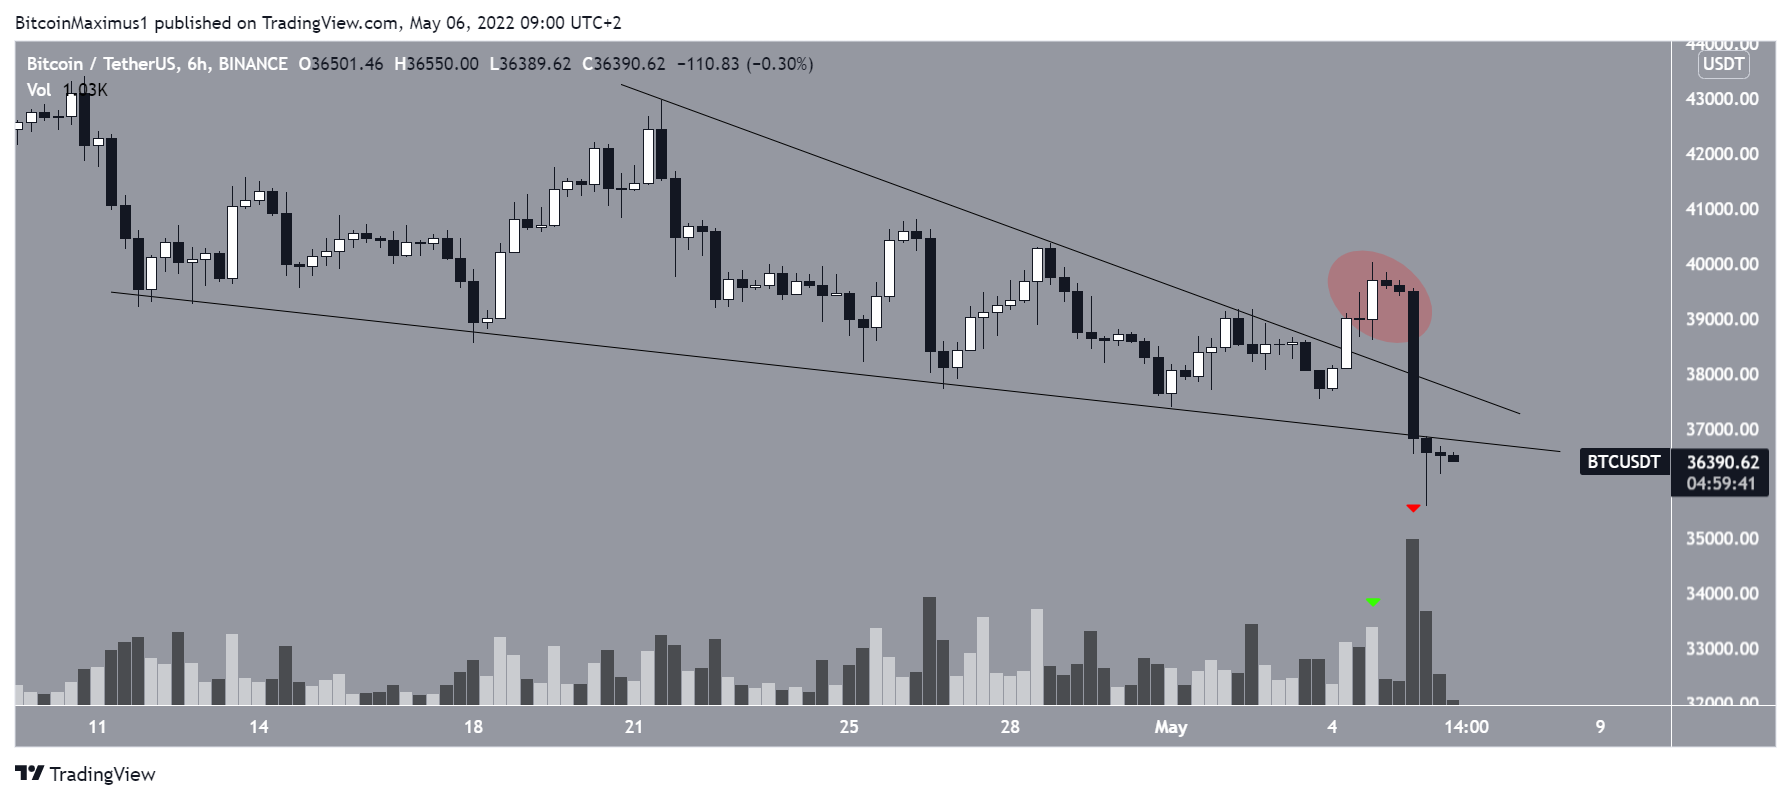
The six-hour chart shows that BTC had been trading inside a descending wedge since April 11. On May 4, it seemed to finally break out from the wedge (red circle), although it did not occur with significant volume (green icon).
The upward move could ultimately not be sustained (red circle), and BTC fell sharply the next day. The decrease did transpire with significant volume, increasing its validity.
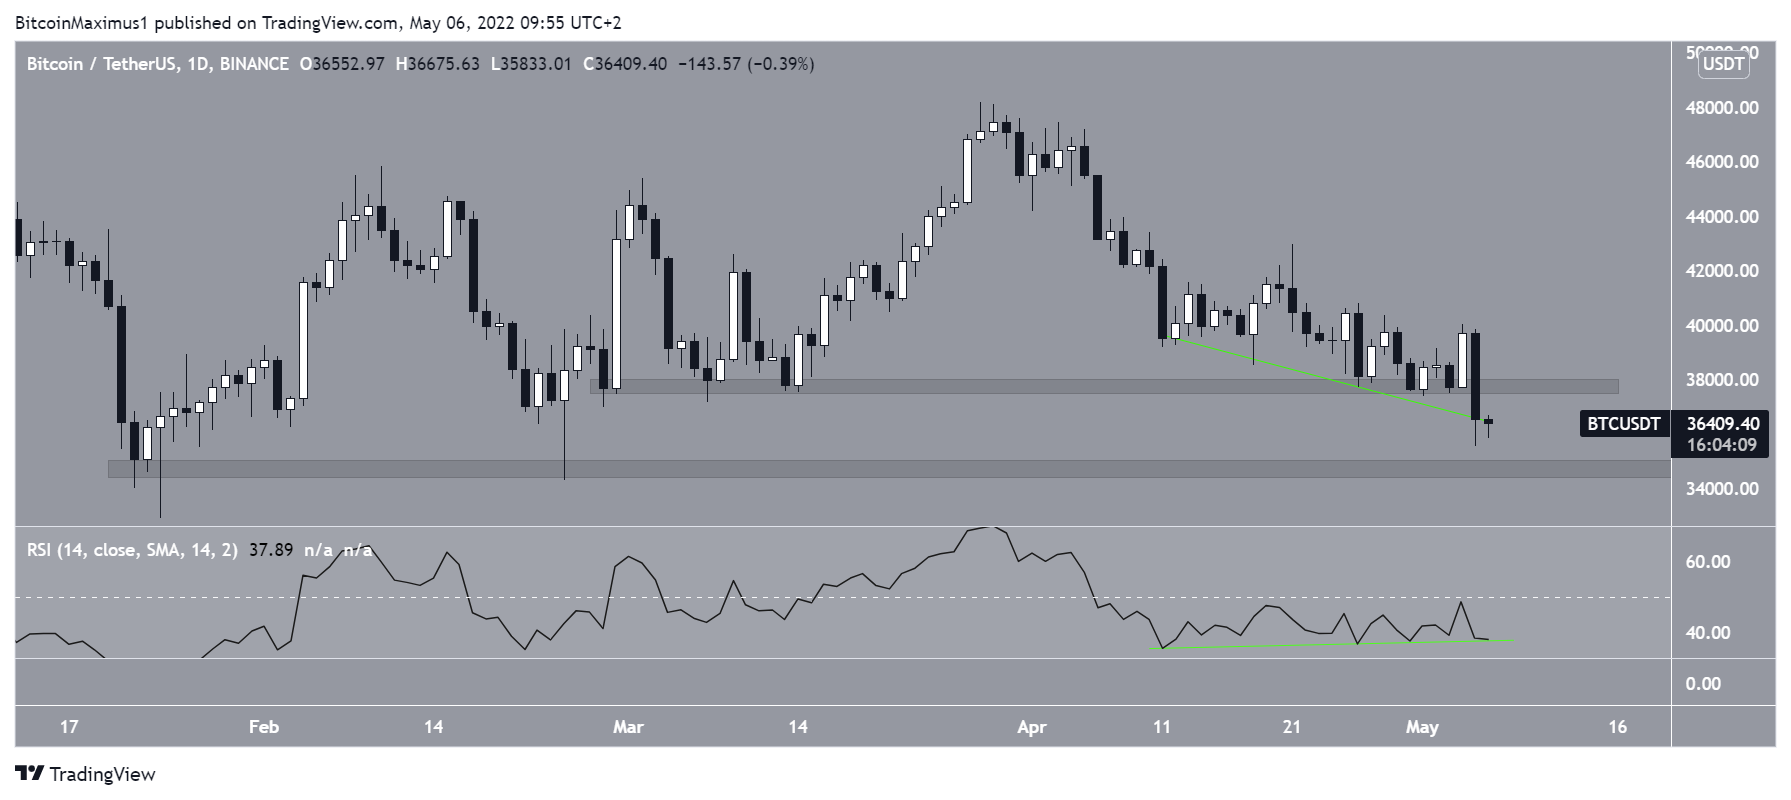
Despite the considerable drop, the bullish divergence trendline (green line) in the RSI is still intact, allowing for the possibility of a reclamation of the $37,800 area.
If this fails, the next closest support area is found at $34,800.
Future BTC movement
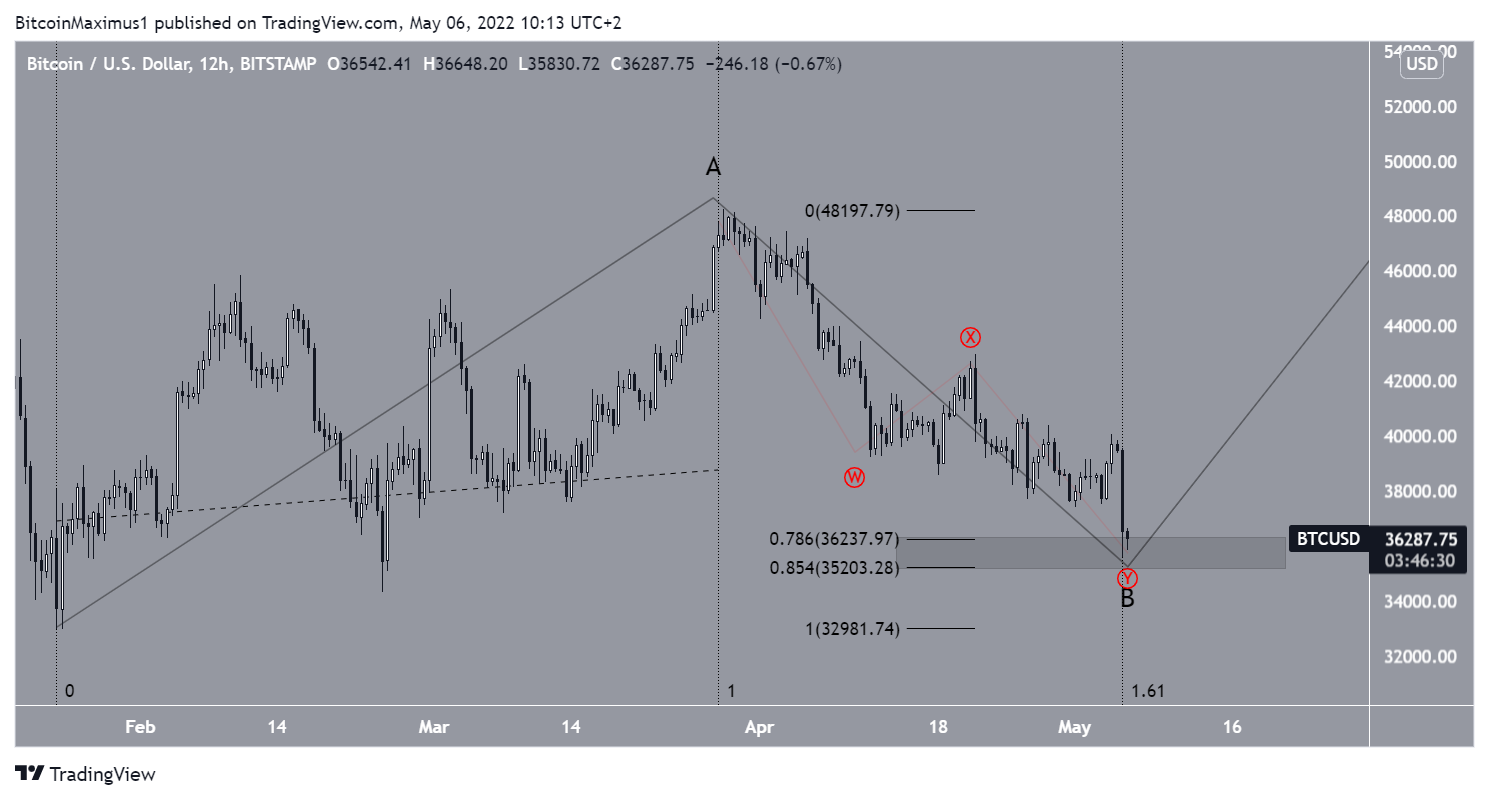
Despite the considerable decrease, it’s still possible that BTC is moving in a flat A-B-C corrective structure (black).
Currently, BTC is trading inside the 0.786-0.85 Fib retracement support level, which is a common Fib area to reach a bottom. The sub-wave count is shown in red in the chart below.
If a bottom is reached near this point, wave B would have taken 0.61 of the time of wave A to be created. This time length ratio is very common in such structures.
For BeInCrypto’s previous Bitcoin (BTC) analysis, click here



