


The bitcoin (BTC) price has been on an ongoing bounce since March 16.
Bitcoin is expected to reclaim the closest resistance area and eventually reach a new all-time high price.
Bitcoin Reclaims Key Level
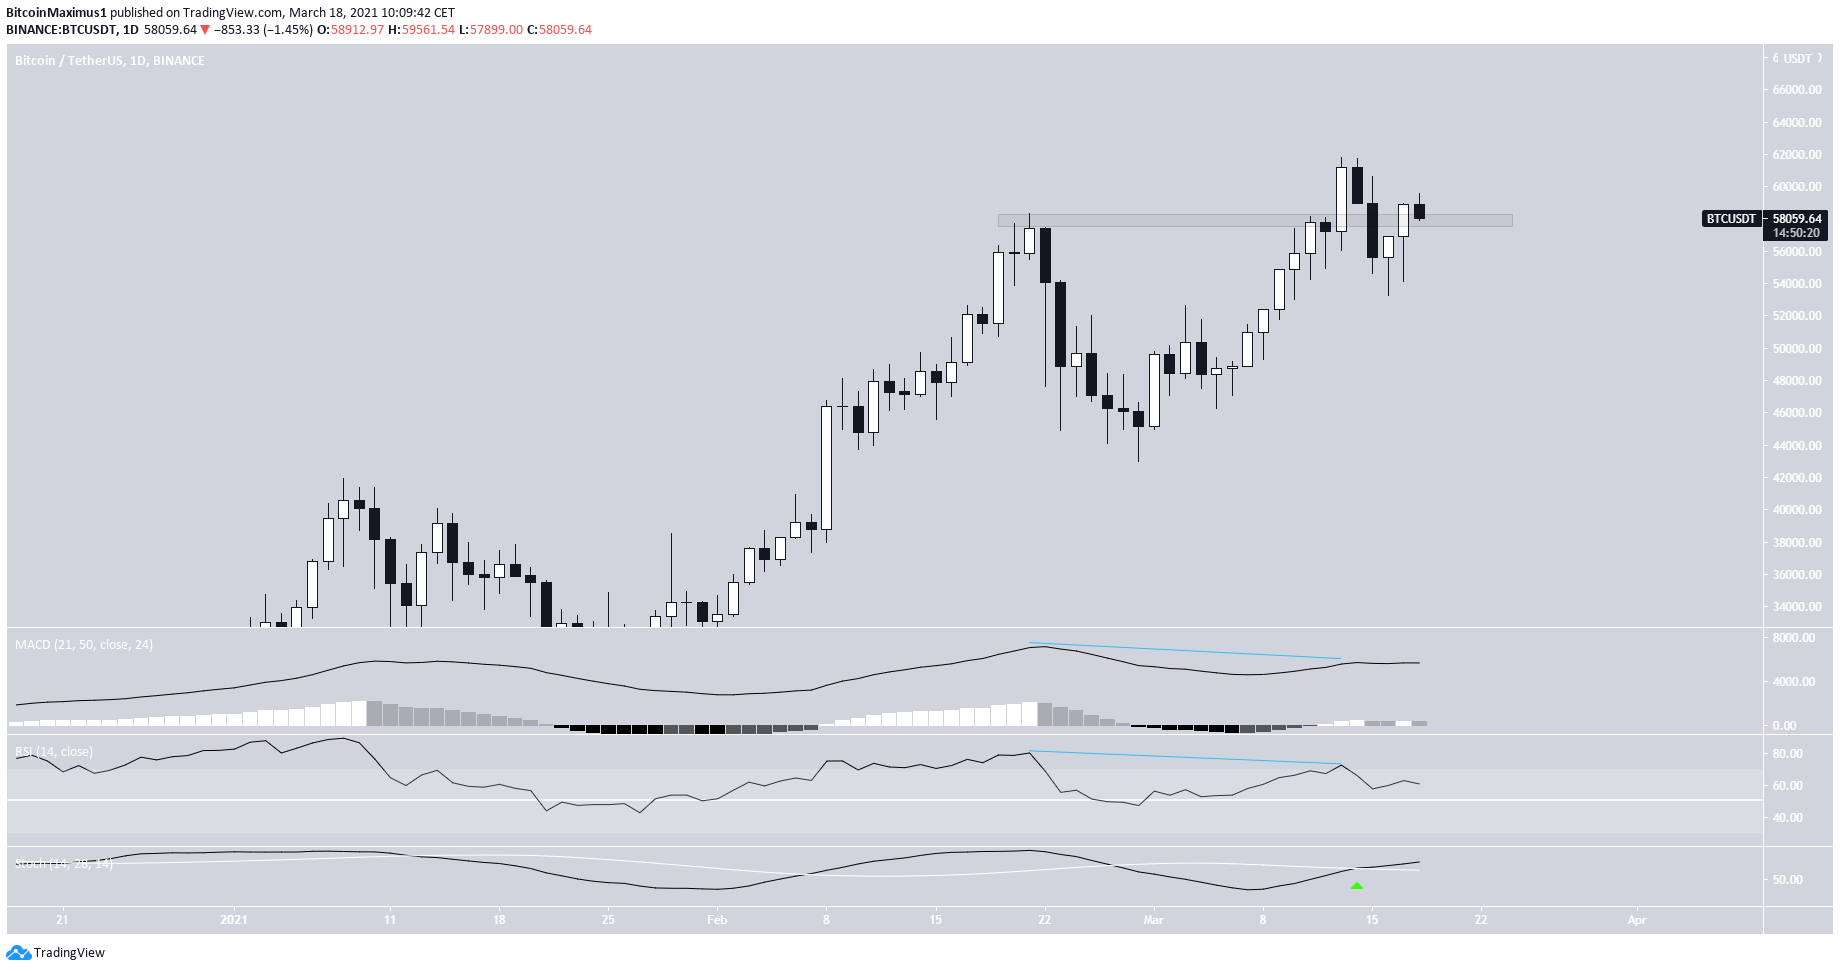
On March 13, BTC reached a high of $61,884 and began to decrease. The drop was preceded by bearish divergence in both the RSI and MACD.
The drop took it to a low of $53,271 a few days later.
However, the price has been increasing since. The upward movement is supported by a bullish cross in the Stochastic oscillator.
An important bullish development is that the price is in the process of reclaiming the $57,800 area.
The area previously acted as a resistance level. Reclaiming it is a bullish development that would likely precede a new all-time high price.
Short-Term Movement
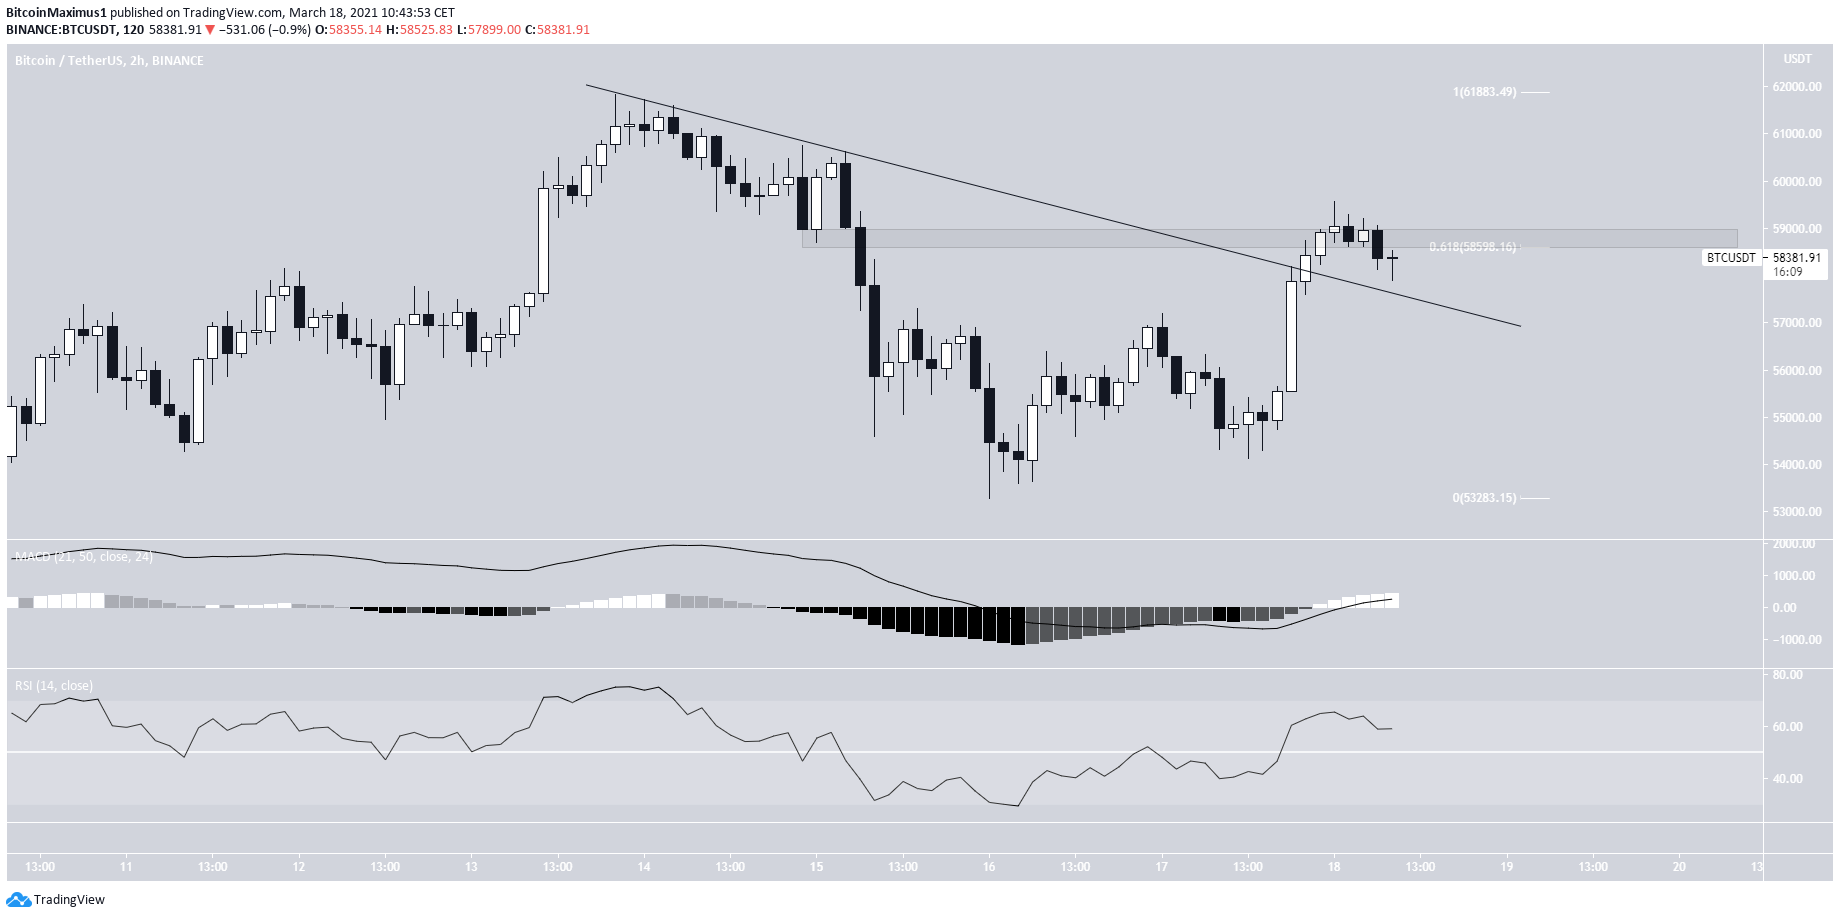
The two-hour chart shows that BTC has broken out from a short-term descending resistance line.
However, it was rejected by the 0.618 Fib retracement level at $58,600.
Nevertheless, the MACD and RSI support the continuation of the upward movement.
Therefore, it seems that the price is now retracing to retest the resistance line it broke out from.
Afterwards, it is expected to reclaim the $58,600 area. In turn, this would confirm that the trend is bullish, both in the long- and short-term.
Wave Count
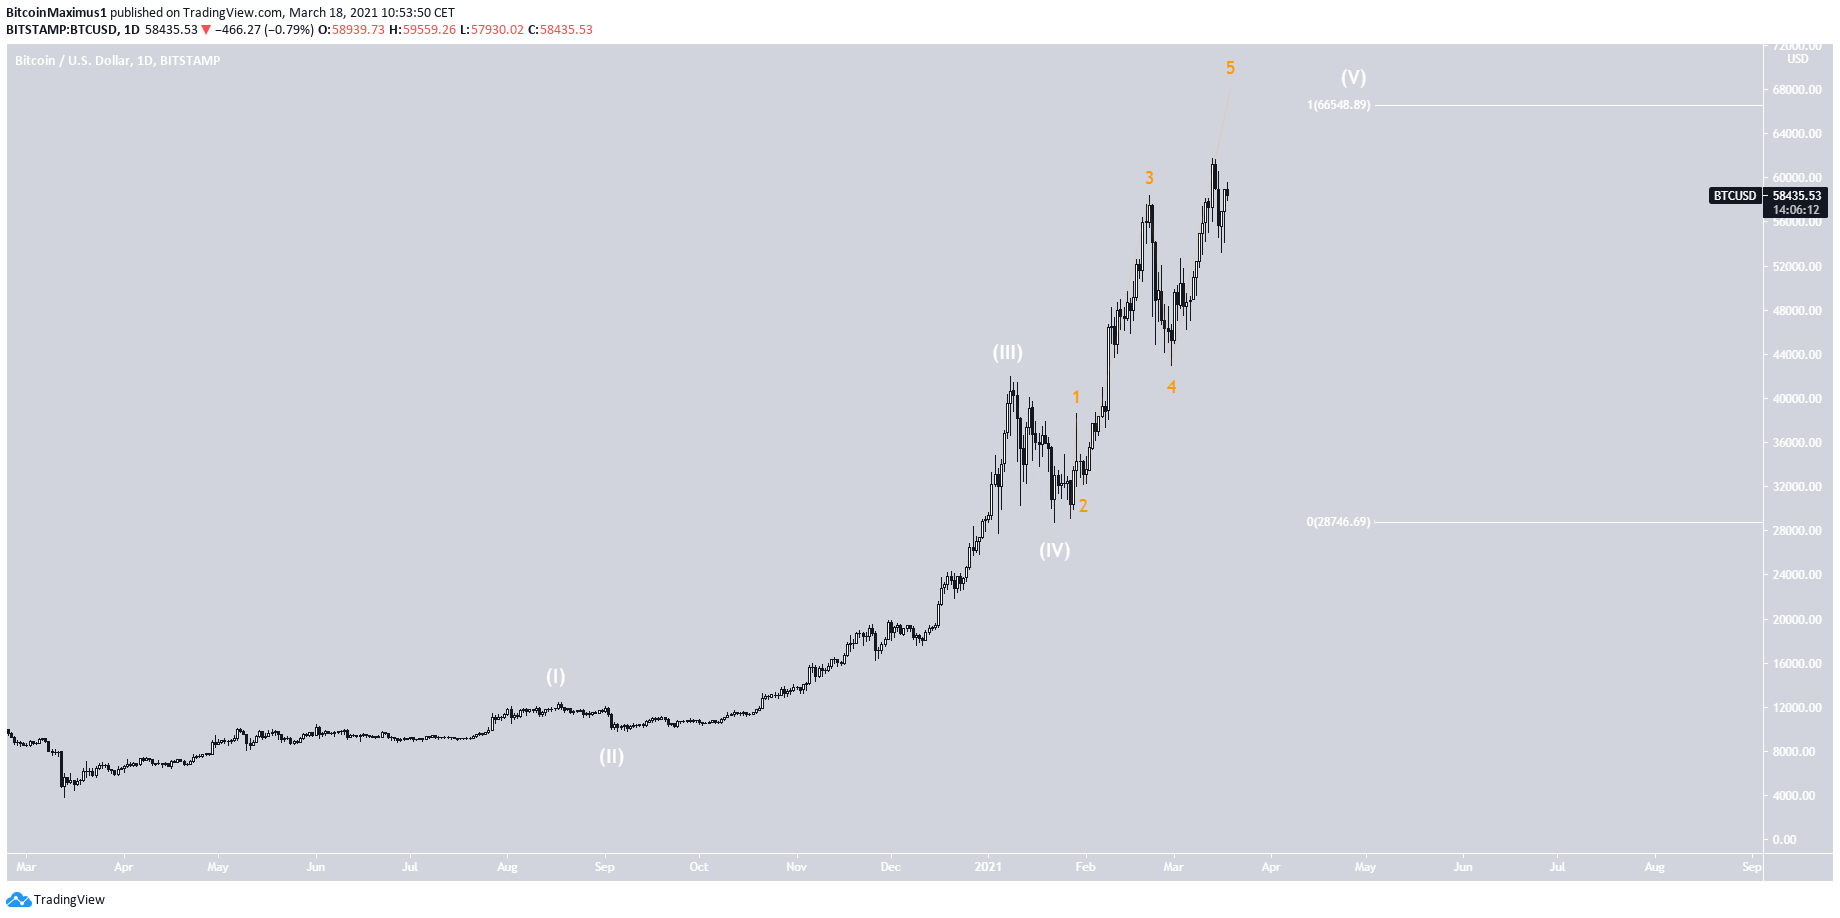
The wave count suggests that the current movement is part of sub-wave five (orange) of wave five (white). This is part of a bullish impulse that began in March 2020.
A potential target for the top of the movement is found at $66,550, using the lengths of waves 1-3.
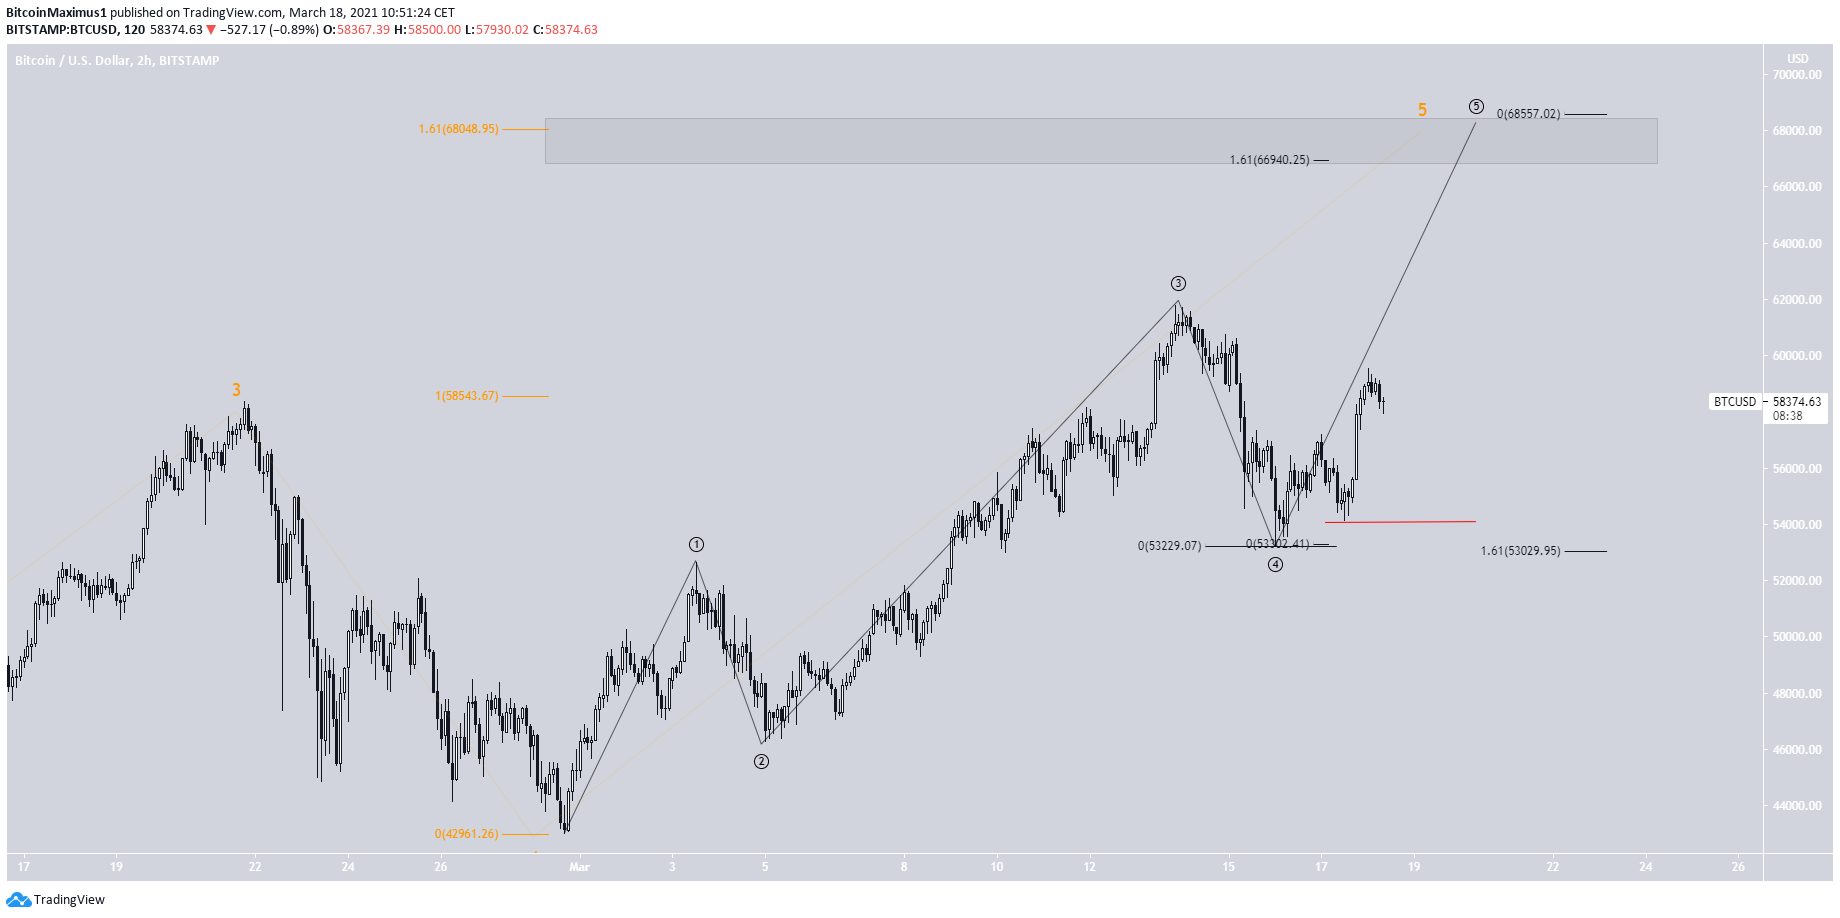
A closer look at the movement shows that the price is also in minor sub-wave five (black). Therefore, it’s likely to reach a top soon.
A confluence of Fib levels provides a target between $67,000-$68,500.
A decrease below the most recent lower high of $54,124 would likely indicate that the upward movement is done.
Conclusion
Bitcoin is expected to complete one more upward move and reach a new all-time high near $68,000. Afterwards, a correction is expected.
For BeInCrypto’s previous Bitcoin (BTC) analysis, click here.


