
The Bitcoin (BTC) price initiated a bounce last week, but failed to invalidate the previous bearish engulfing candlestick.
Nevertheless, Bitcoin is expected to either bounce upwards or consolidate this week. After that, it’s expected to confirm the direction of the longer-term trend.
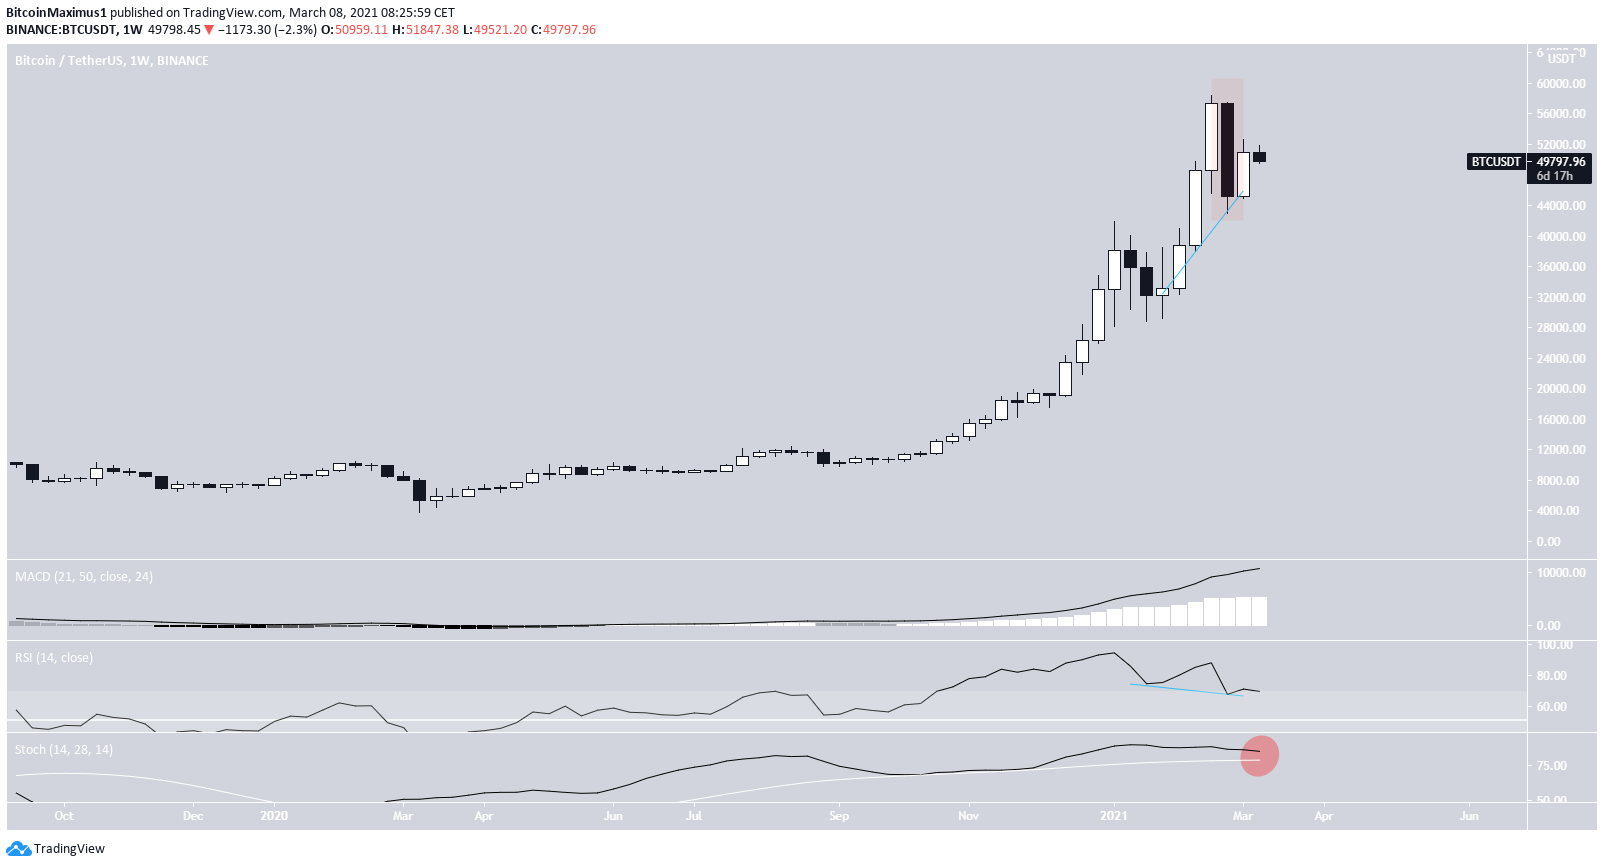
Weekly Bitcoin Close
Two weeks ago, Bitcoin decreased considerably and created a bearish engulfing candlestick.
BTC bounced last week, creating a small bullish candlestick. However, it failed to even reach the halfway point of the preceding bearish engulfing candlestick.
Nevertheless, the MACD is increasing and the RSI has clearly generated some hidden bullish divergence. This is a common sign of trend continuation.
On the bearish side, the Stochastic oscillator is showing a decrease in momentum. However, it has yet to make a bearish cross.
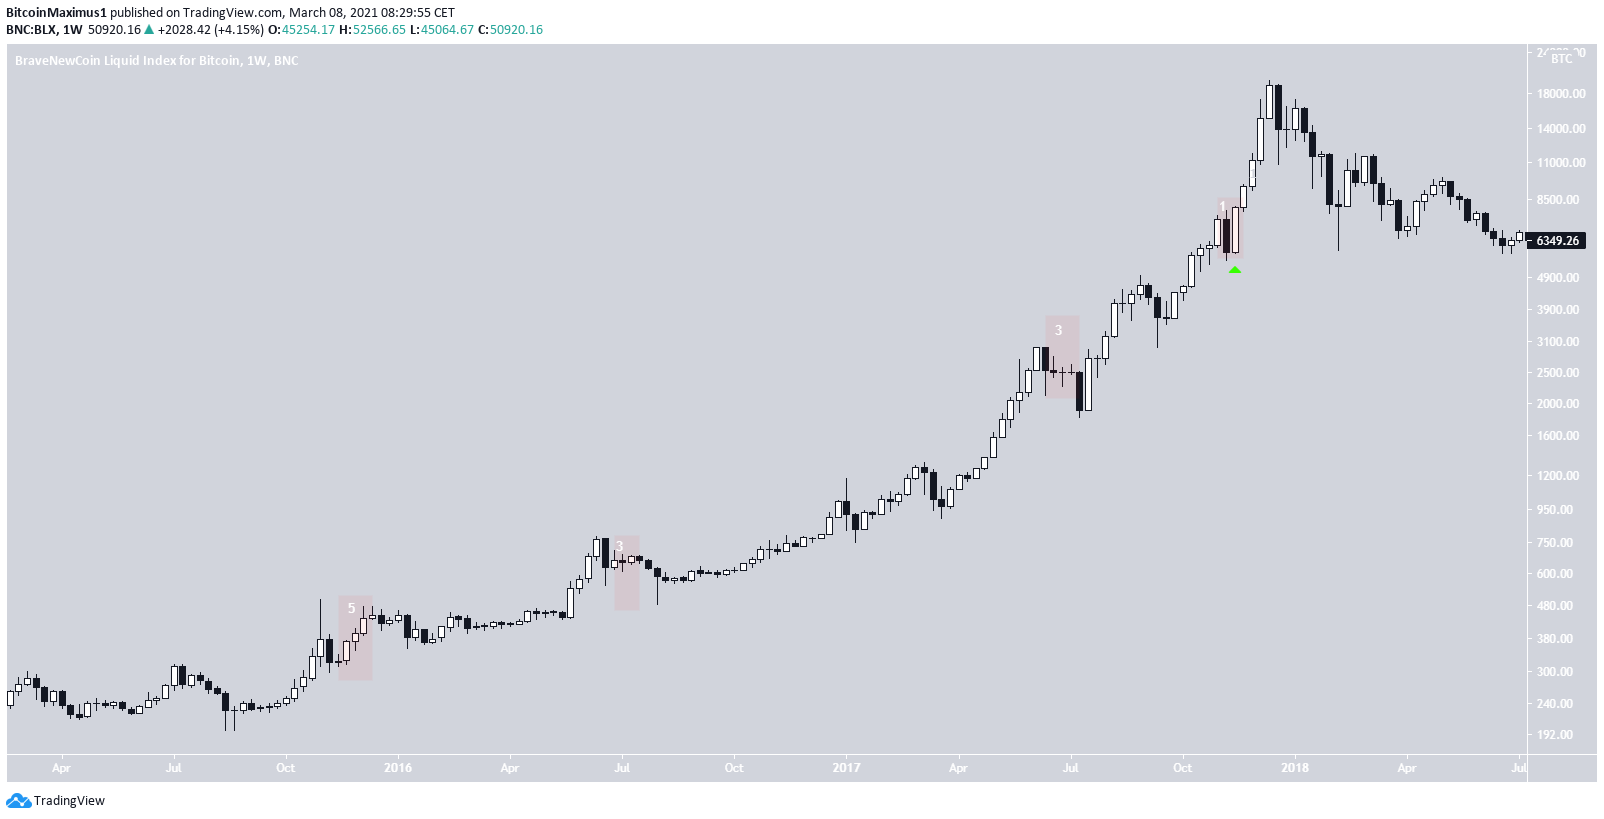
When looking at the bearish candlesticks from the 2017 bull run we can see that no considerable decrease followed in week three.
After the first bearish engulfing candlestick, BTC bounced upwards for five weeks before decreasing again. It also saw relief for three weeks after the second and third bearish engulfing candlesticks. Finally, it bounced immediately following the fourth bearish candle.
Therefore, based on its history, even if the BTC low is not yet in, it’s likely that BTC will see some relief or consolidation this week.
The hidden bullish divergence supports this possibility along with the potential continuation of the upward movement.
Bitcoin Fails to Break Out
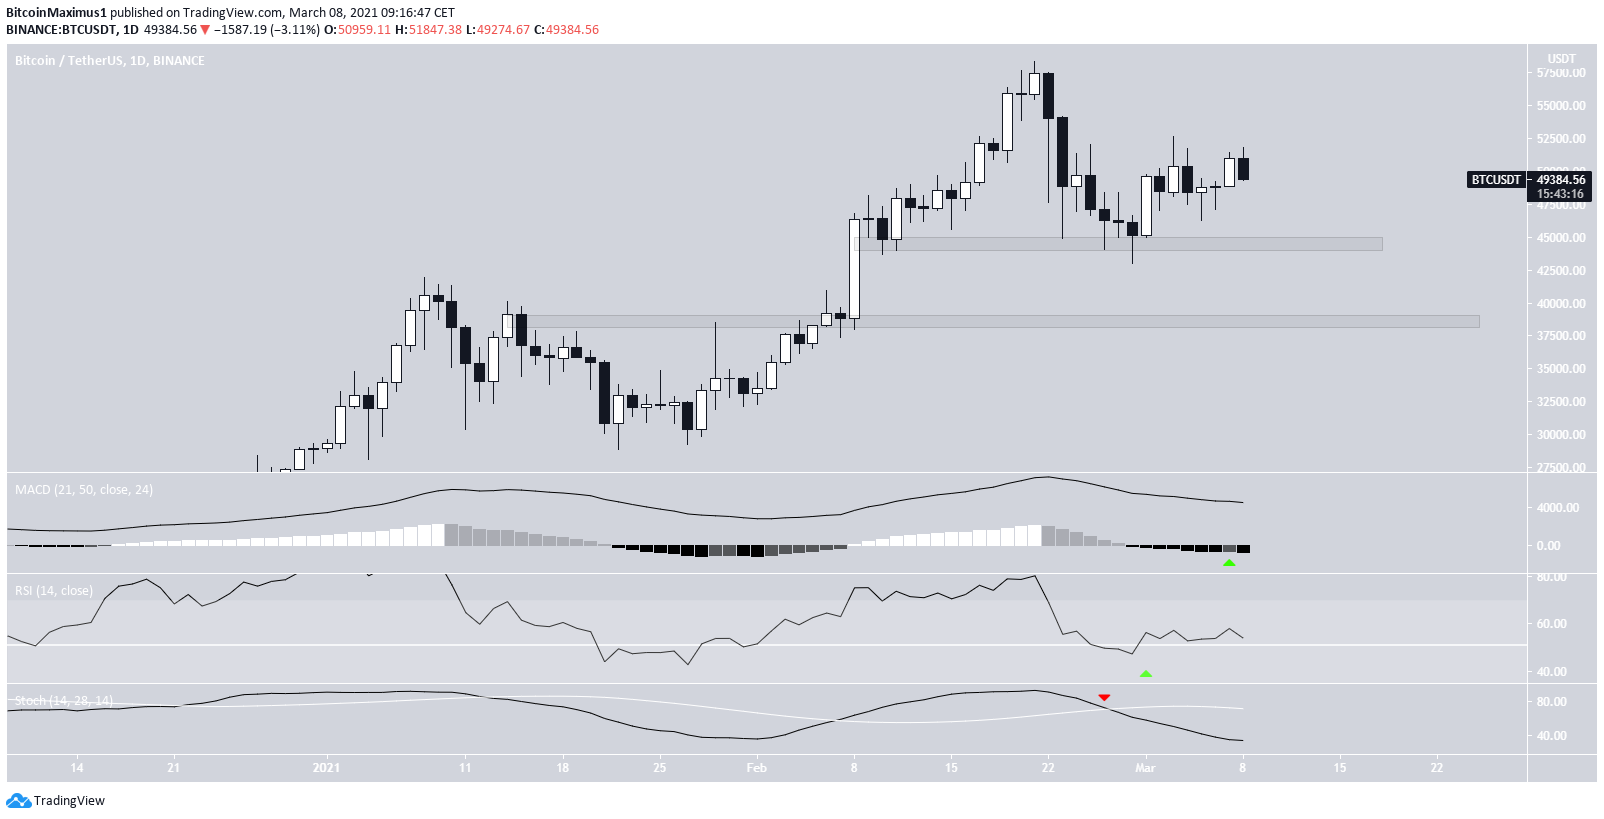
The daily chart shows that BTC is trading above the $44,500 support area. It began the ongoing upward movement with a bounce from this area on Feb. 28, 2021.
Technical indicators are more bullish than bearish.
The MACD has finally generated a higher momentum bar after 13 successive lower bars. This is a sign that momentum is turning bullish.
The RSI has moved back above 50. And even though the Stochastic oscillator has made a bearish cross, it’s gradually turning upwards.
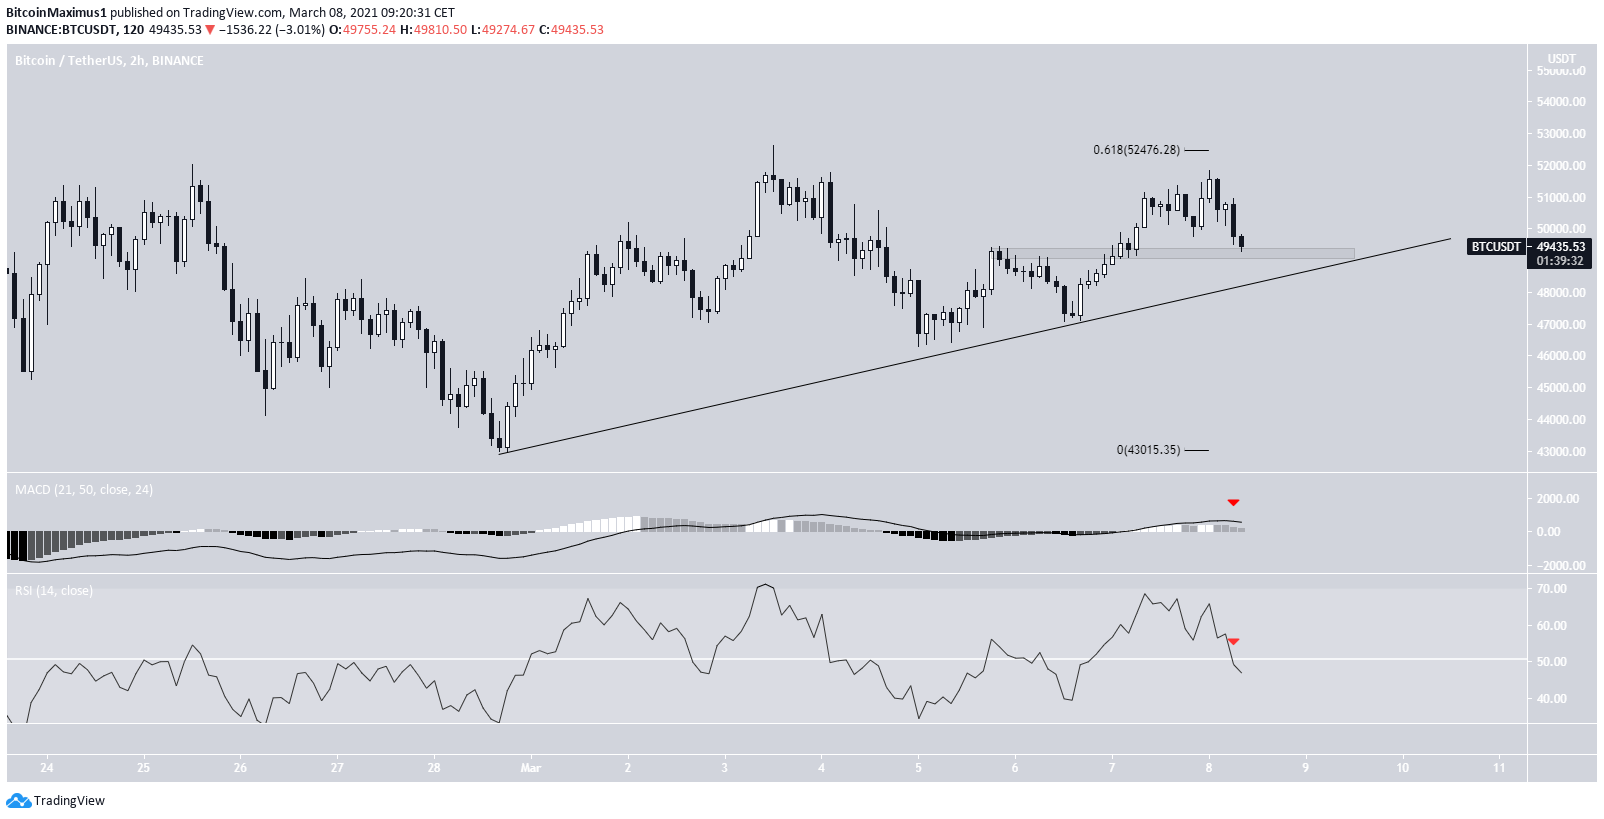
The two-hour chart shows that BTC was rejected by the 0.618 Fib retracement level at $52,475.
However, it’s following an ascending support line that coincides with the minor $49,200 support area.
As long as Bitcoin is trading above this level, it’s expected to continue moving upwards. If so, will likely make another attempt at breaking out above the 0.618 Fib resistance.
Conclusion
While the direction of the long-term trend is not certain, a bounce or consolidation is expected this week.
The short-term trend is bullish as long as BTC is trading above the minor $49,200 support area and ascending support line.
The medium-term trend is bullish as long as BTC stays above $45,500.
For BeInCrypto’s previous Bitcoin (BTC) analysis, click here.
