


During the week of Jan. 18-25, the Bitcoin (BTC) price resumed the decrease that began with an all-time high price of $42,000 on Jan. 8.
While the longer-term trend is likely still bullish, Bitcoin is trading just below a short/medium-term resistance. A breakout above these levels would be required for BTC to move higher.
Bitcoin Bounces after Decrease
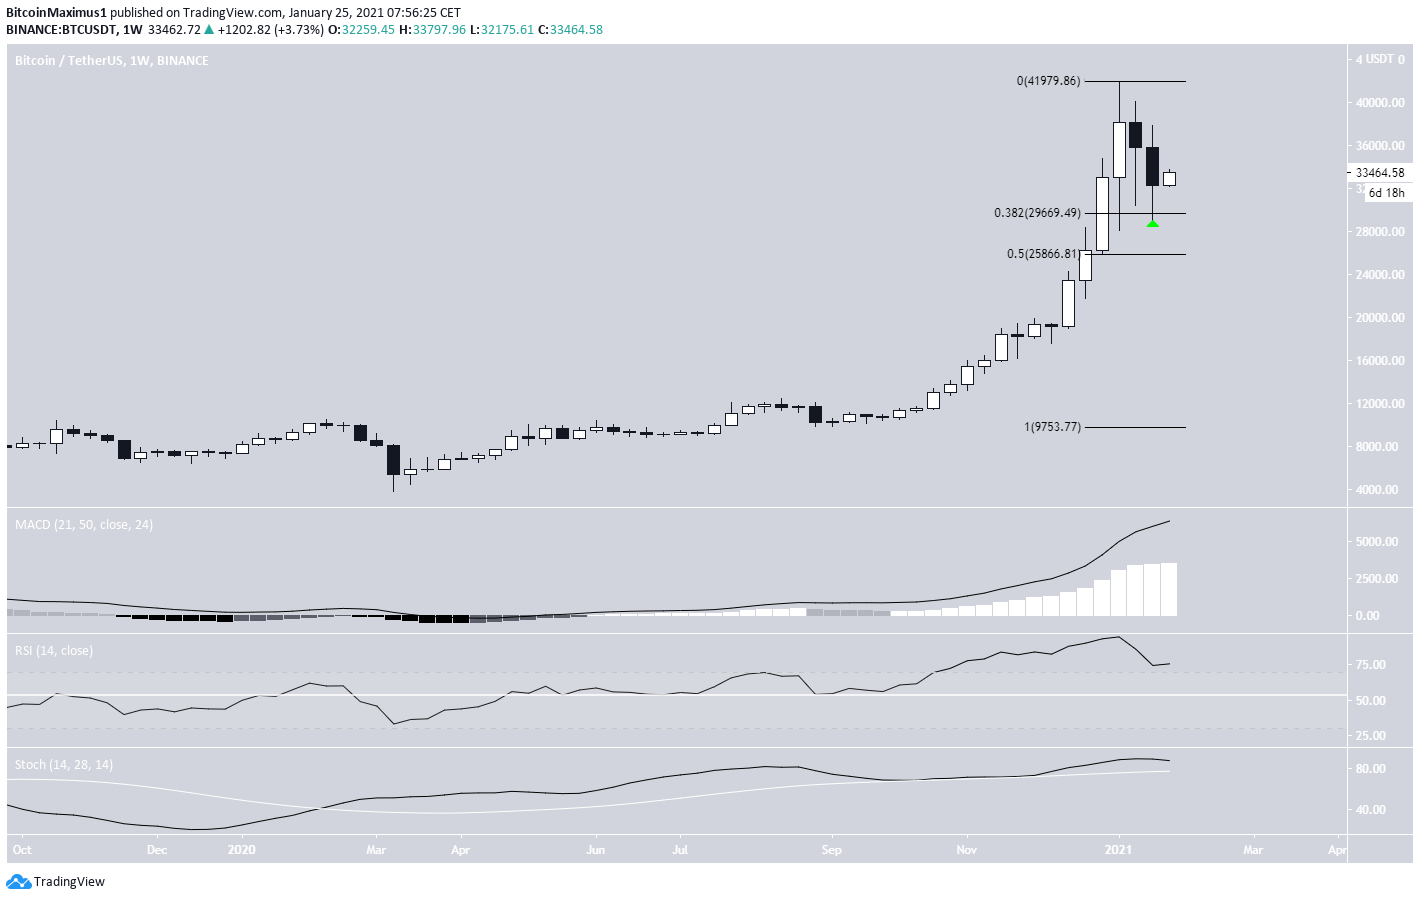
Bitcoin decreased considerably during the week of Jan. 18-Jan. 25, dropping back to a low of $28,850. This created the second successive weekly candlestick with a bearish close.
Nevertheless, BTC managed to bounce above the 0.382 Fib retracement support at $29,670 and is currently trading at $33,350.
Technical indicators in the weekly time-frame are still bullish.
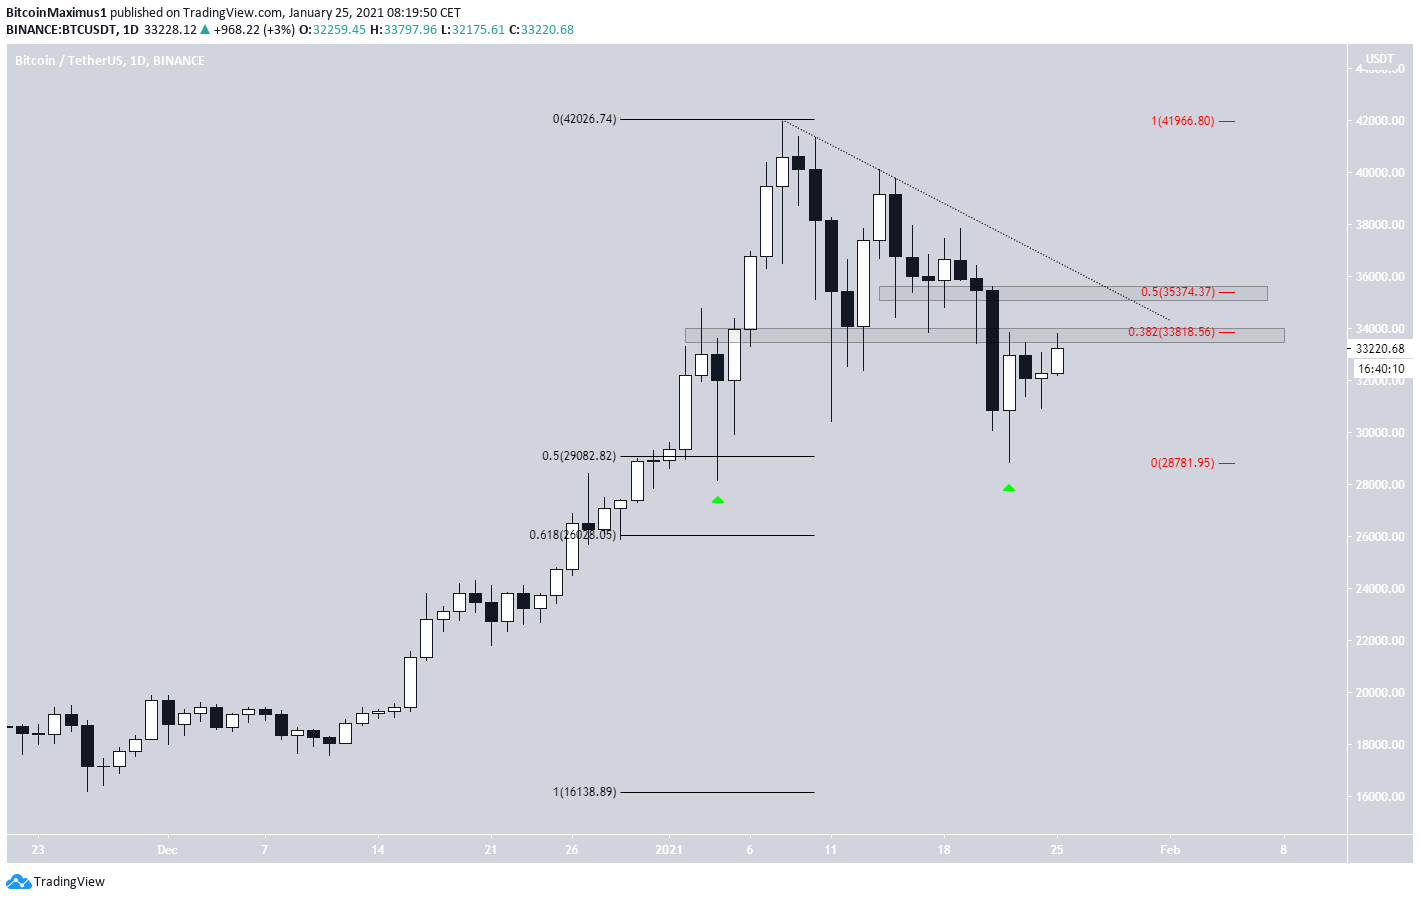
The daily chart shows that the $29,000 support area is also the 0.5 Fib retracement level of the most recent portion of the same upward move, further increasing its significance. BTC has twice bounced at this level, creating long lower wicks each time.
Despite the bounce, BTC is not nearly close to confirming a bullish trend reversal.
It’s still trading below $33,800, the 0.382 Fib retracement level (shown in red below) of the most recent downward movement and a strong horizontal resistance area. Even if BTC were to reclaim this level, it would likely face strong resistance at $35,375 — the 0.5 Fib retracement of the same upward move and a potential descending resistance line.
Therefore, until BTC manages to clear it, we cannot consider the trend bullish. If BTC were to decrease below the $29,000 support, the next would be found at $26,000 (0.618 Fib retracement).
Technical Indicators Confirm Resistance
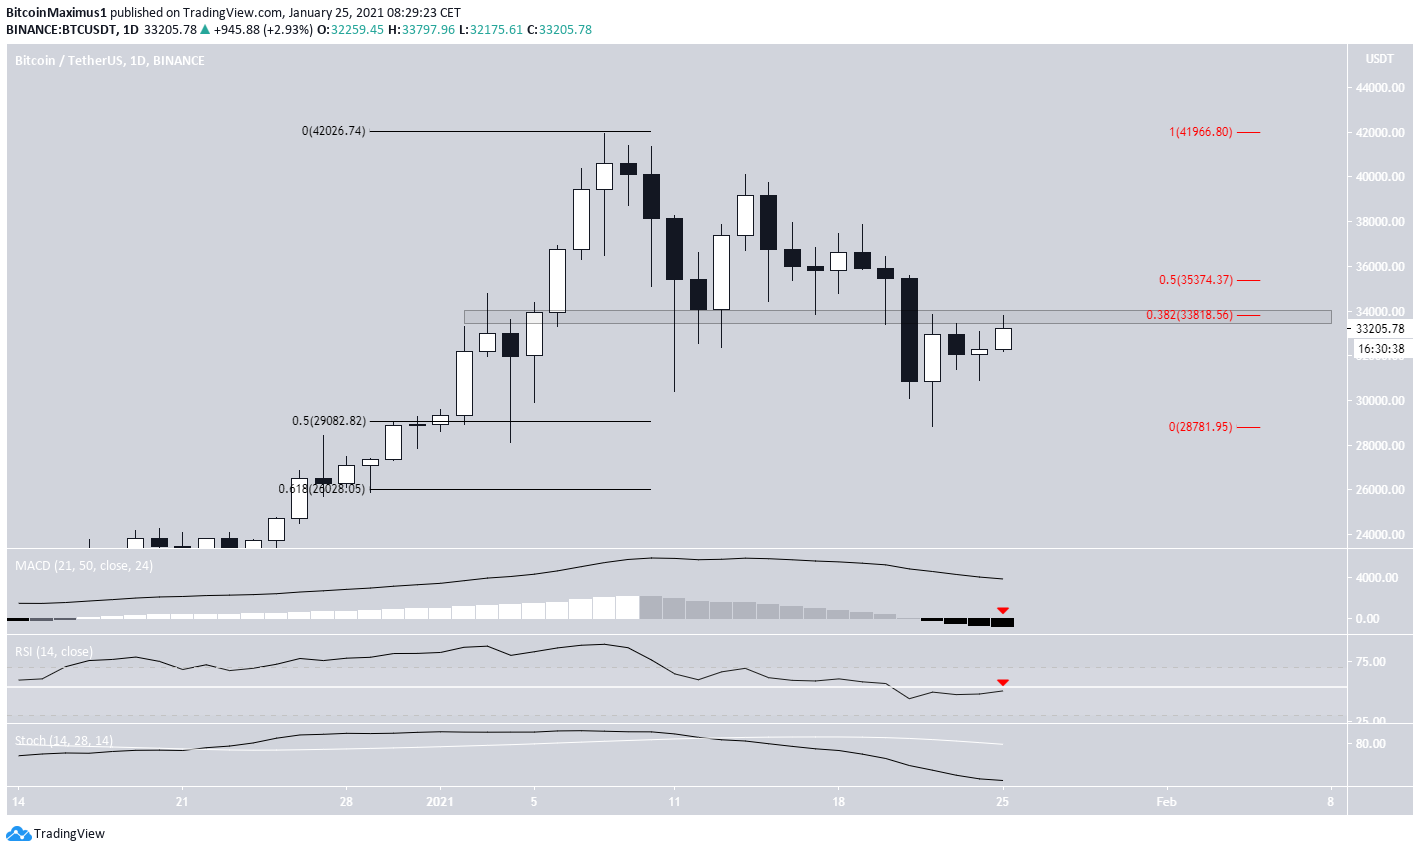
Technical indicators in the daily time-frame are firmly bearish.
The MACD has crossed into negative territory, the RSI is below 50, and the Stochastic oscillator has made a bearish cross.
This further solidifies the hypothesis that the trend cannot be considered bullish until BTC reclaims the $33,800 area and possibly breaks out from the descending resistance line.
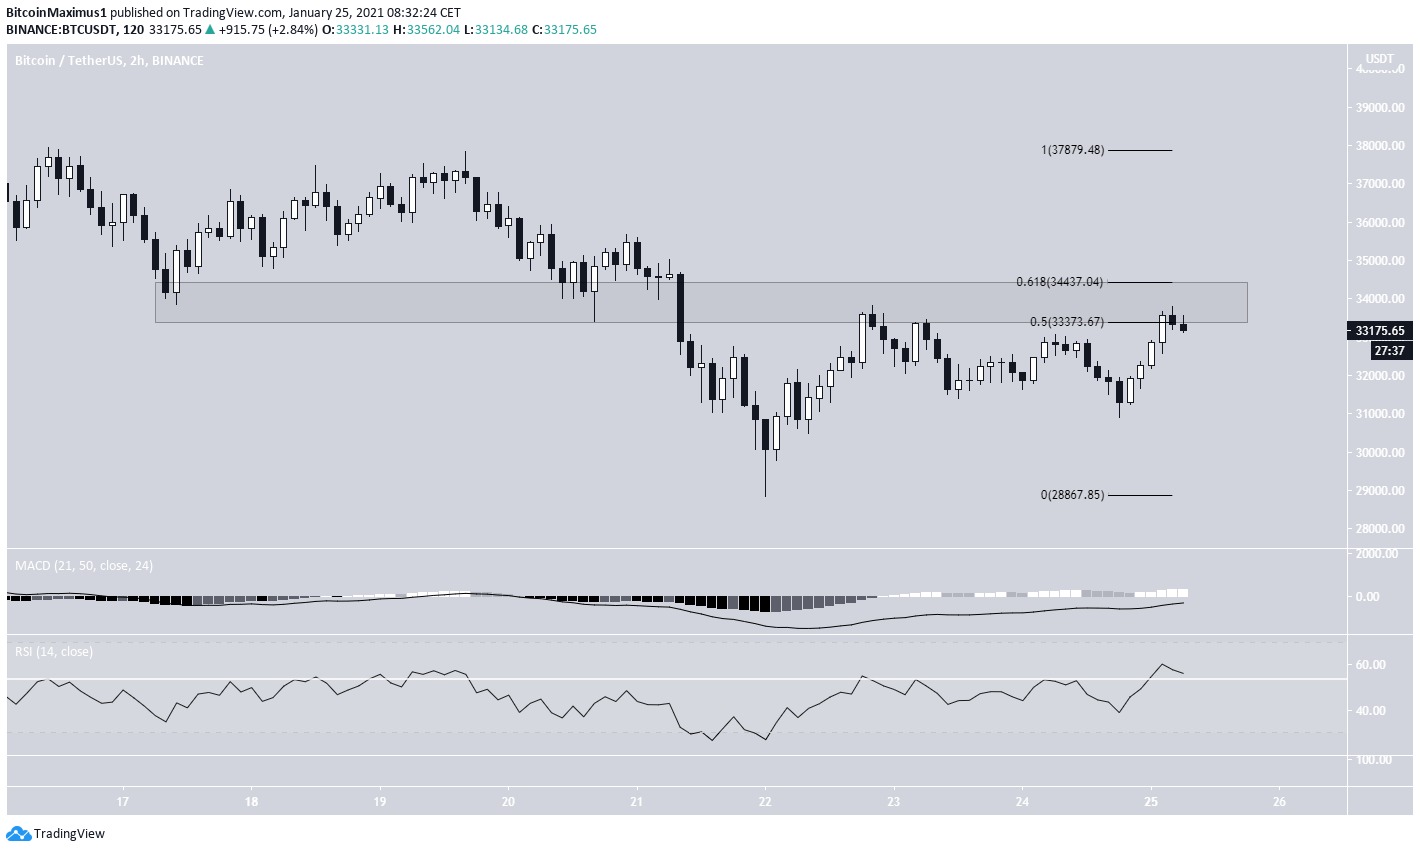
Similarly, the two-hour time-frame gives neutral technical indicators but very strong resistance near the current price.
Therefore, until BTC manages to reclaim the area, we cannot consider the trend bullish.
BTC Conclusion
While Bitcoin seems to still be in a long-term upward trend and has shown bullish reversal signs, the short/medium-term trend cannot yet be considered bullish until BTC manages to clear the resistance areas at $33,800 and $35,400.
For BeInCrypto’s previous Bitcoin (BTC) analysis, click here!


