


The Bitcoin (BTC) price has decreased considerably since April 14 but began showing recovery from support levels on April 26.
Despite the ongoing bounce, there are no clear bullish reversal signs for bitcoin. Therefore, it’s possible that another low will be reached prior to a reversal.
Weekly bitcoin price movement
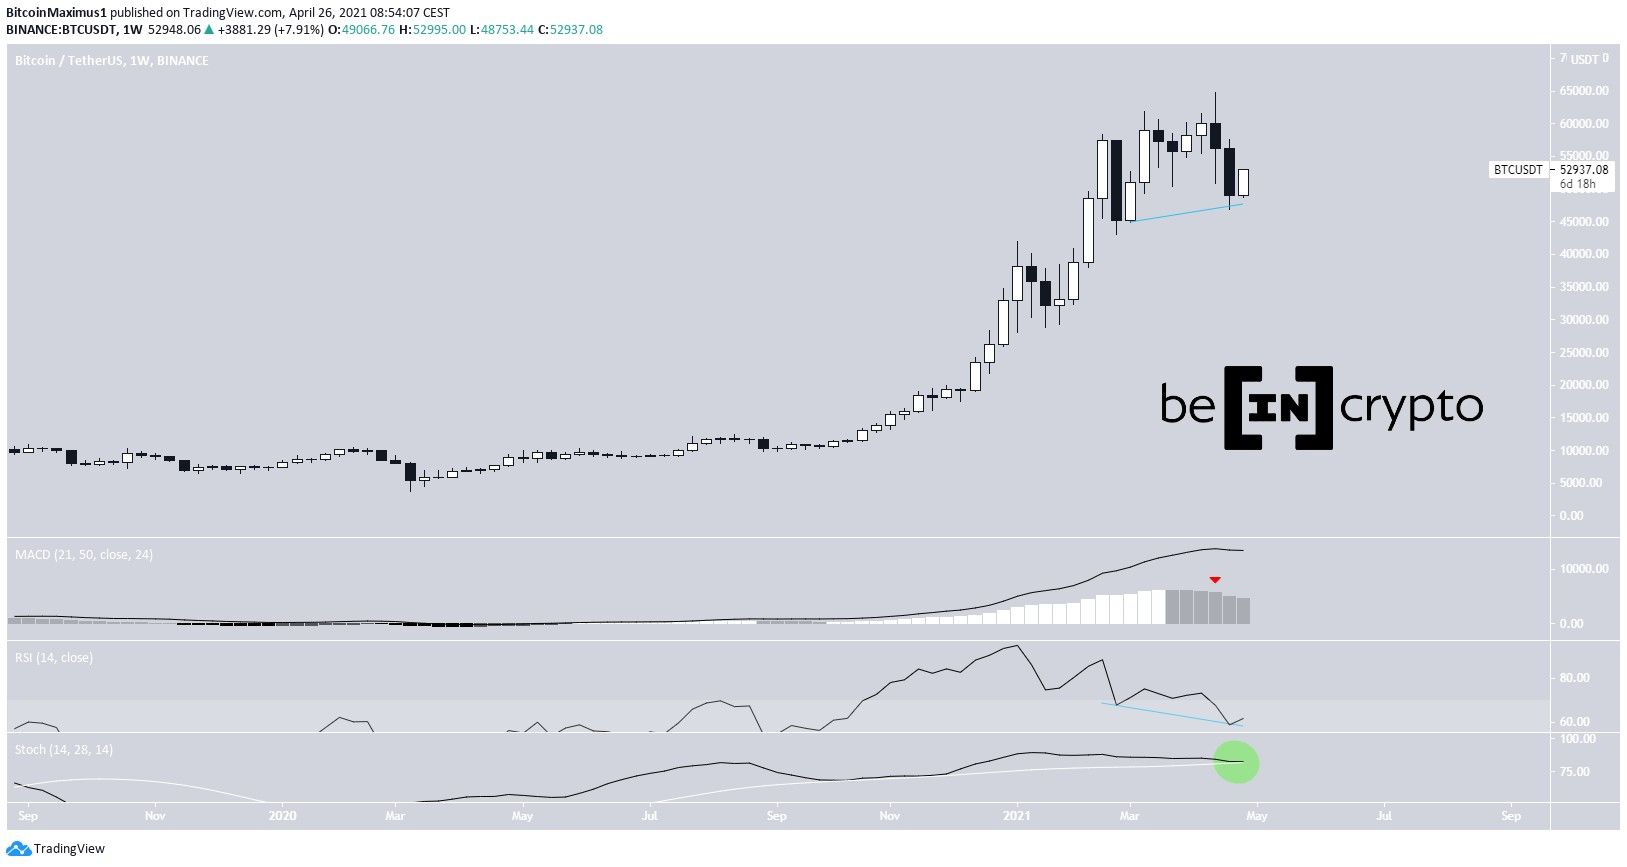
Last week, BTC completed its second successive bearish candlestick. This led to a low of $46,930 being reached on April 25. The price has recovered slightly since then.
Technical indicators are mixed. The MACD is decreasing and has given a bearish reversal signal. However, the RSI has generated a hidden bullish divergence — a strong sign of trend continuation.
The Stochastic oscillator is neutral. It’s been decreasing but has not made a bearish cross yet.
Therefore, we need to take a look at lower time-frames in order to analyze the direction of the trend.
Daily BTC Movement
The daily chart provides a more bearish picture.
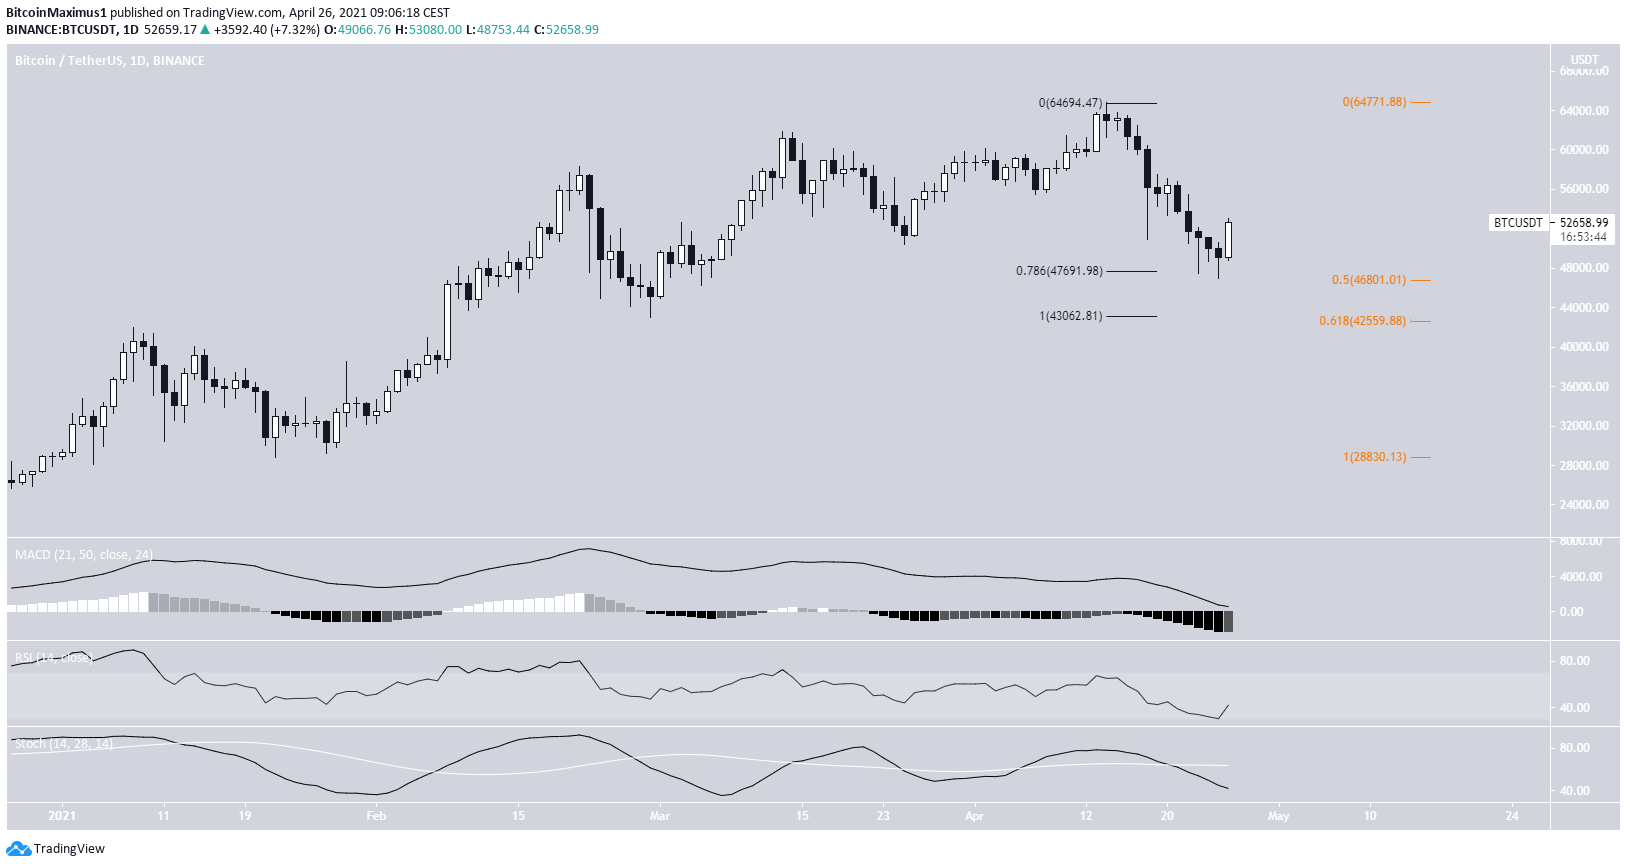
The MACD, RSI, and Stochastic oscillator are all decreasing. None of these primary signals are showing any bullish signs.
However, BTC has bounced at a confluence of Fib support levels. The $46,800-$47,690 area is the 0.786 Fib retracement level (black) of the most recent portion of the increase. In addition, it’s also the 0.5 Fib retracement level (orange) of the longer-term portion of the move.
If BTC continues to fall, the next significant support is found between $42,550-$43,050.
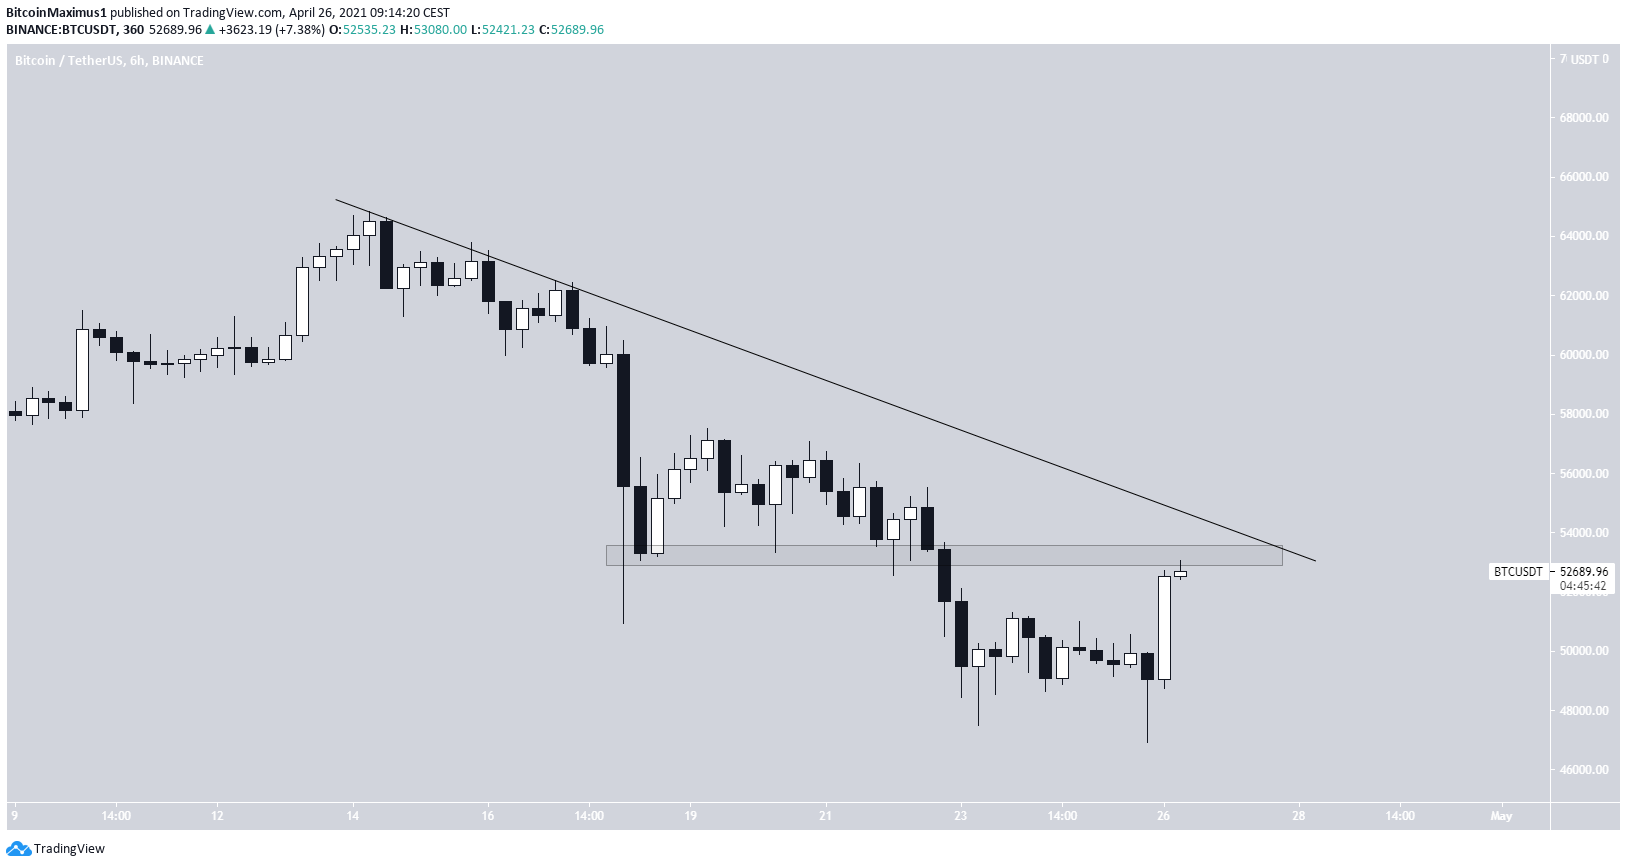
The six-hour chart shows a descending resistance line that BTC has been following since the all-time high price on April 13. So far, it has made three unsuccessful breakout attempts.
The line coincides with the $53,200 minor resistance area.
Until it is reclaimed, we cannot consider the trend bullish.
Correction or bounce?
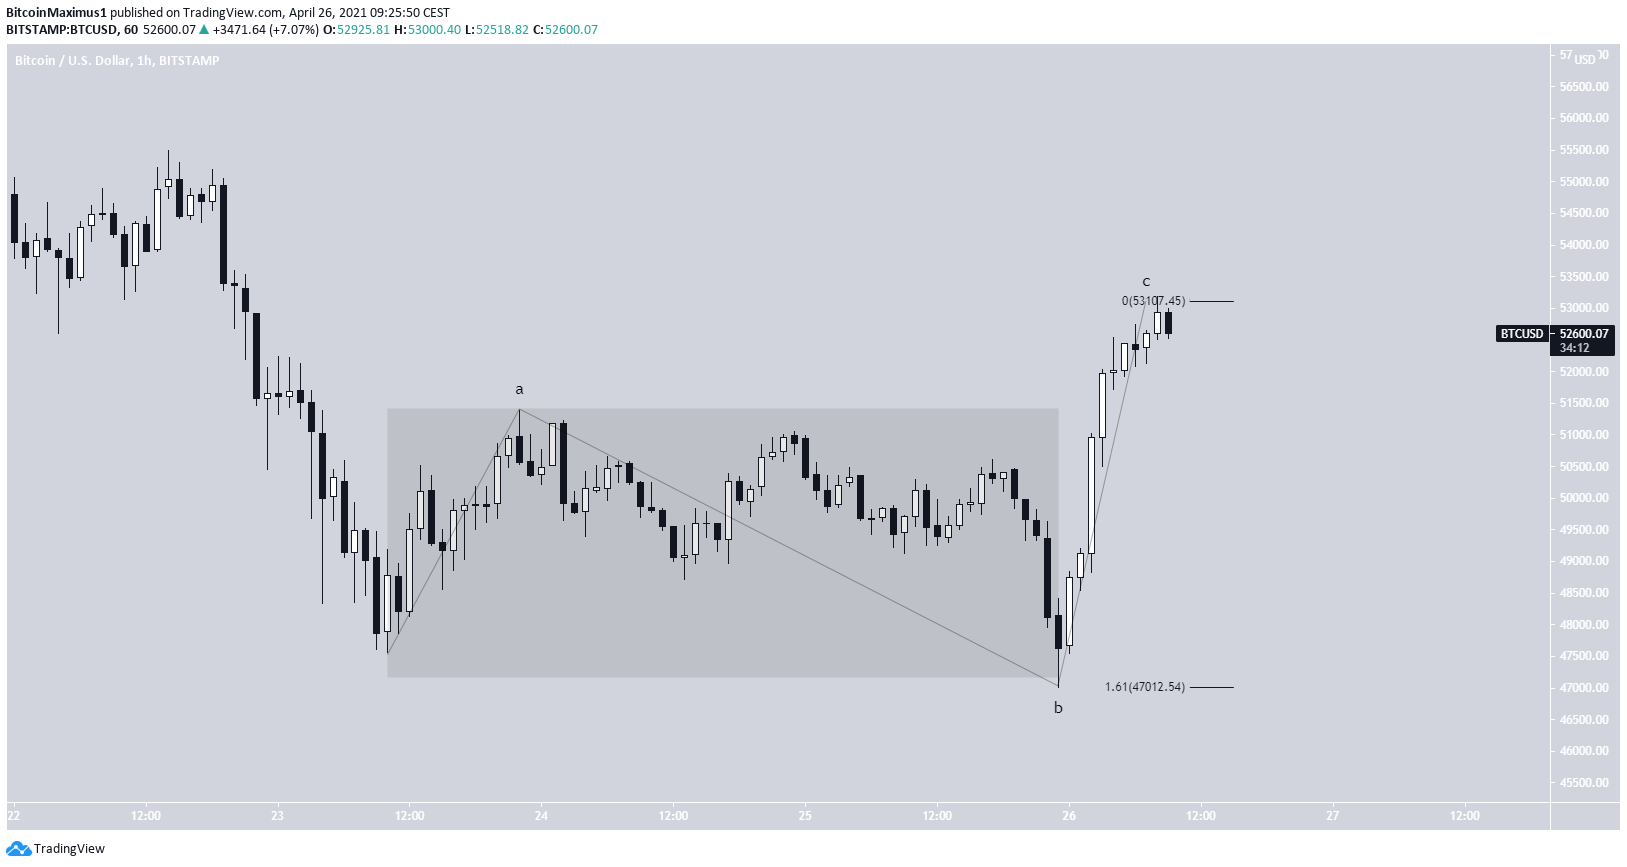
The one-hour chart shows a double bottom that was created on April 25.
The decrease that led to the range low does not look impulsive. Rather, it’s more likely that it was a flat, A-B-C corrective structure. In addition, waves A:C have a 1:1.61 ratio — common in such structures.
If true, BTC would be expected to create another low before eventually moving upwards.
Conclusion
Due to the lack of bullish reversal signs, it’s more likely that BTC will complete another low before breaking out from the short-term resistance.
For BeInCrypto’s previous bitcoin (BTC) analysis, click here.



