
Bitcoin (BTC) bounced to the upside on May 20, temporarily halting the historic correction of the previous day.
Despite the recovery, it has yet to clear a crucial horizontal resistance level or break out from a descending resistance line. Therefore, it has not yet confirmed a bullish reversal.
BTC bounces above support
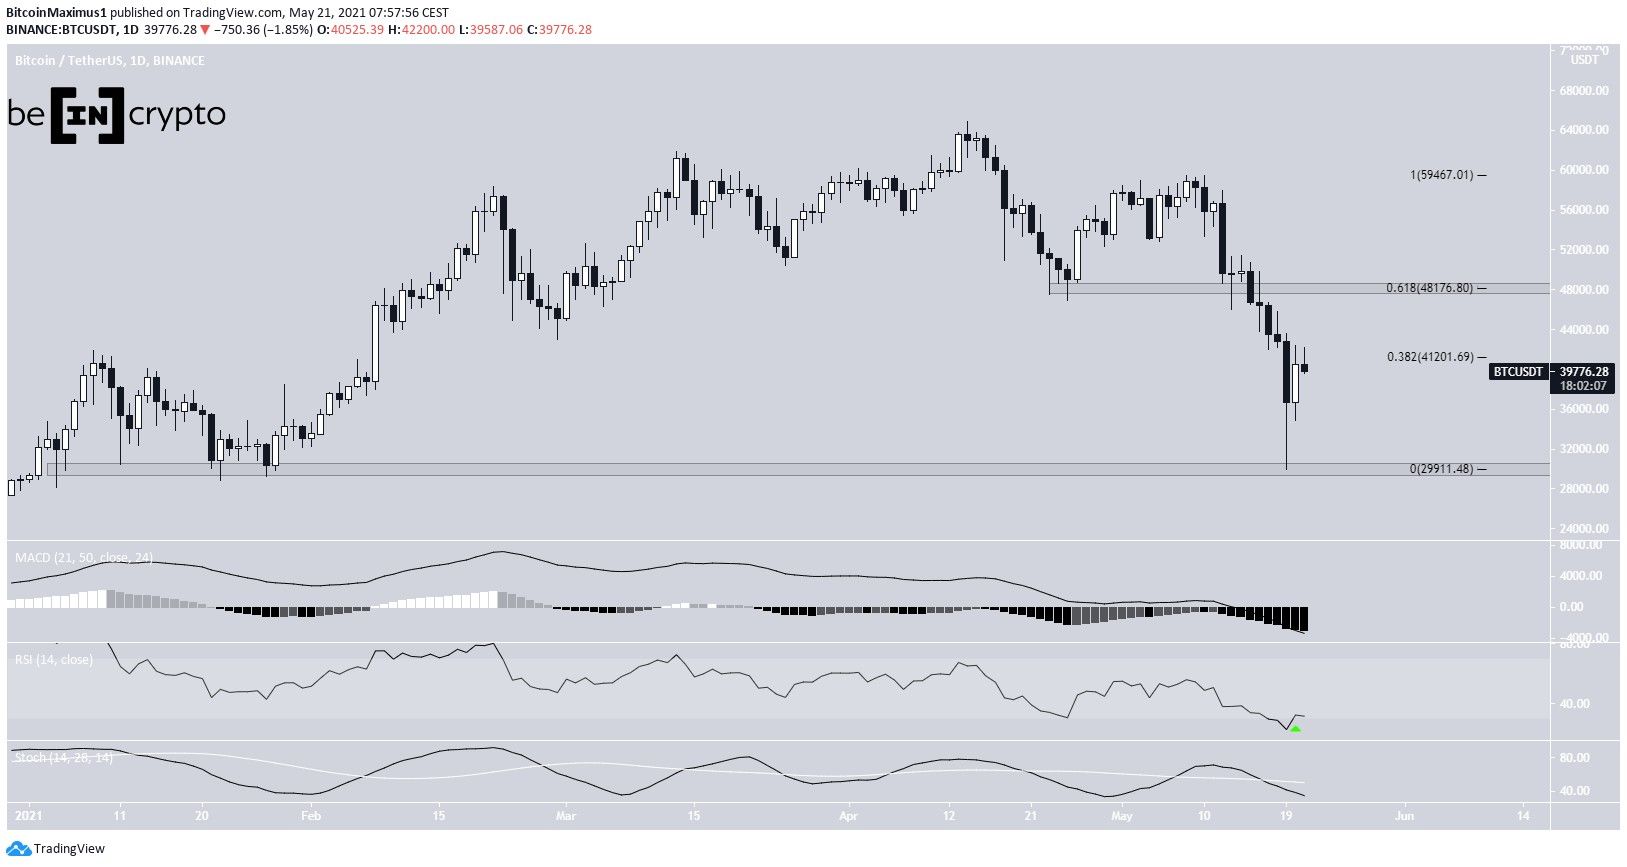
BTC increased on May 20 after finding support the previous day. However, it was rejected by the 0.382 Fib retracement resistance at $41,200. This is only a minor resistance level. The most critical resistance for BTC to overcome is $48,170.
Despite the rejection, technical indicators have created the first bullish sign in the daily time frame. The RSI has moved above the 30-line, crawling out from oversold territory. However, both the MACD and Stochastic oscillator are still bearish.
The primary support area is found at $30,000, a level which was reached on May 19.
Future BTC movement
The six-hour chart shows several more bullish signs.
Firstly, the candlestick patterns are bullish. There is a bullish engulfing candlestick (highlighted) that followed a bullish hammer (green icon). Furthermore, the MACD has given a bullish reversal sign.
However, BTC has yet to break out above the descending resistance line that’s been in place since May 11. The line also coincides with the previously outlined $41,200 resistance area.
Until it reclaims these levels, the short-term trend cannot be considered bullish.

Wave count
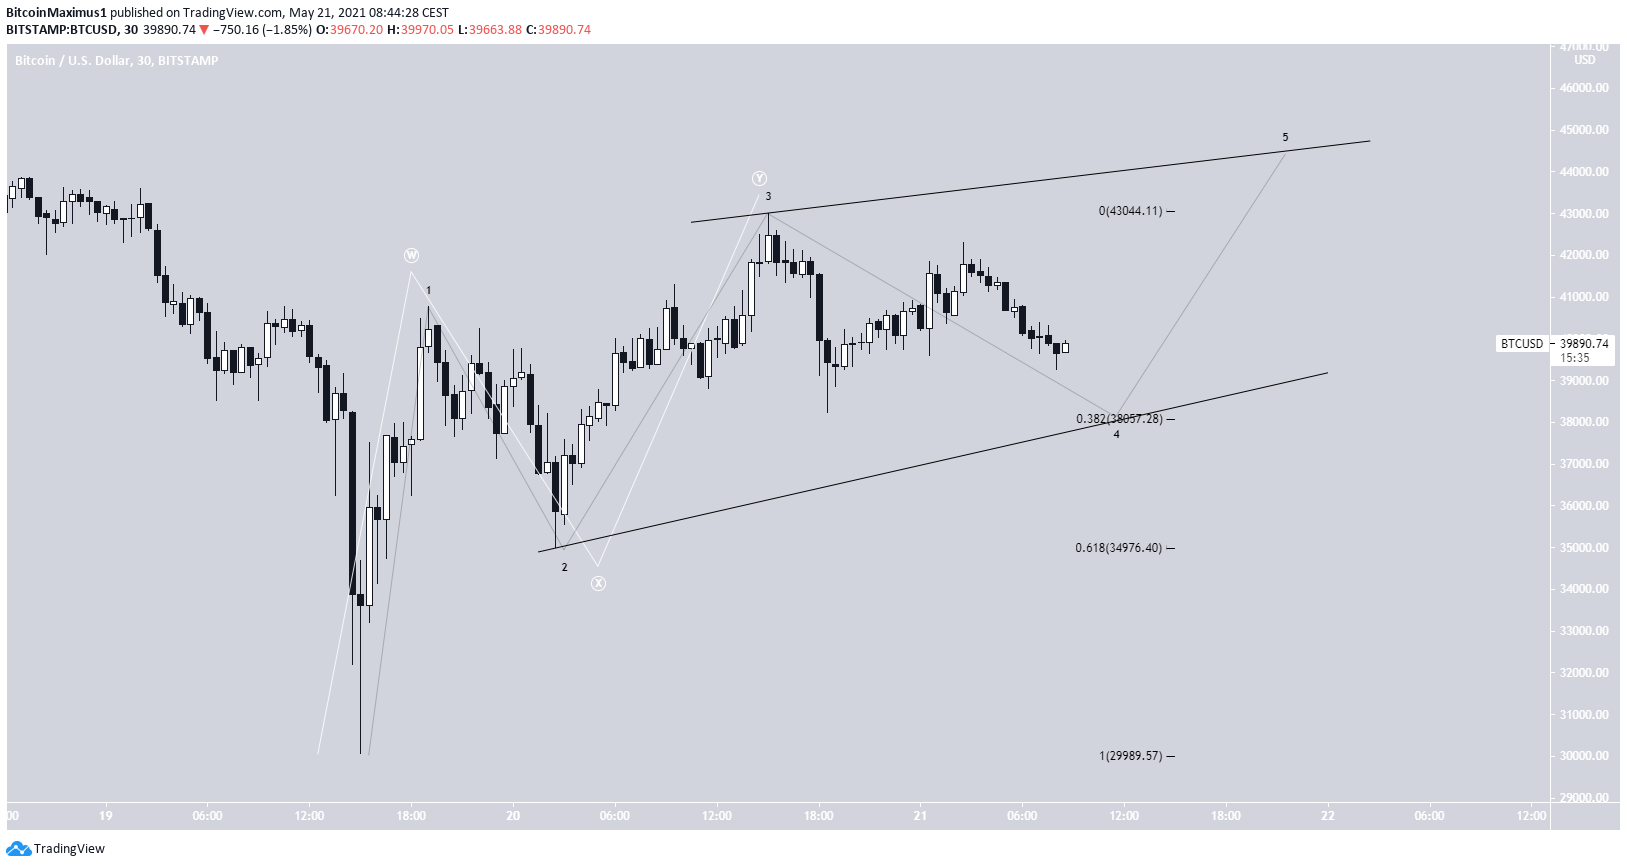
The short-term wave count is not entirely clear since the move from the lows consists of three waves instead of five.
So, it’s either following a leading diagonal (black) or a complex corrective structure (white). Currently, it cannot be determined which is more likely.
In any case, the main support levels are found at $38,000 and $35,000.
If the move is a leading diagonal, BTC could bounce at the $38,000 level. If it’s a complex correction, BTC could potentially fall all the way to $35,000 before any further upwards movement.
For the longer-term count, click here.
For BeInCrypto’s previous bitcoin (BTC) analysis, click here.
