


The bitcoin (BTC) price briefly fell below $54,000 in the early hours of March 16.
Despite the drop, a bounce is already underway. Furthermore, it’s possible that BTC has already reached a local bottom.
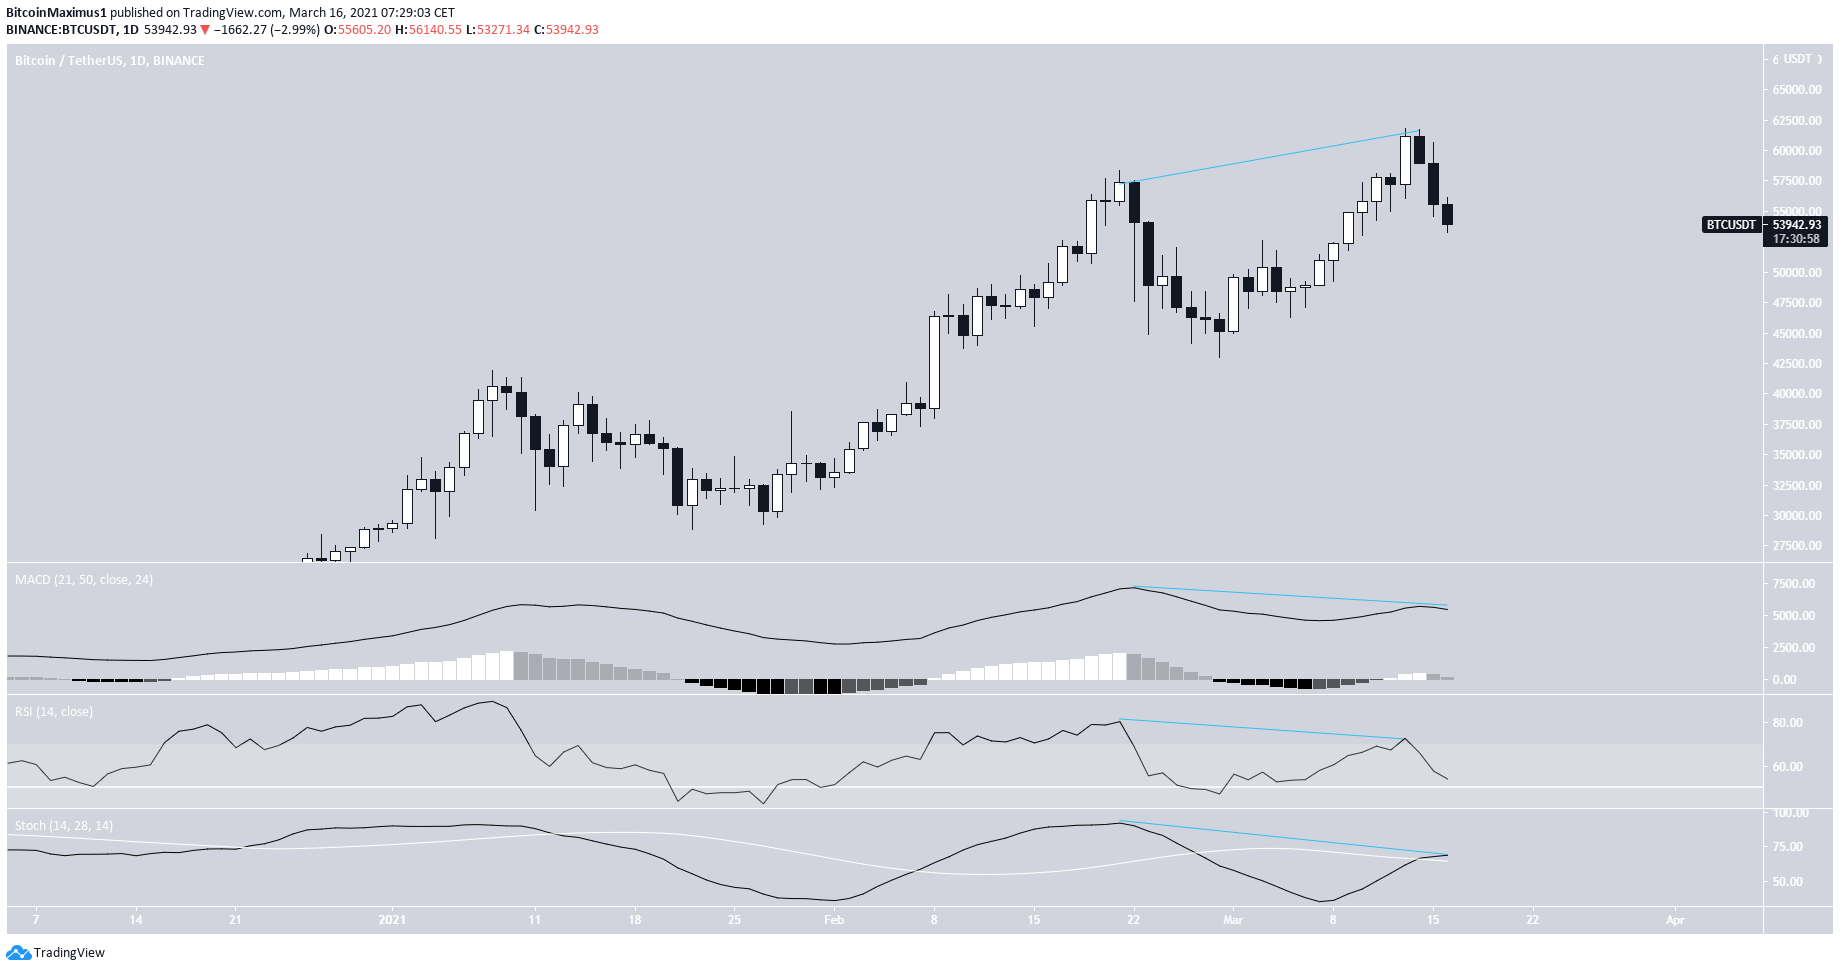
Divergence Spells Weakness
The price has been moving downwards since March 13 when it reached a new all-time high price of $61,781. Since then, it’s reached a local low of $53,221 on March 16.
The ongoing drop was preceded by a significant bearish divergence in the MACD, RSI, and Stochastic oscillator.
However, since a significant drop has occurred, it’s possible that the divergence has already played out.
The MACD is still positive, the RSI is above 50, and the stochastic oscillator has made a bullish cross.
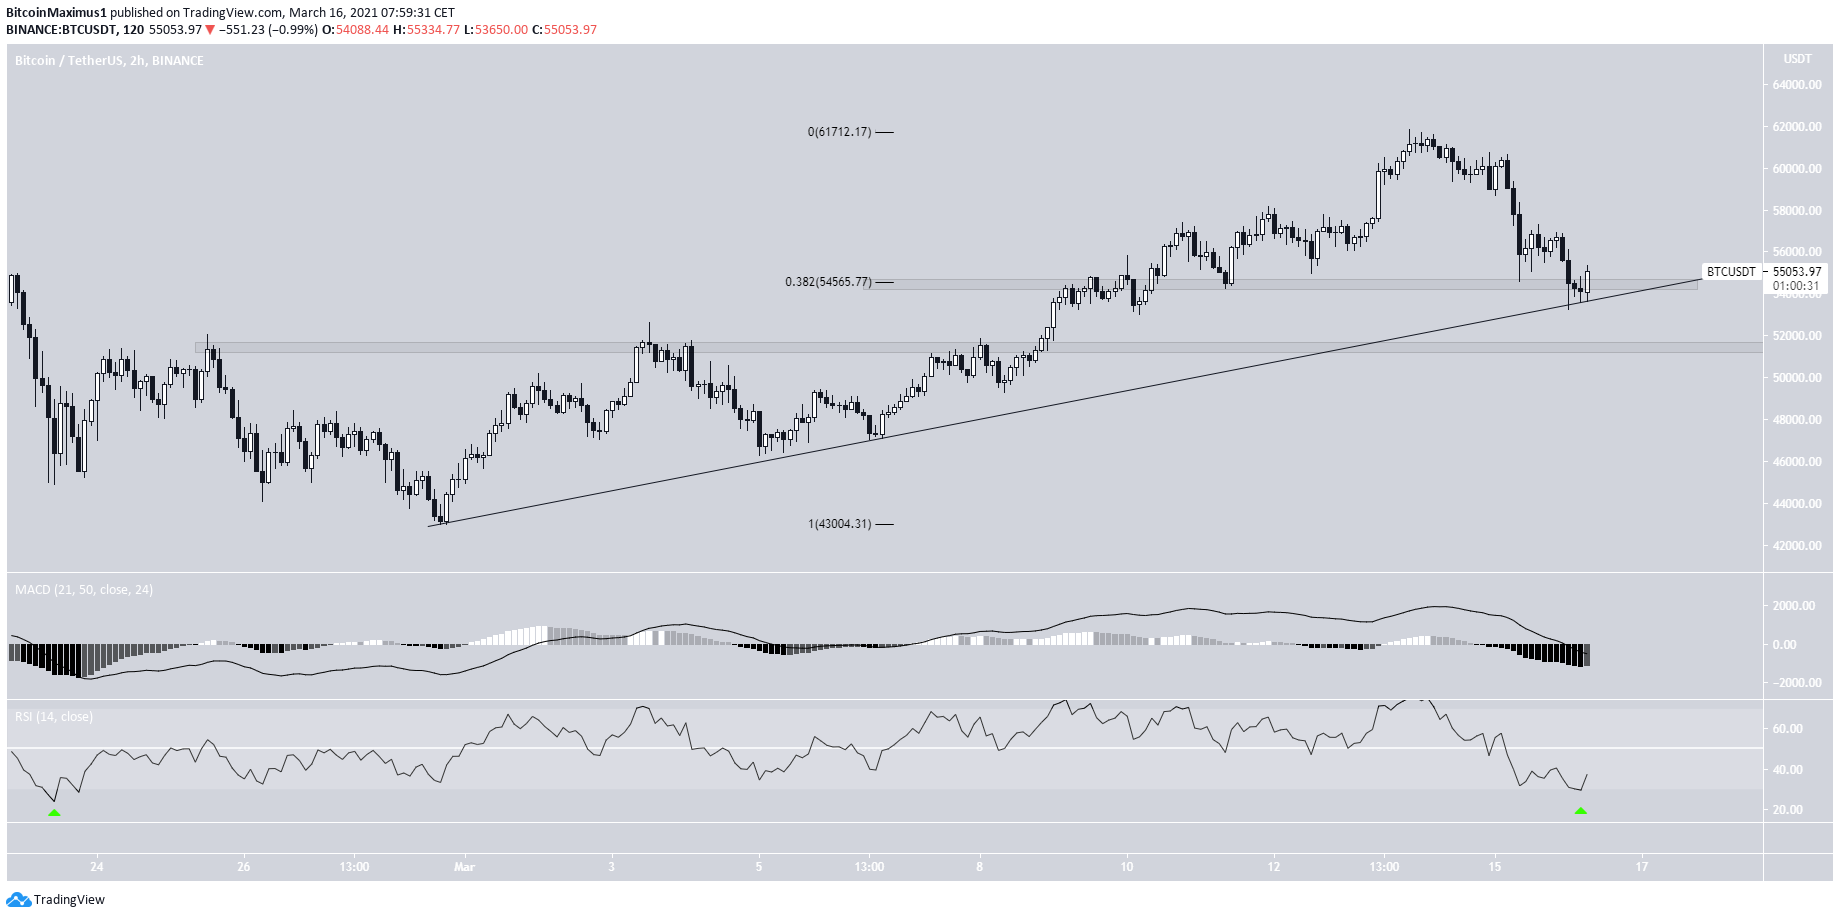
Short-Term Movement For BTC
The two-hour chart shows an ascending support line. This line has been followed since the beginning of March.
BTC has just returned to the line for the fourth time and initiated a bounce. The line also coincides with the short-term support area at $54,565.
There are no clear bullish reversal signs. However, the RSI has dropped into oversold territory. Previously, this has been followed by an upward movement.
If a breakdown were to occur, the next support area would be found at $51,500. Though, at the time of press, this does not seem likely.
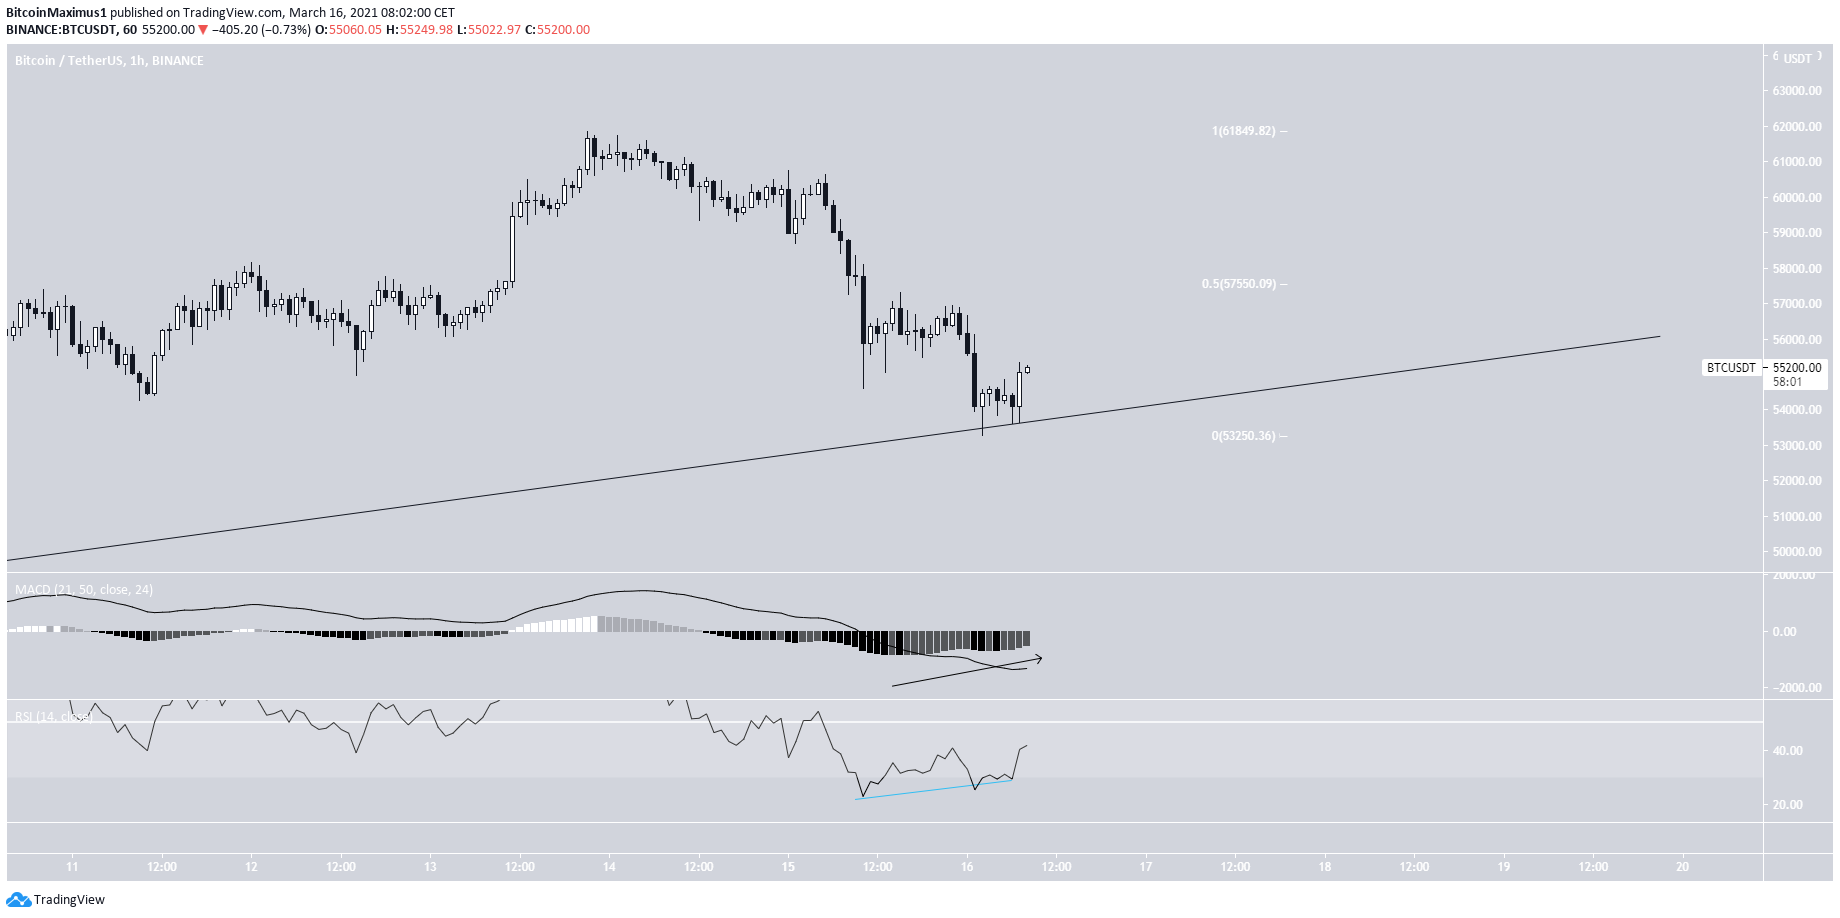
The one-hour chart is more bullish and shows a pronounced bullish divergence in both the MACD and RSI.
If BTC manages to clear the 0.5 Fib retracement level resistance at $57,500, it would likely confirm that the trend is bullish.
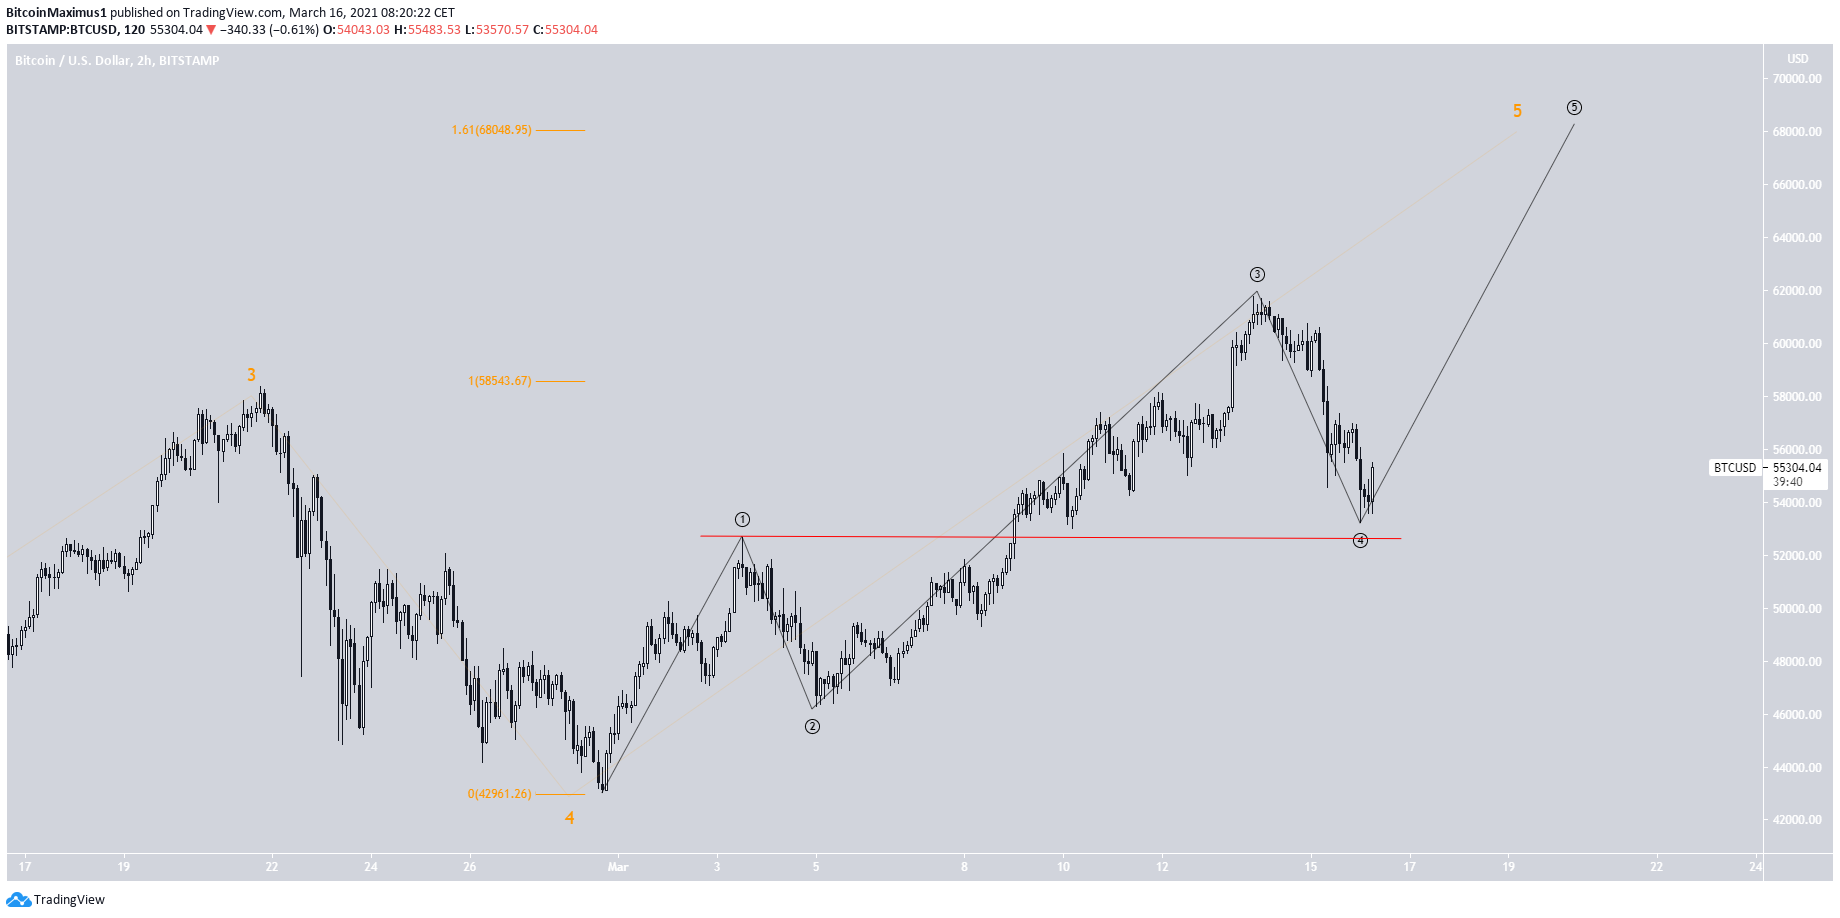
BTC Wave Count
The wave count suggests that BTC has now begun sub-wave five (black) of wave five (orange).
A potential target for the top of the movement is found near $68,000.
The recent drop did not touch the top of sub-wave one at $52,652. Therefore, the wave count is still valid.
For the longer-term wave count, click here.
Conclusion
The ongoing bounce that BTC is experiencing is expected to continue. The price is expected to reclaim the resistance at $55,500.
For BeInCrypto’s previous bitcoin (BTC) analysis, click here.


