
After a sharp fall on Dec 4, Bitcoin (BTC) has broken down from its bullish structure. However, it has initiated a short-term rebound.
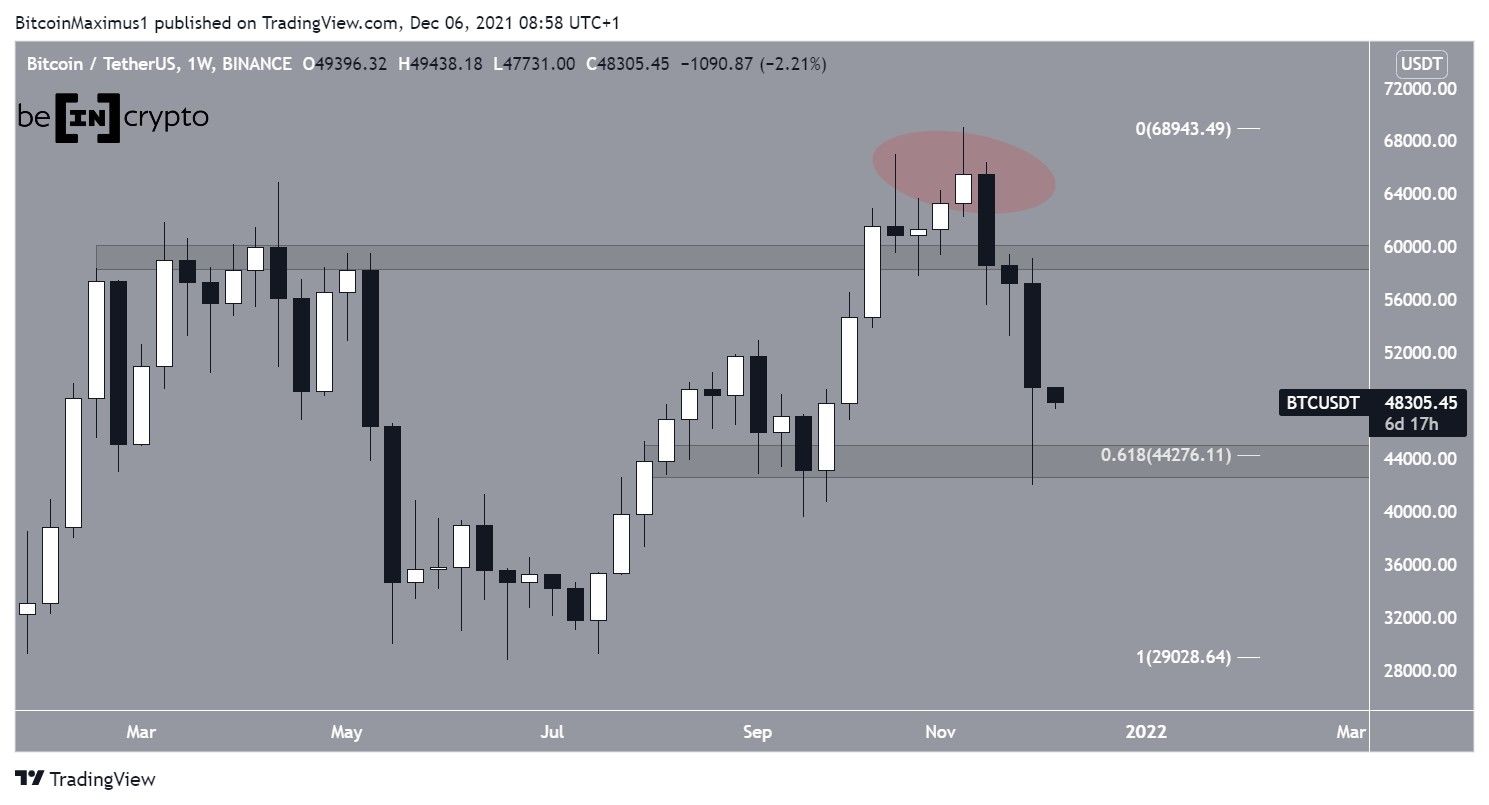
BTC decreased considerably during the week of Nov 29-Dec 5. It reached a low of $42,000, which was a full 27% below its opening price.
However, it bounced back a bit after and managed to reach a close of $49,396. The bounce created a long lower wick, which is considered a sign of buying pressure. Furthermore, it validated the $44,275 area as support. This is both a horizontal level and the 0.618 Fib retracement support level.
Nevertheless, the previous breakout above the $59,800 area is now considered a deviation (red circle), since the price was not able to stay above the horizontal support/resistance zone.
BTC breaks down from support
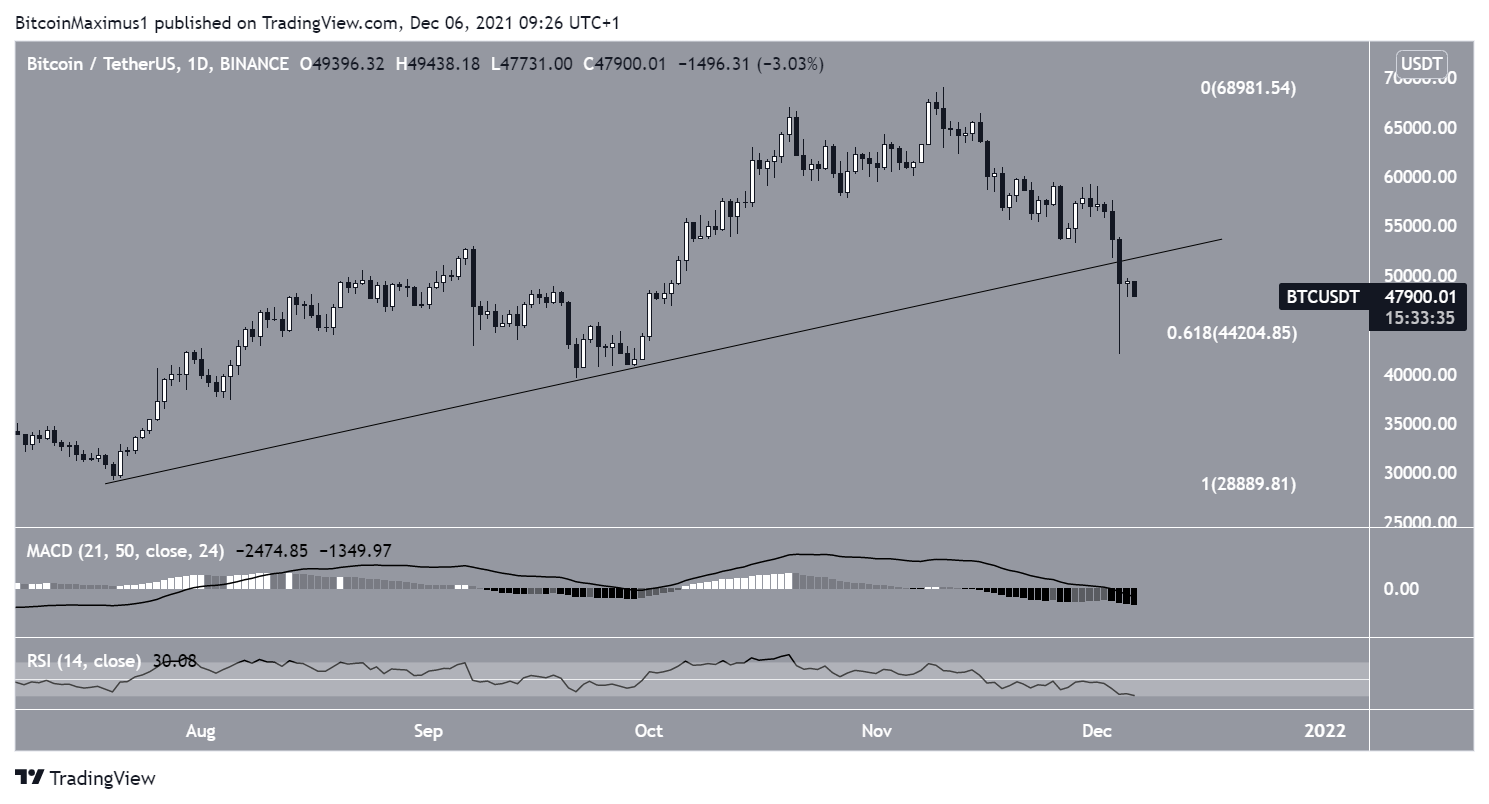
When looking at the daily chart, it’s visible that BTC has broken down from an ascending support line on Dec 4. It’s possible that the drop occurred as a result of stop hunting.
The support line had been in place since late July, at the time when the upward movement was just beginning.
Furthermore, technical indicators are bearish.
The MACD, which is created by short and long-term moving averages (MA), is negative and decreasing. This means that the short-term MA is slower than the long-term one. Furthermore, it’s back to creating lower momentum bars, another bearish sign that means the trend is decelerating.
The RSI, which is a momentum indicator, is below 50 and falling. It’s failed to reclaim the 50-line and validated it as resistance. Since the 50-line is often considered a benchmark for a bullish/bearish trend, this is seen as a bearish sign.
Therefore, while a bounce that validates the ascending support line as resistance is possible, the daily chart provides a bearish outlook.
Short-term movement
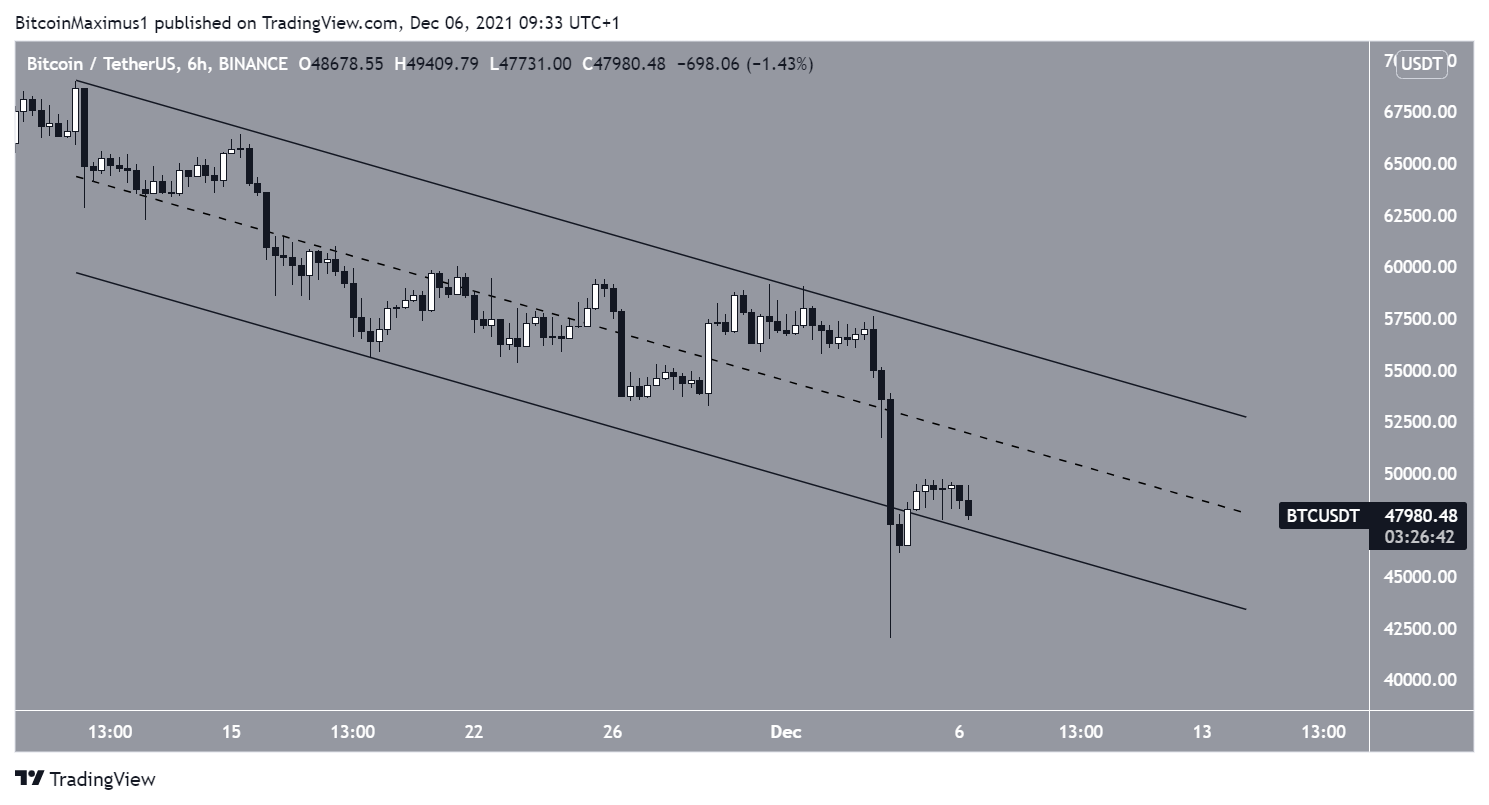
The six-hour chart shows that BTC could be trading inside a descending parallel channel. BTC moved below the channel on Dec 4 but has since returned back to trading inside of it.
If it manages to continue trading inside the channel, it would be considered a bullish sign. The reason for this is that parallel channels usually contain corrective structures, meaning that a breakout from would still be expected.
However, a breakdown from the support line of the channel would likely lead to lower prices.
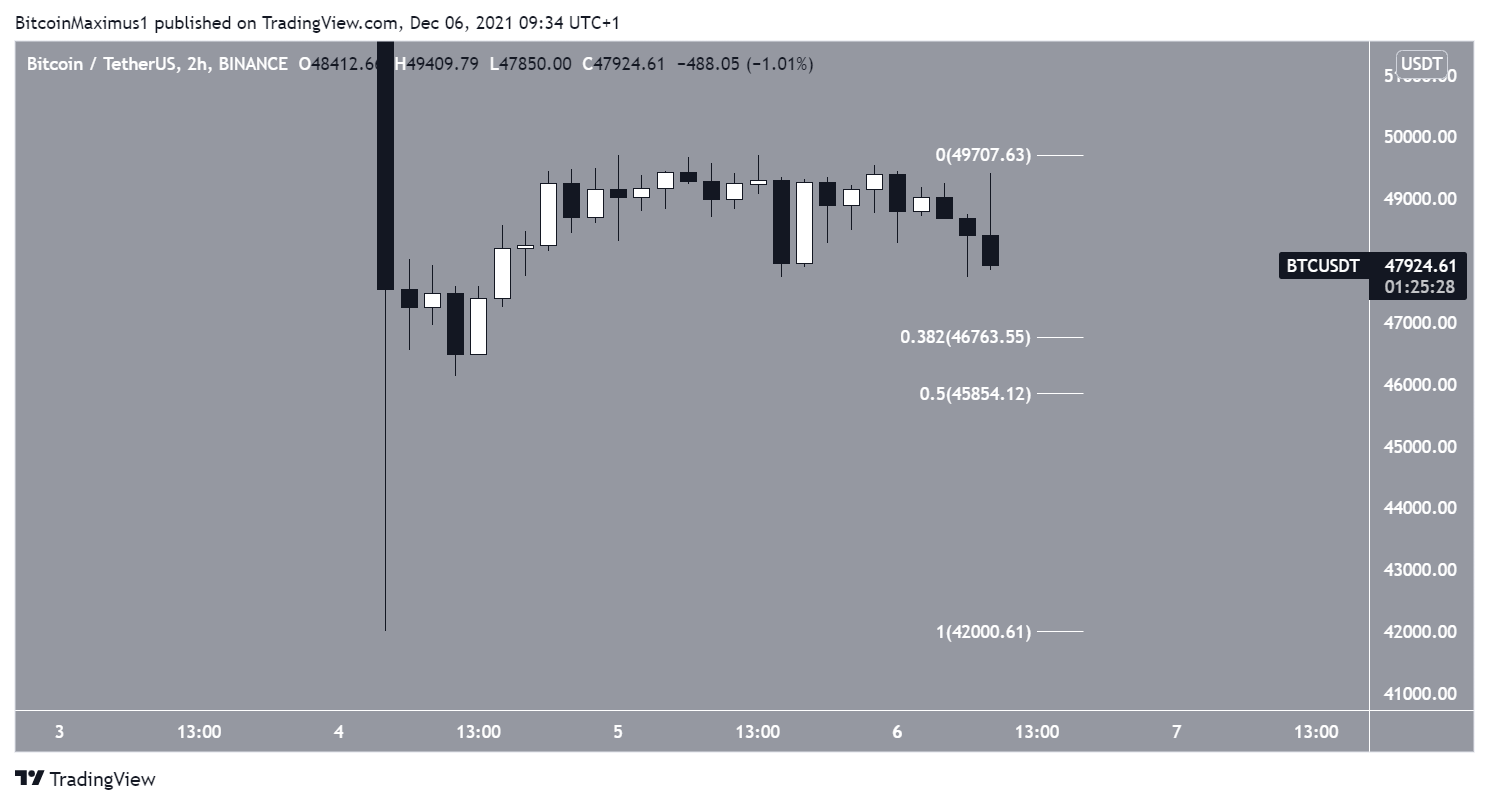
The two-hour chart shows that the main support area is found between $45,854 and $46,763. This range is the 0.382-0.5 Fib retracement support level and a horizontal support area.
If BTC were to create a higher low and continue higher, potentially validating the previous ascending support line on the daily chart, this would be the level to create it.
For BeInCrypto’s previous Bitcoin (BTC) analysis, click here.
