
Bitcoin (BTC) has been decreasing since breaking down from a symmetrical triangle on June 7.
While it initiated a strong bounce at $31,000, it’s likely that the low has not been reached yet.
BTC breaks down
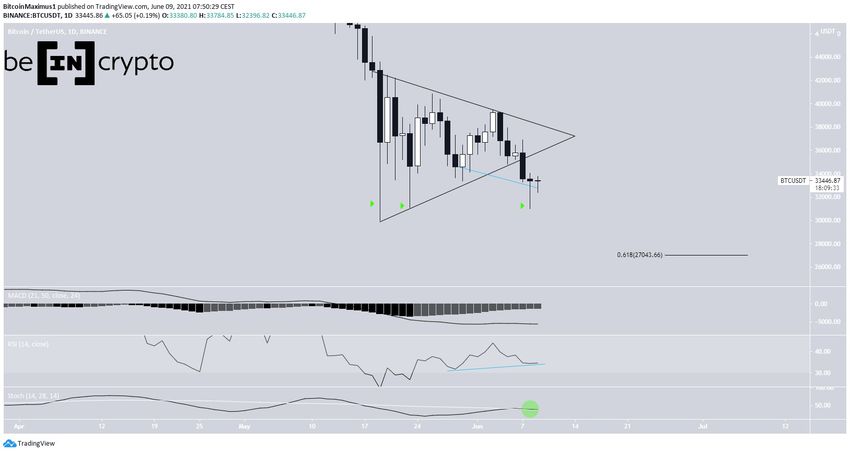
On June 7, BTC broke down from a symmetrical triangle pattern, and proceeded to reach its lowest daily close since January.
However, it created a long lower wick and bounced. The wick was similar to those created on May 19 and 23 (green icons).
Furthermore, there are some bullish signs in place, such as a potential bullish divergence in the RSI.
However, the Stochastic oscillator is close to making a bearish cross once again.
The main support area is found at $27,000, This is the 0.618 Fib retracement support level when measuring the entire upward movement.
Future BTC movement
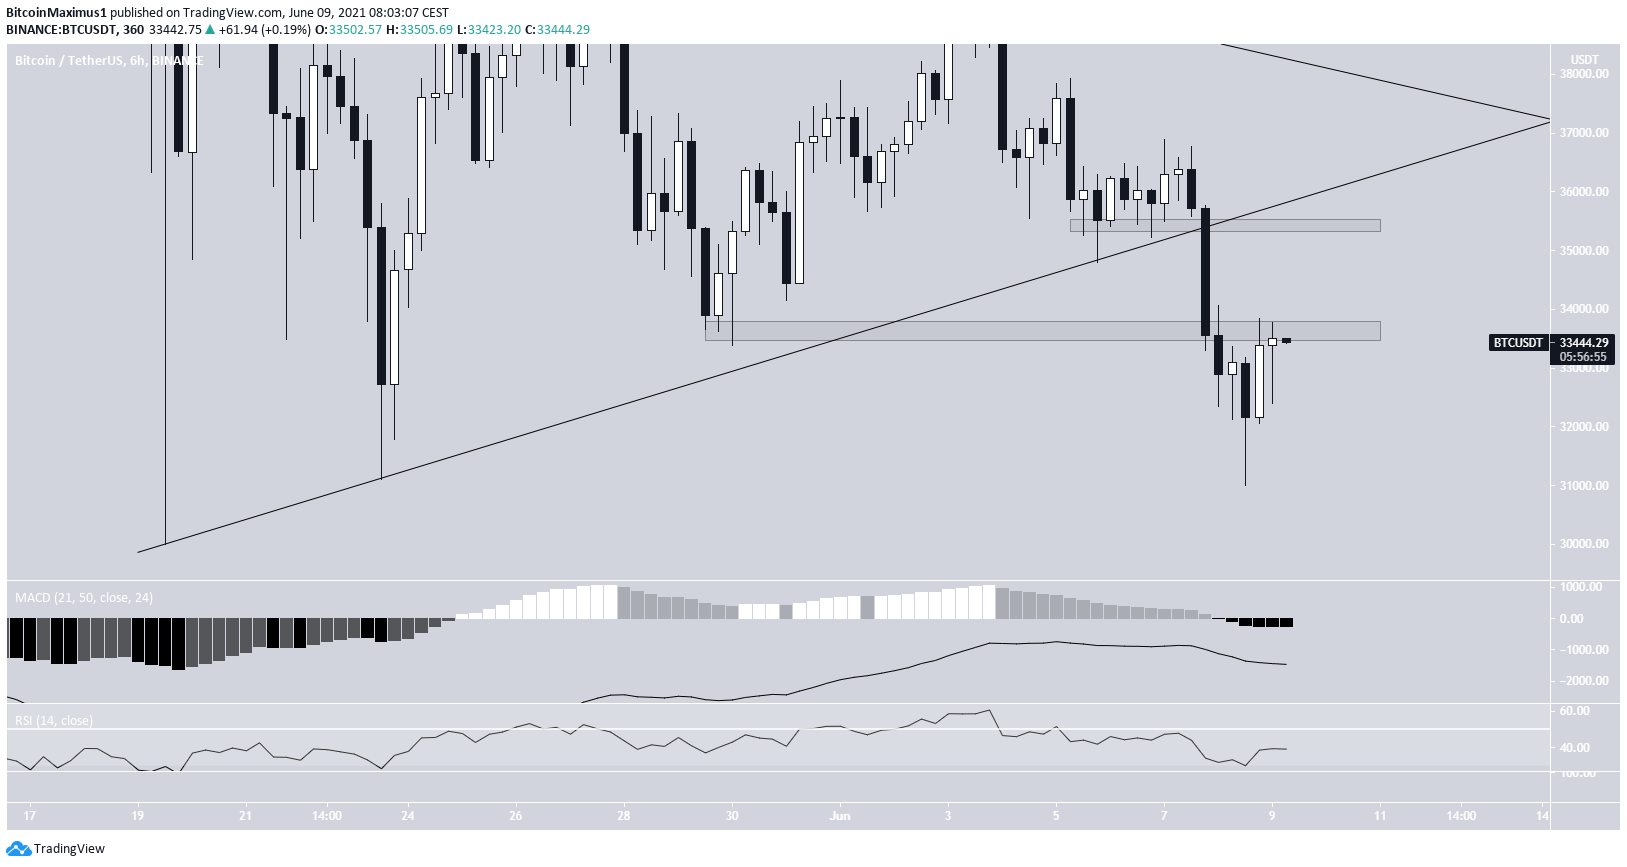
Despite the bounce, the six-hour chart does not provide any bullish signs. Both the MACD and RSI are falling. The former is negative while the latter is below 50.
Furthermore, there are two main resistance levels, at $33,600 and $35,450. BTC is currently trading inside the former.
Unless it manages to clear this resistance and then validate it as support, we cannot consider the short-term trend bullish.
Wave count
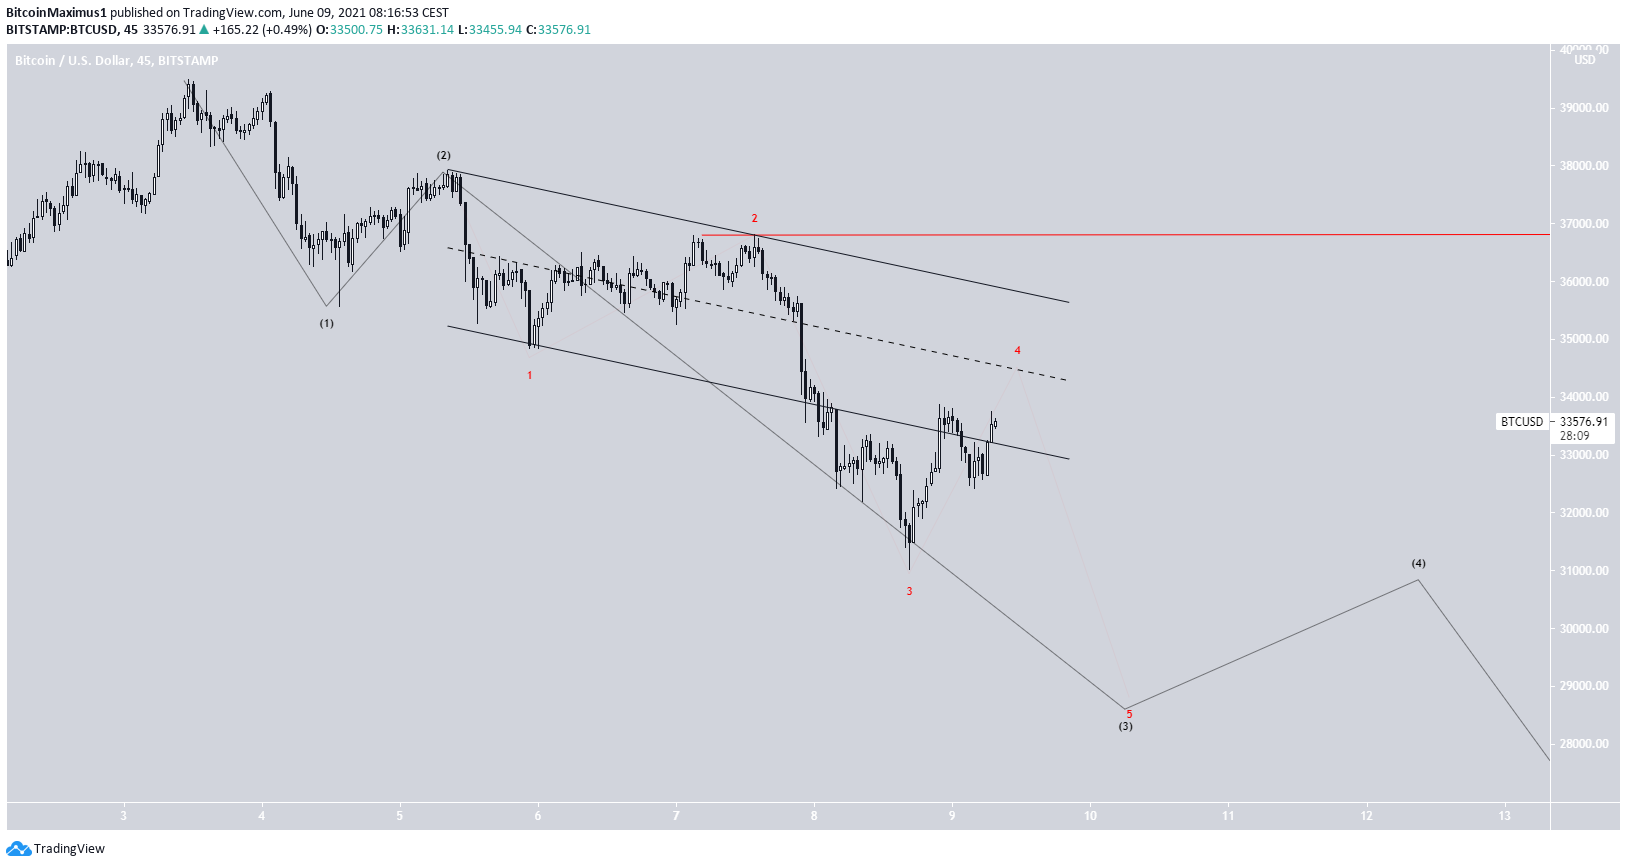
The wave count suggests that BTC is in wave three (black) of a bearish impulse that began with the triangle breakdown.
Currently, it’s in sub-wave four (red), potentially completing a fourth wave pullback. After it’s completed, BTC would be expected to resume its downward movement.
An increase above the sub-wave two high at $36,800 (red line) would likely invalidate this possibility.
For the longer-term count, click here.
For BeInCrypto’s previous bitcoin (BTC) analysis, click here.
