


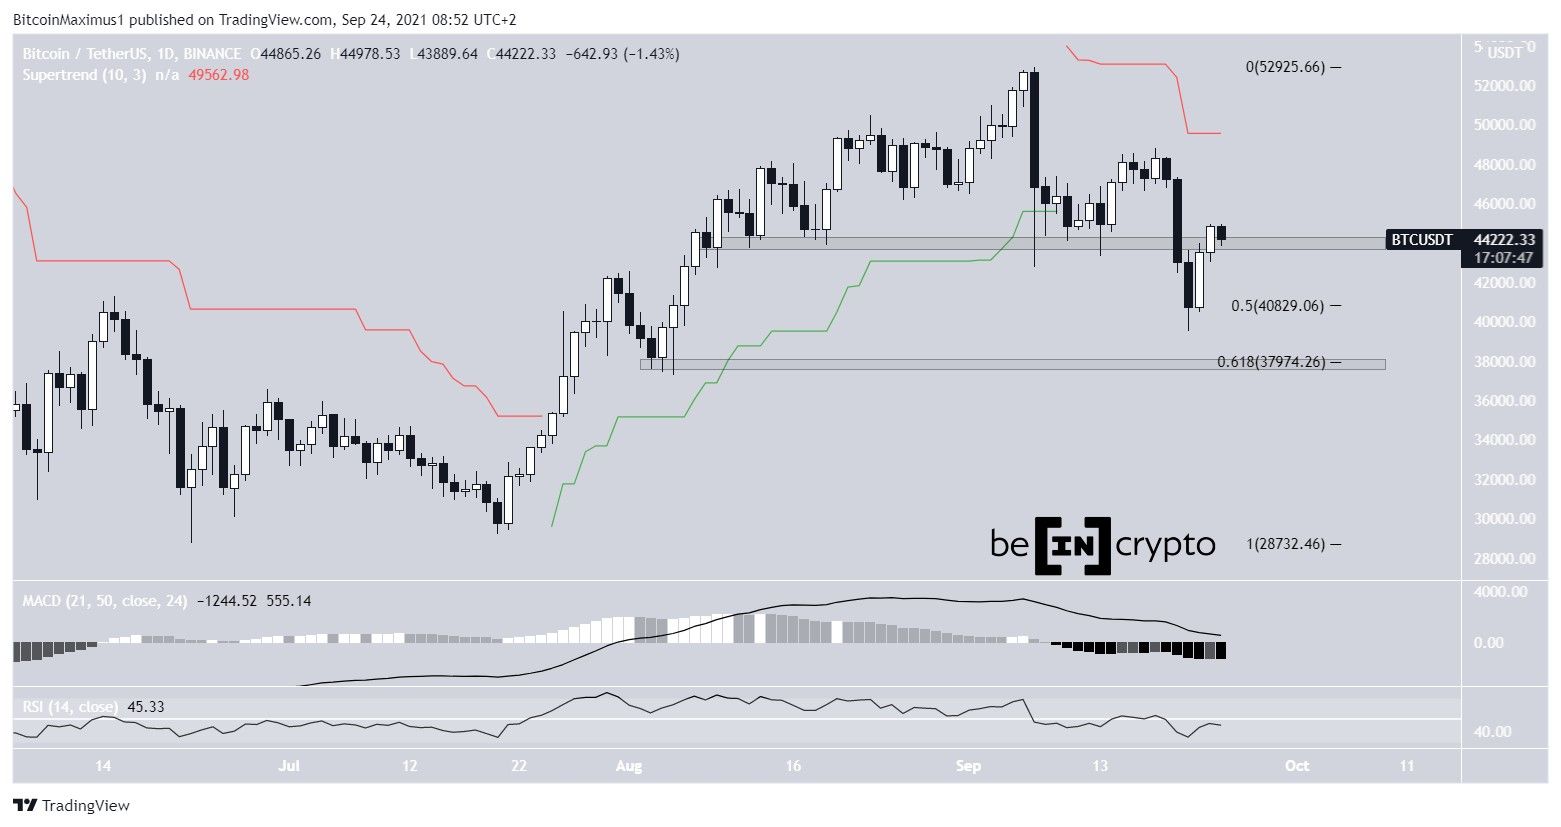
After increasing considerably since Sept 21, Bitcoin (BTC) is in the process of reclaiming the $44,000 horizontal area.
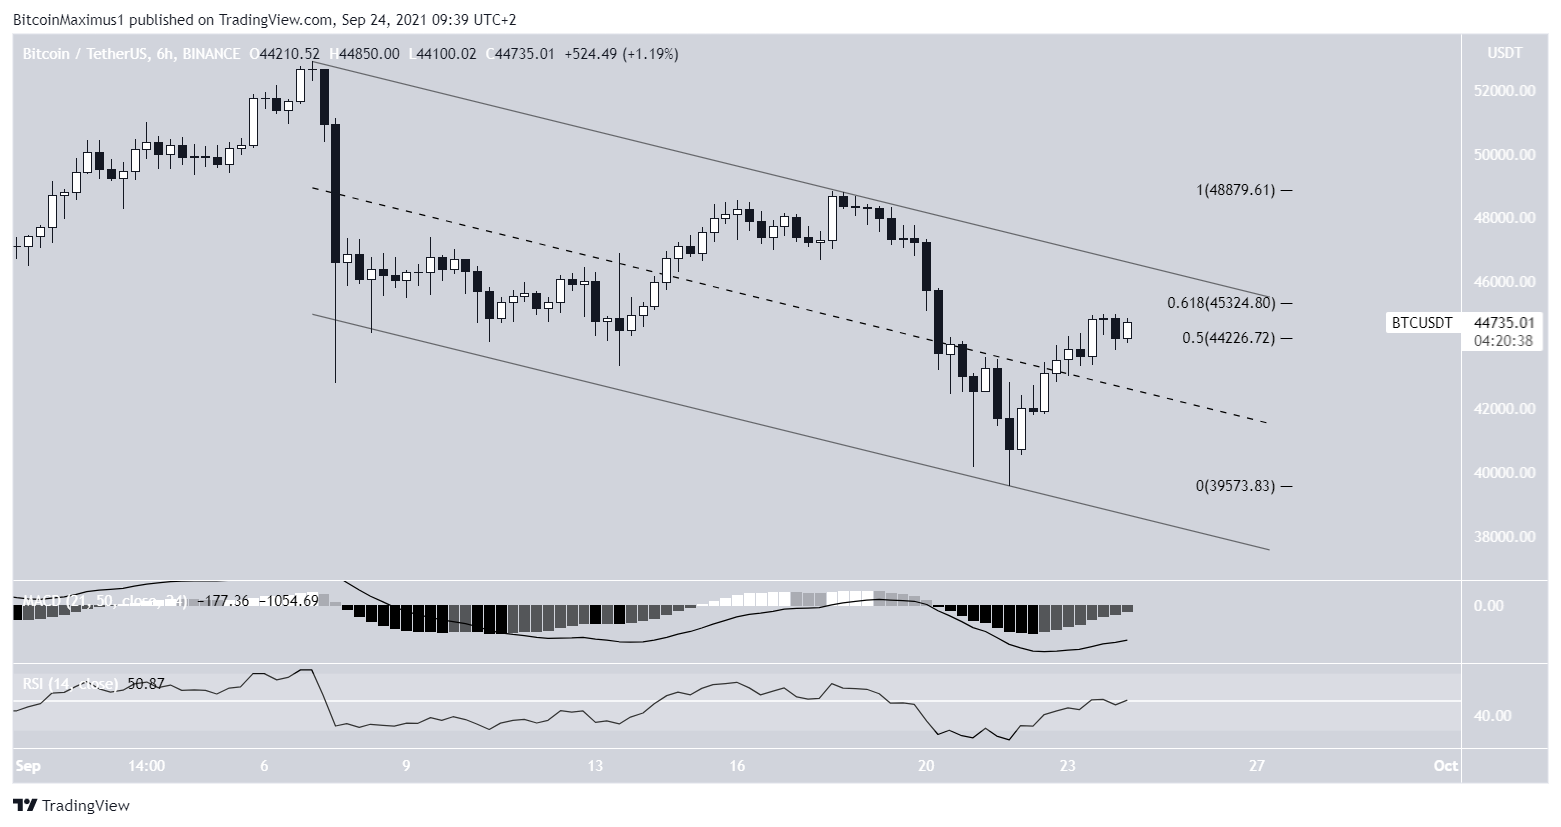
BTC is trading inside the upper portion of a descending parallel channel, from which a breakout is likely. However, it’s also facing short-term resistance.
BTC attempts to reclaim support
On Sept 22, BTC created a bullish engulfing candlestick after bouncing at the 0.5 Fib retracement support level at $40,800.
It resumed its ascent the next day and has moved above the $44,000 area. The area previously acted as support and is now expected to act as resistance.
However, BTC reached a close above it and is now in the process of validating it as support. Doing so would be a major bullish development.
Technical indicators in the daily time frame are still bearish. The RSI is below 50, the MACD is decreasing (even though it has created one higher momentum bar), and the Super trend is bearish.
If another breakdown were to occur, the next support would be found at $38,000.
Future BTC movement
The six-hour chart shows that BTC is trading inside the upper portion of a descending parallel channel. Such channels usually contain corrective movements, so a breakout from it is eventually expected.
However, BTC is trading inside the 0.5-0.618 Fib retracement resistance area, therefore a short-term rejection could occur prior to the eventual breakout.
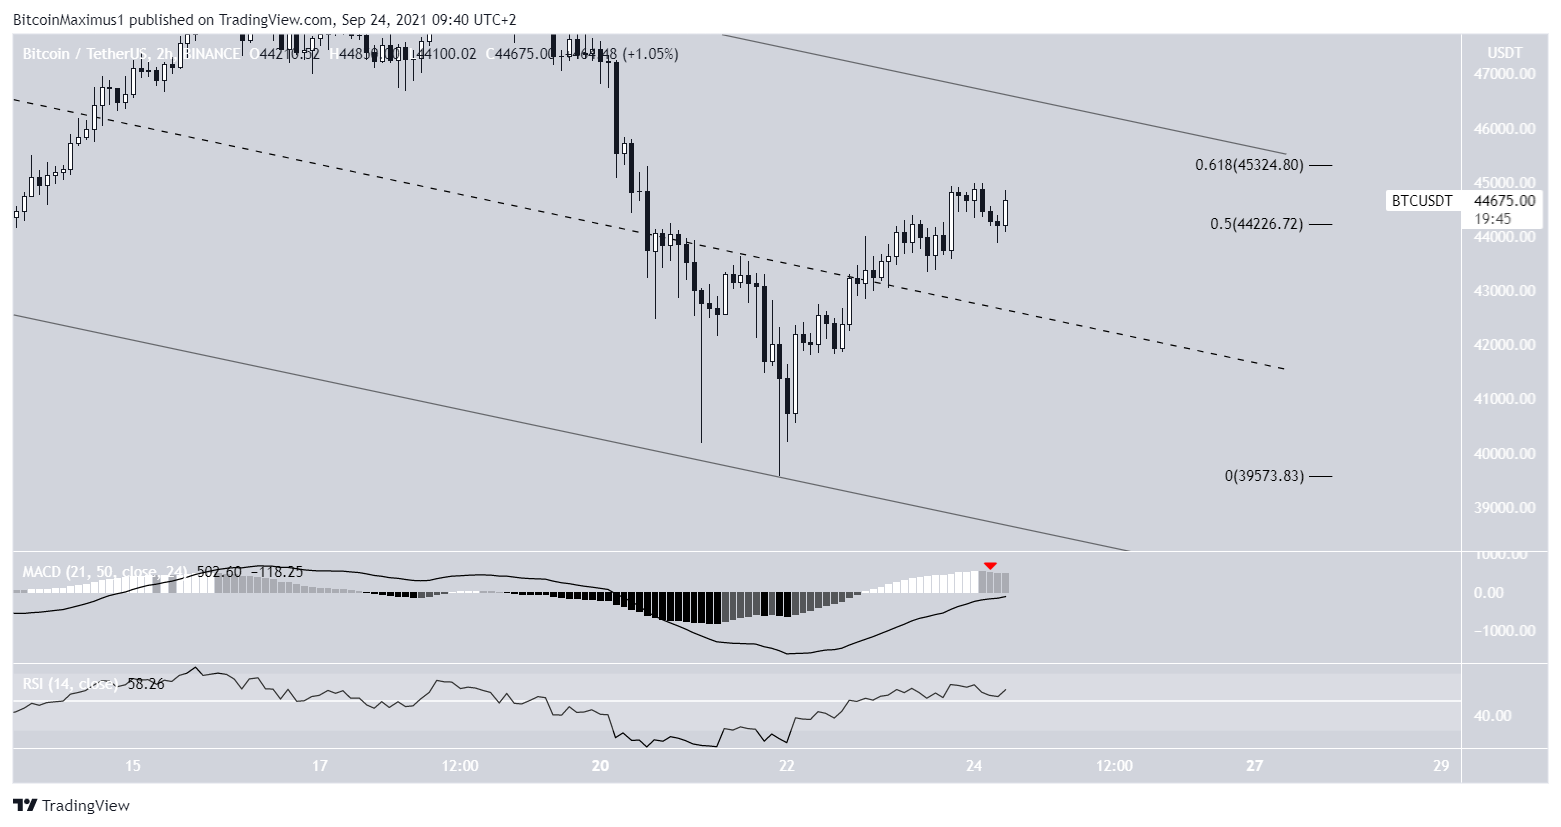
This possibility is also supported by the two-hour chart, which shows a decreasing MACD (red icon).
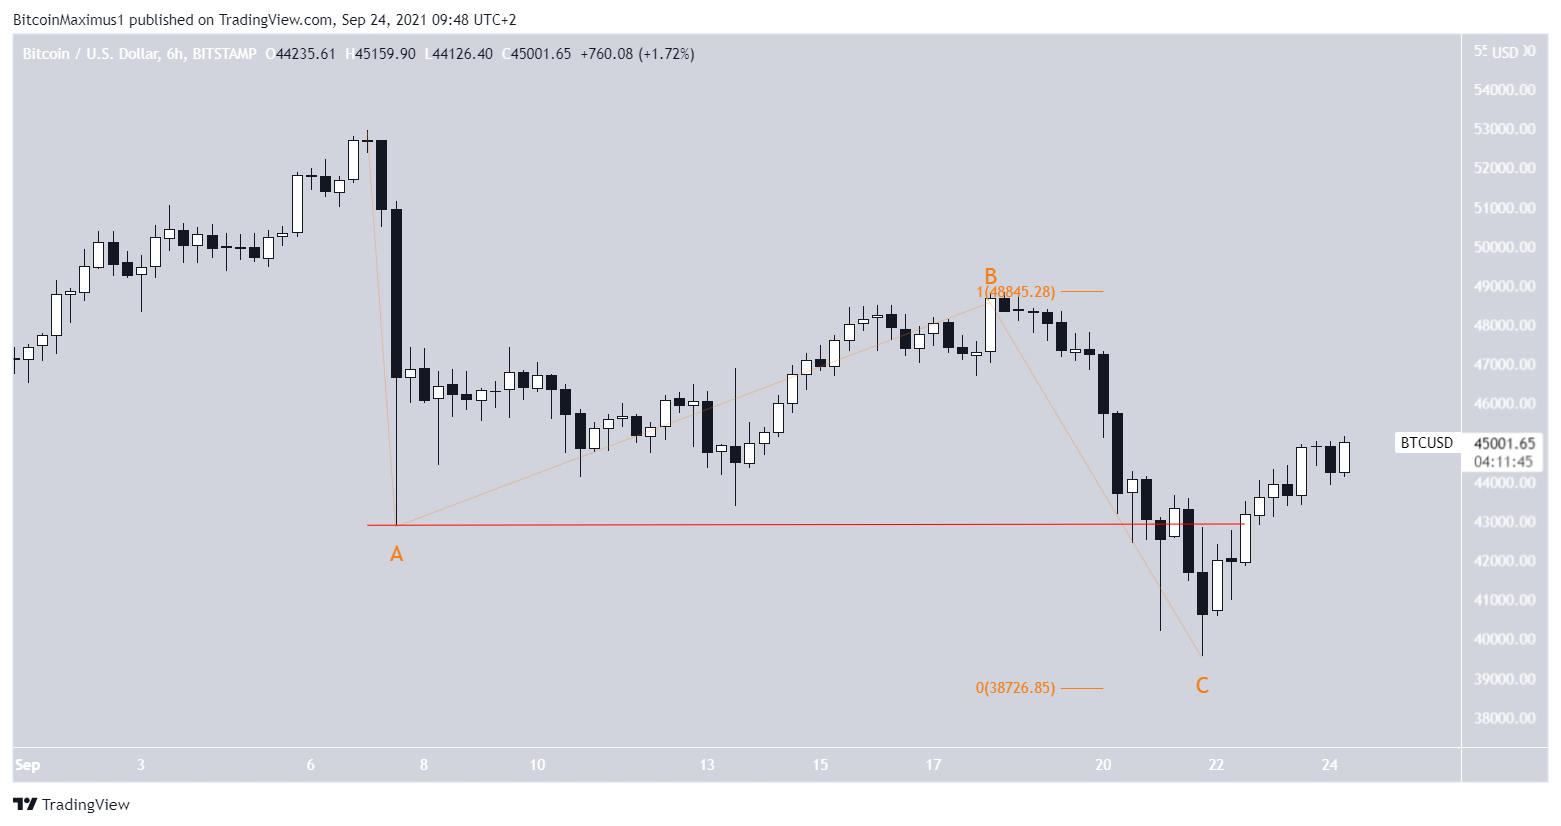
Wave count
The decrease since Sept 7 was likely part of an A-B-C corrective structure (orange), in which waves A:C had a near 1:1 ratio.
The Sept 21 low likely marked the end of this correction. The increase above the A wave low (red line) further supports this possibility.
The most long-term wave count indicates that this decrease was wave two of a longer-term bullish impulse.
For BeInCrypto’s previous Bitcoin (BTC) analysis, click here.


