


Bitcoin (BTC) is currently making its third attempt at breaking out from a short-term descending wedge in order to resume its upward movement.
Bitcoin has been falling since reaching a high of $24,669 on July 30. The downward movement has thus far been contained inside a descending wedge. The descending wedge is normally considered a bullish pattern, meaning that it leads to breakouts the majority of the time.
On Aug. 2, the price rebounded at the 0.5 Fib retracement support level at $22,650 and moved upwards, also coinciding with a horizontal support area. BTC is now making an attempt at breaking out above the descending resistance line
If BTC breaks out from the wedge, the closest resistance area would likely be reached at $23,650. This target is the 0.5 Fib retracement resistance level.
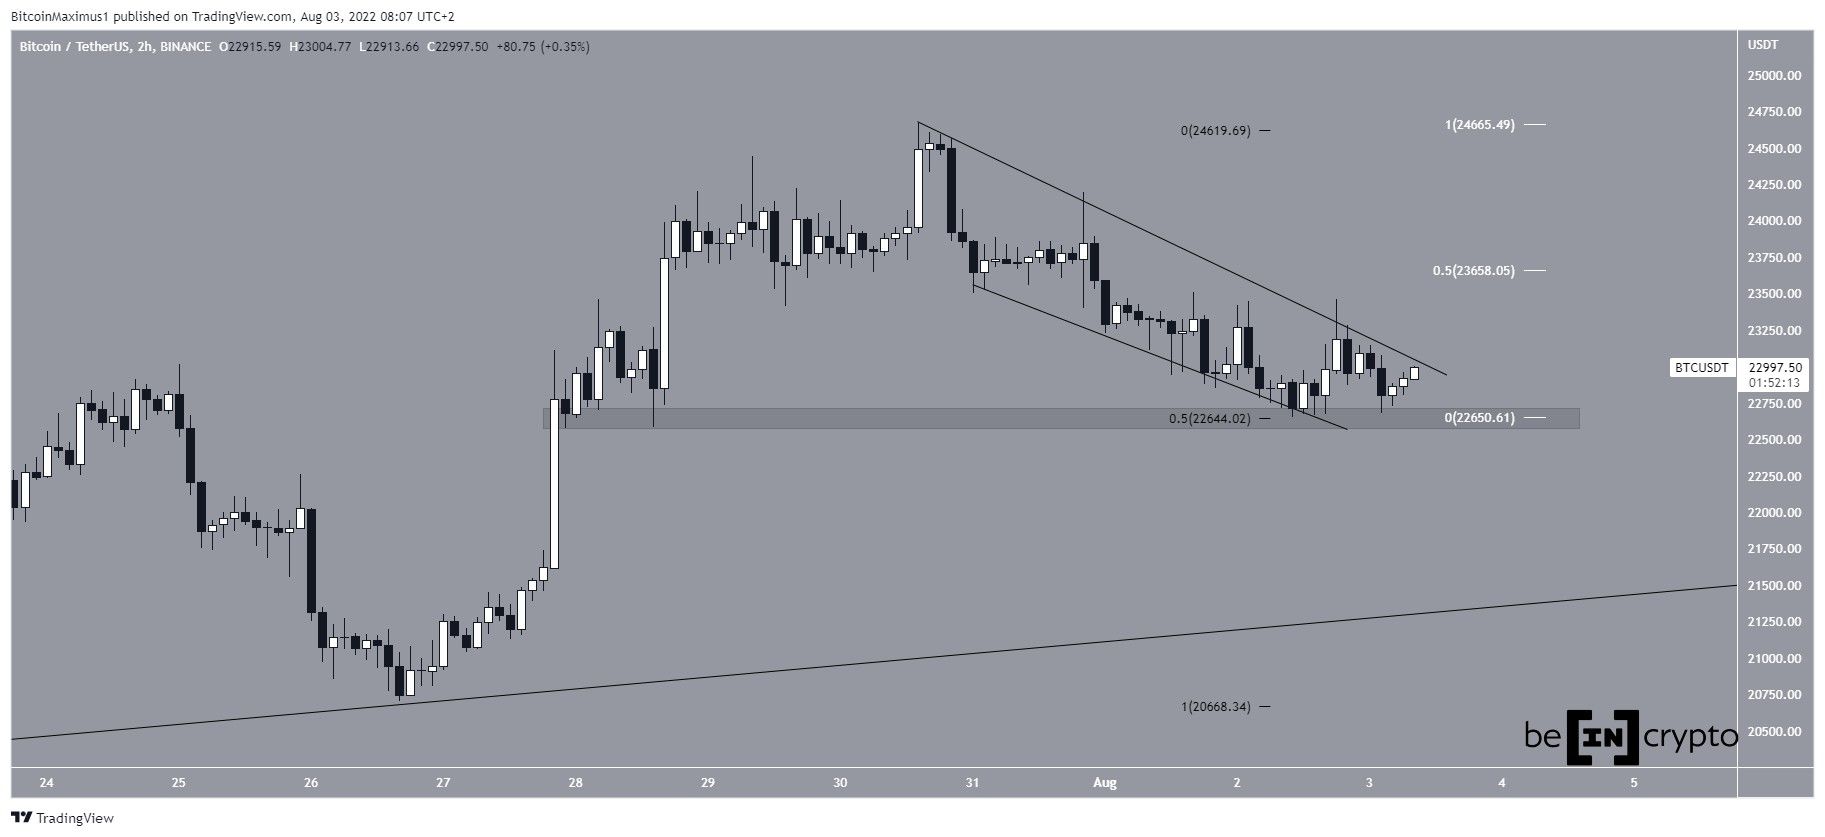
Current support
The six-hour chart shows that BTC has been trading above an ascending support line since June 19, most recently rebounding from it on July 26 (green icon). This led to the aforementioned $24,669 high on July 30.
Initially, Bitcoin appeared to have broken out above the $23,750 area but has since fallen below it, rendering it just a deviation.
So, the main horizontal resistance area is now at $23,750, slightly above the previously outlined Fib support.
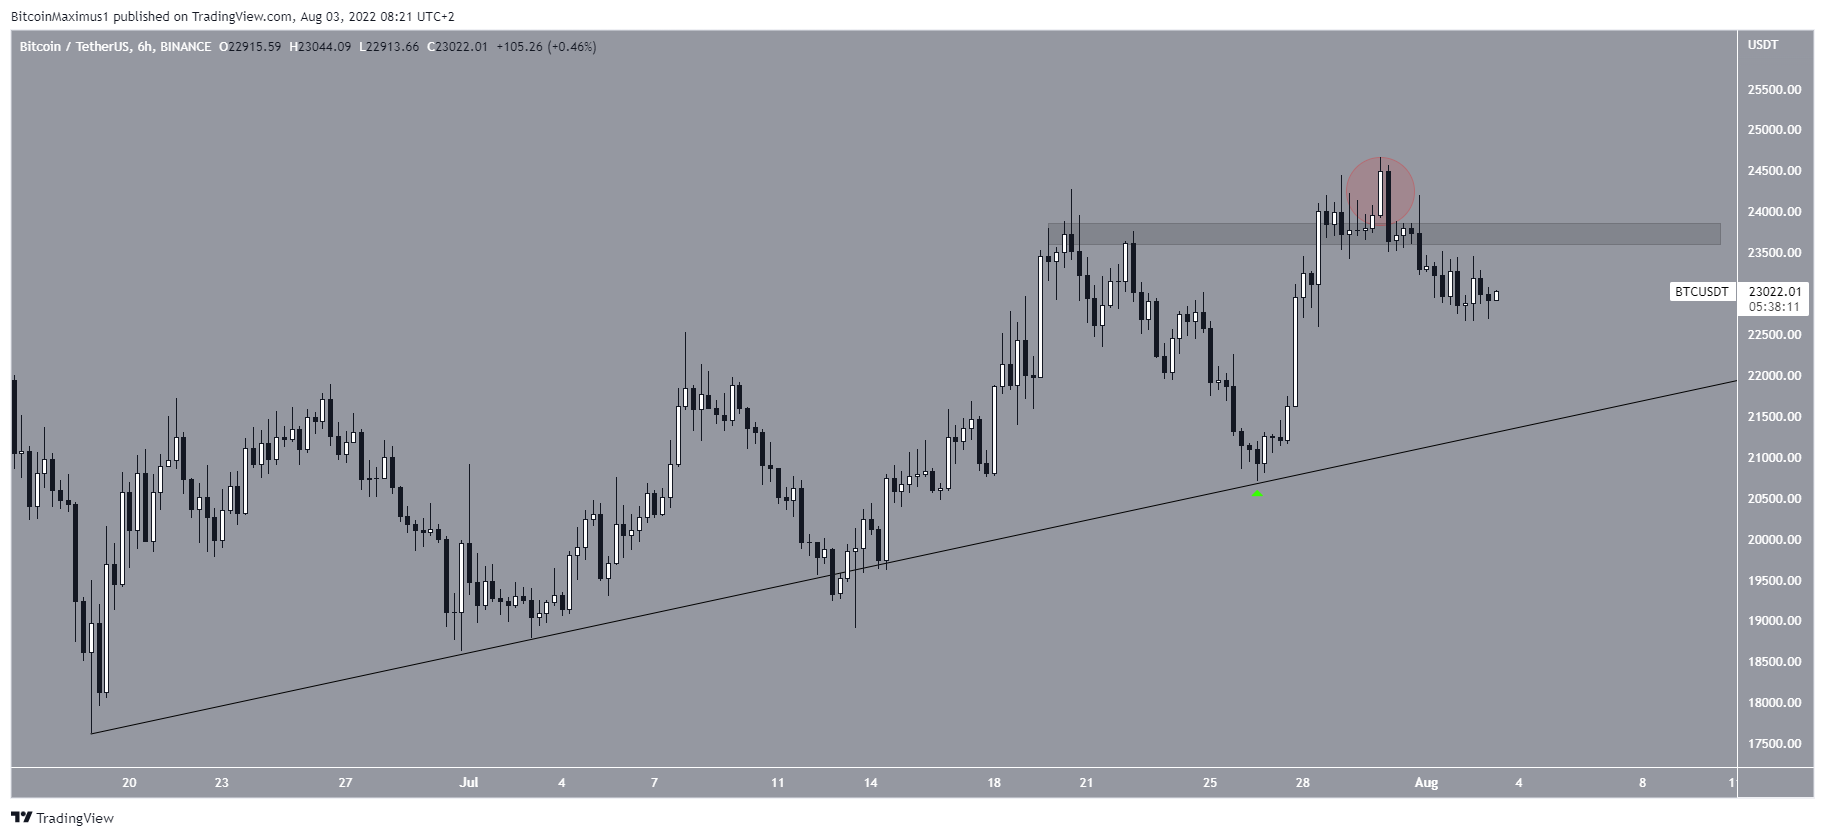
BTC wave count analysis
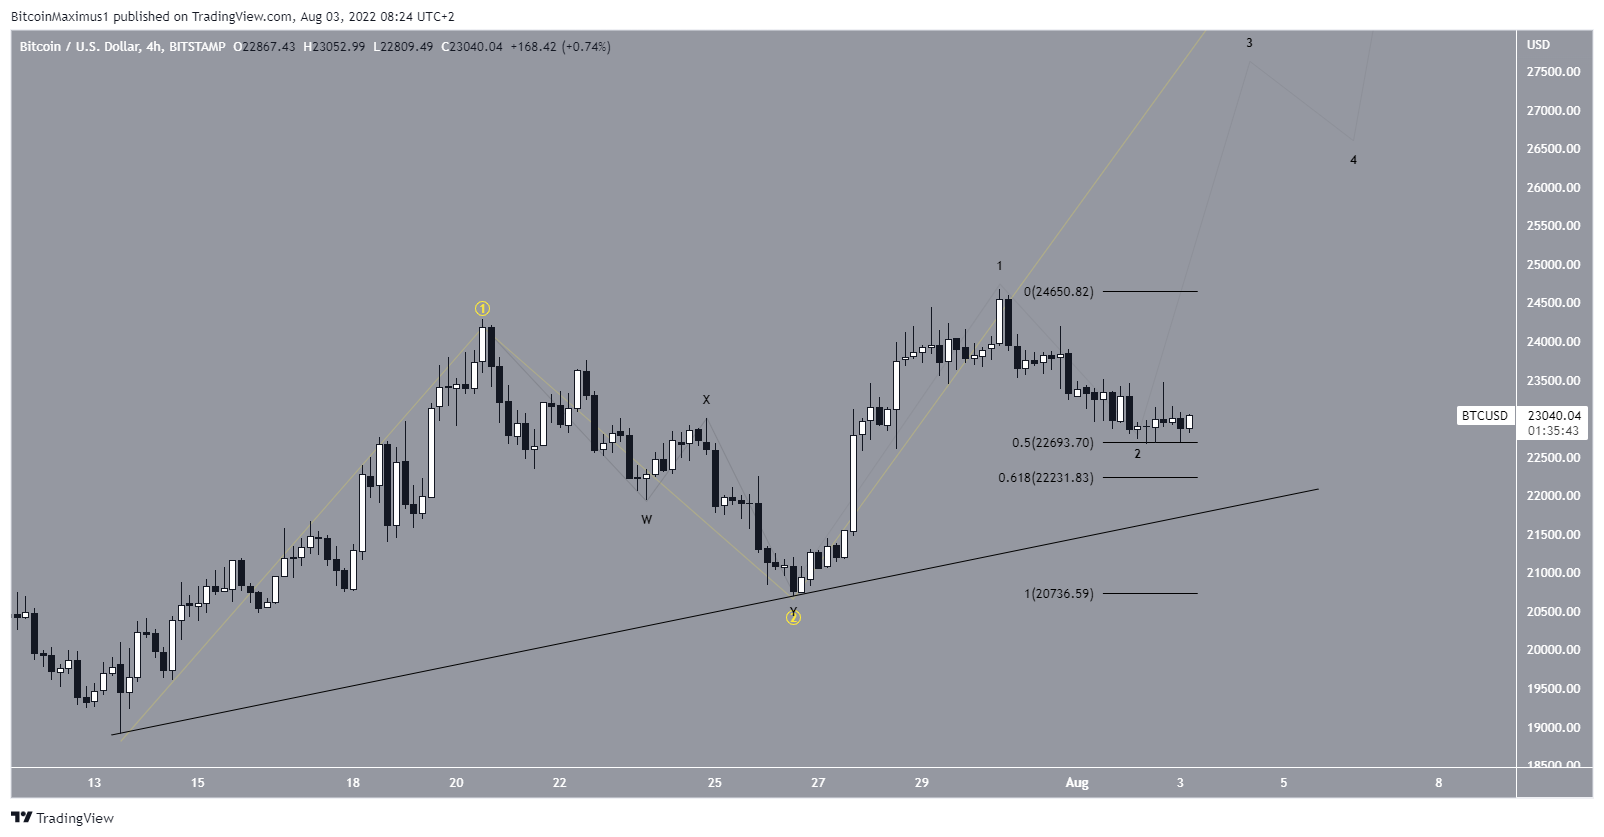
The most likely wave count suggests that Bitcoin has begun wave three of a five-wave upward move (yellow). Since wave three is usually the largest out of the five waves, a significant increase is expected if the count is correct.
The sub-wave count is shown in black. It indicates that the price is completing sub-wave two, after which a similarly large sub-wave three is likely to follow.
This seems to be a 1-2/1-2 wave formation, but a decrease below the ascending support line and the 0.618 Fib retracement support level at $22,230 would invalidate this particular wave count.
For Be[in]Crypto’s previous Bitcoin (BTC) analysis, click here



