
Bitcoin (BTC) is showing several bullish signs in lower time frames and could soon break out from its consolidation pattern.
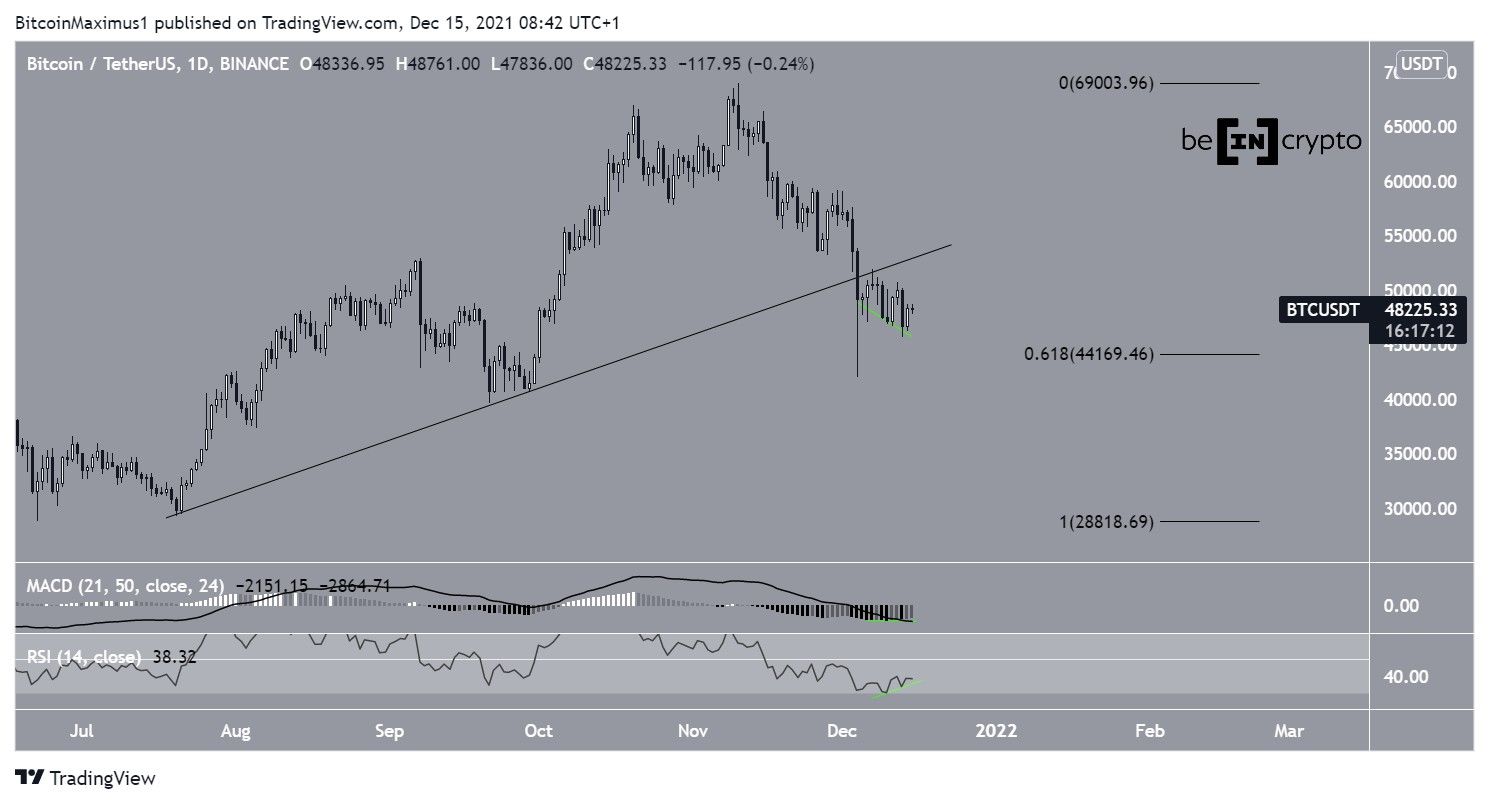
Despite BTC breaking down from a long-term ascending support line on Dec 4, it has been gradually moving upwards since. The bounce occurred right at the 0.618 Fib retracement support level at $44,150, increasing its significance and validating the area as support.
In addition to this, technical indicators are showing bullish signs. Both the RSI and MACD have generated bullish divergences (green lines). This indicates that the decrease in price was not accompanied by a similar drop in momentum — a signal that often precedes bullish reversals.
Therefore, the daily chart suggests that conditions are ripe for a potential reclamation of support.
Current channel
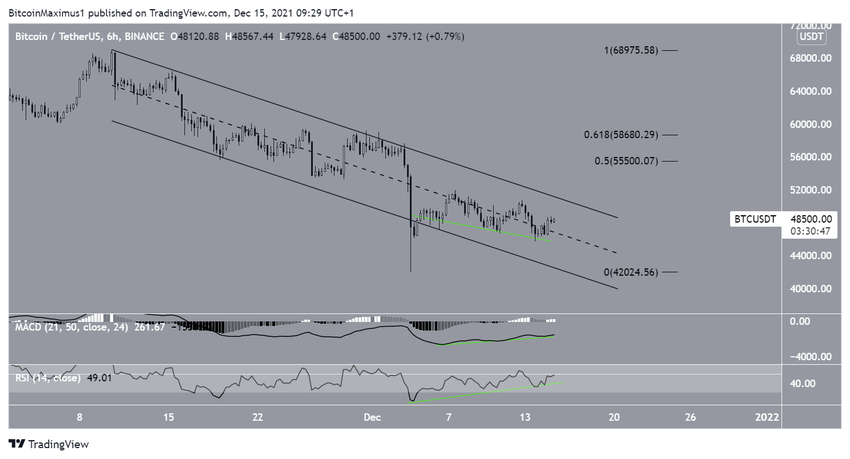
The six-hour chart shows that BTC is trading inside a descending channel since reaching its Nov 10 all-time high price of $69,000. Currently, it’s trading just above the midline of this channel.
More importantly, both the RSI and MACD have generated bullish divergences. This is similar to the daily time frame, with the exception that the divergence is even more pronounced.
If a breakout occurs, the closest resistance level would likely be reached between $55,500-$58,680. This range is the 0.5-0.618 Fib retracement resistance area.
BTC creates higher low
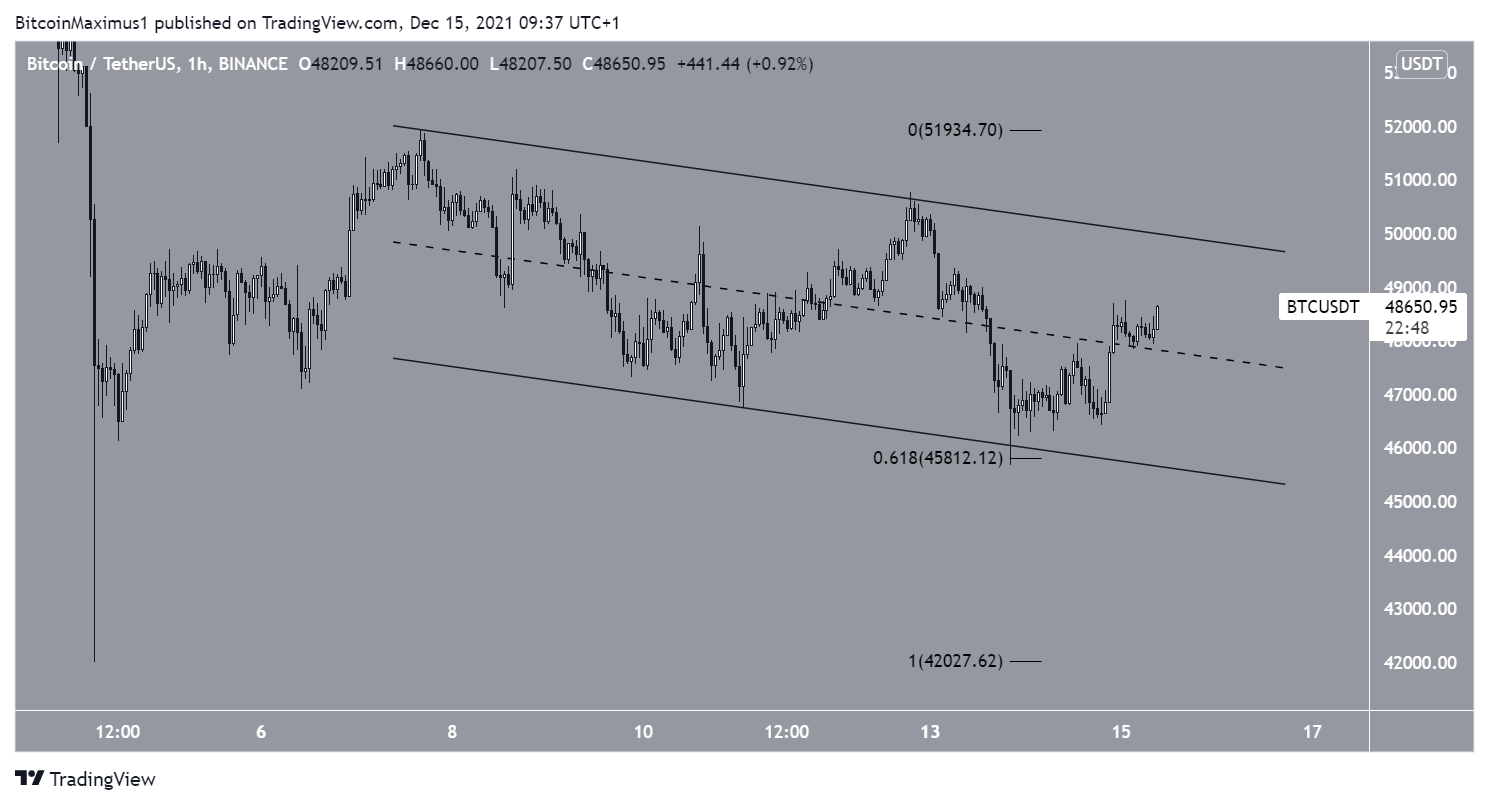
The hourly chart shows another descending parallel channel that BTC is also in the process of breaking out from.
More importantly, it made a higher low on Dec 14 at the $45,810 support. This is both the 0.618 Fib retracement support level and the support line of the channel.
Since it’s now in the upper portion of the channel, a breakout from the channel appears to be the most likely scenario.
Wave count
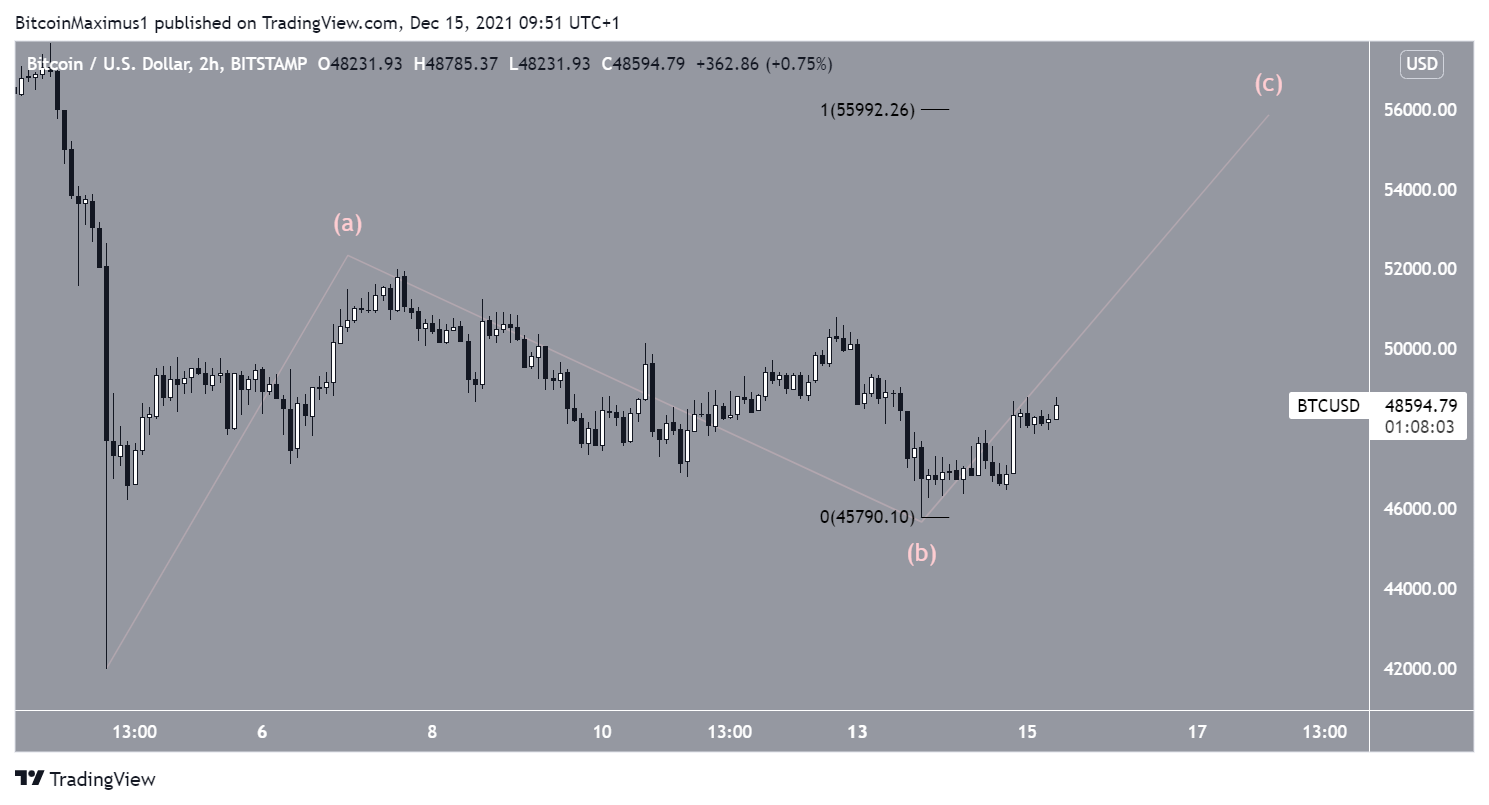
The long-term count indicates that BTC is correcting inside a large B wave.
If correct, BTC is currently in sub-wave C, which is likely to cause the proposed breakout.
If sub-waves A:C have a 1:1 ratio, which is common in such patterns, BTC could reach a high near $56,000. This would be inside the previously outlined resistance levels.
For BeInCrypto’s latest Bitcoin (BTC) analysis, click here
