

Bitcoin (BTC) regained its footing after a sharp drop on Sept 7 and rebounded after reaching the $44,000 support area the next day.
Despite the short-term bounce, longer-term indicators are starting to warn of a potential bearish trend reversal.
Ongoing BTC bounce
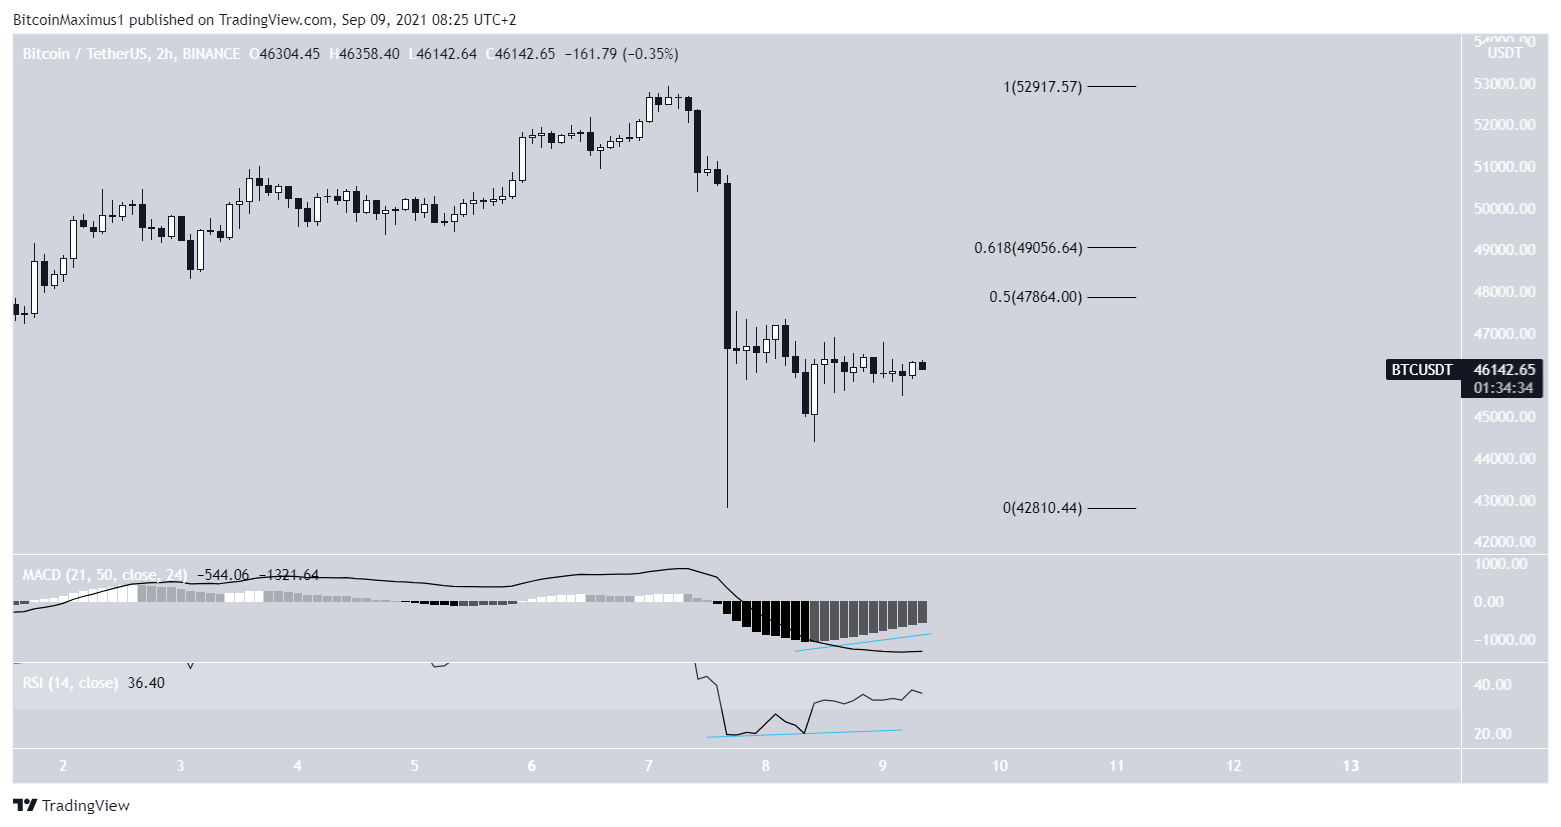
BTC fell sharply on Sept 7, after reaching a local of $52,920. The drop caused it to fall to a low of $42,483. However, a strong bounce followed the same day, creating a very long lower wick (green).
The drop validated the $44,000 horizontal area and the Supertrend line (green) as support.
Even though BTC has bounced, technical indicators are firmly bearish. The MACD has fallen into negative territory and the RSI is below 50 (red icon). The movement of the latter above 50 was a signal for the entire upward move that began on July 20.
Therefore, while the price action looks bullish, still showing a potential bullish retest, technical indicators remain bearish.

Future movement
The two-hour chart is now showing signs of a short-term reversal. The MACD has given a bullish reversal signal and the RSI is moving upwards after generating a bullish divergence.
If the bounce continues, the closest resistance area would likely be found between $47,850 and $49,050. These targets are the 0.5-0.618 Fib retracement resistance level when measuring the entire downward move.
Wave count
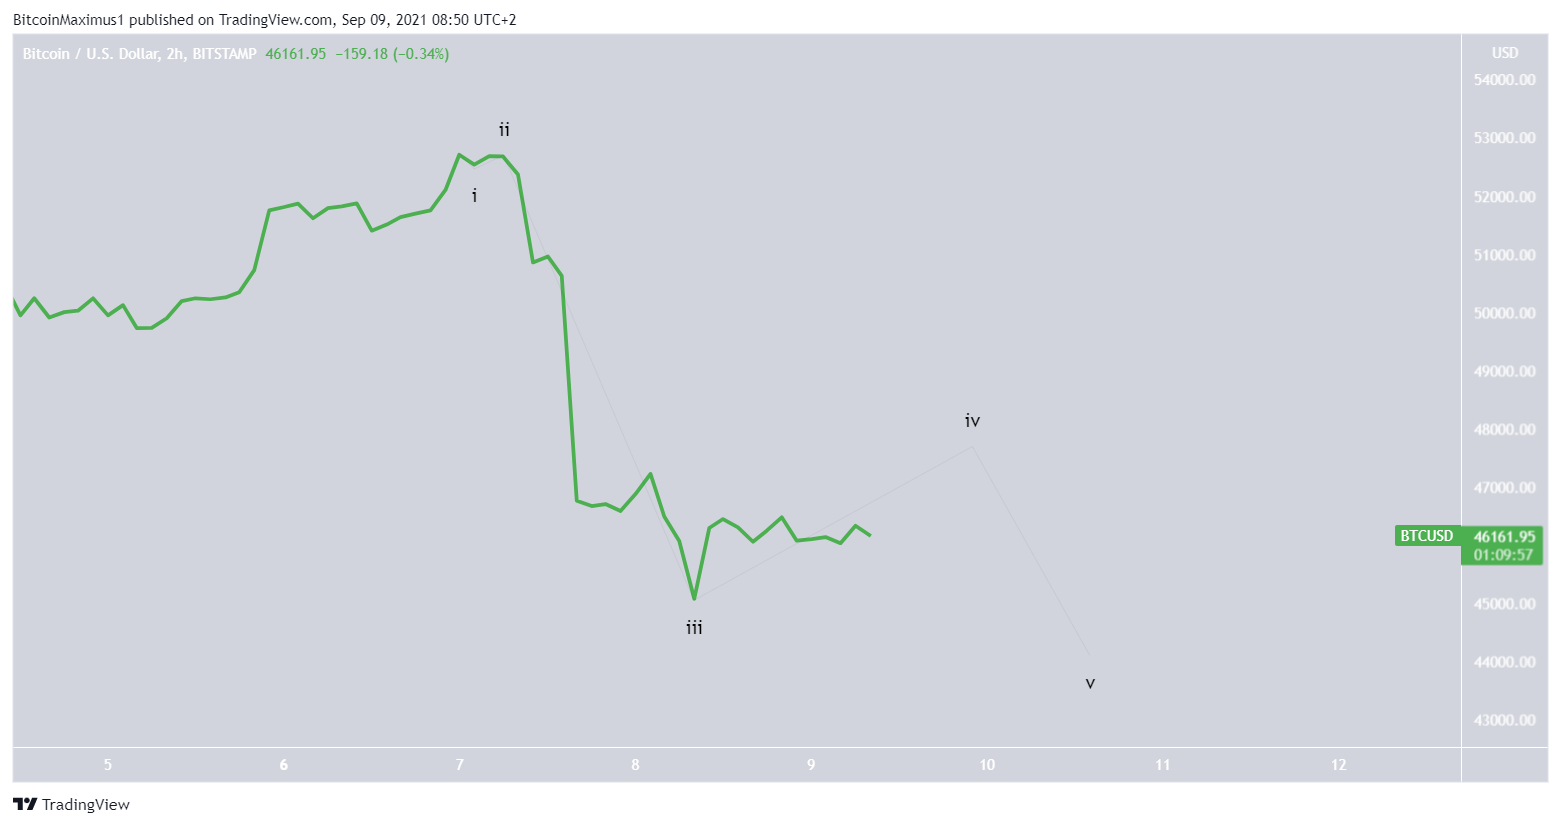
Due to the sharp drop and rebound, we can use the line chart to get a sense of the short-term wave count.
The short-term count suggests that BTC has completed wave three and is now correcting upwards inside wave four.
The move is likely to take it towards the aforementioned $47,850-$49,050 resistance area
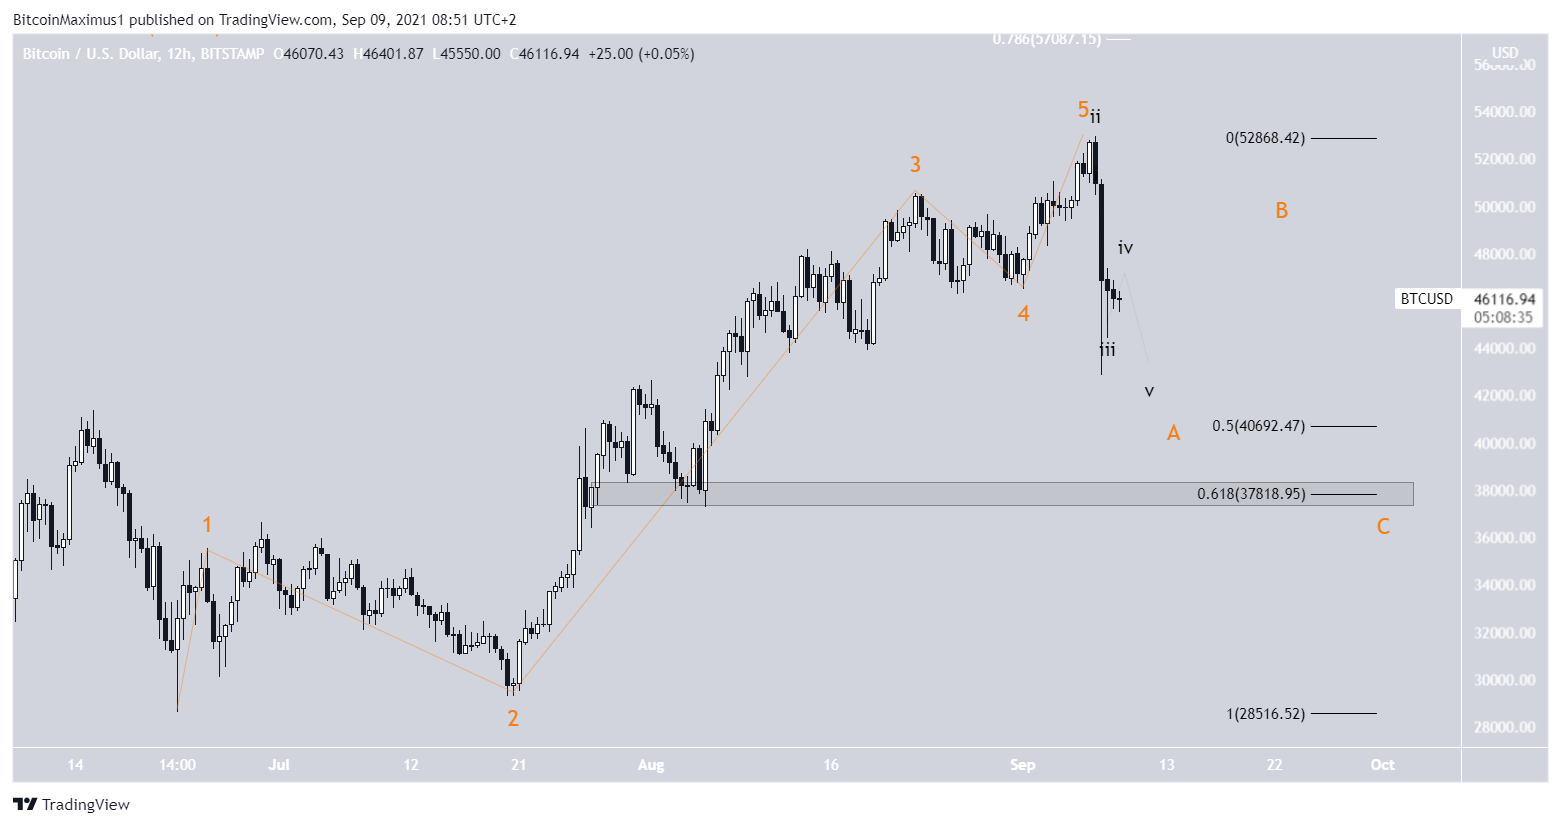
In the longer term, this would complete the A wave of an A-B-C corrective structure.
While the exact bottom of wave C cannot yet be determined, both the bearish and bullish long-term counts indicate that a short-term drop is expected to happen first.
For BeInCrypto’s previous Bitcoin (BTC) analysis, click here.
Disclaimer
In line with the Trust Project guidelines, this price analysis article is for informational purposes only and should not be considered financial or investment advice. BeInCrypto is committed to accurate, unbiased reporting, but market conditions are subject to change without notice. Always conduct your own research and consult with a professional before making any financial decisions. Please note that our Terms and Conditions, Privacy Policy, and Disclaimers have been updated.
