
The Bitcoin (BTC) price decreased considerably on Jan. 21 and briefly dropped to a local low of $28,800 in the early hours of Jan. 22.
Despite the drop, it’s likely that at least the first leg of the corrective movement is done. Bitcoin will likely increase in the short/medium-term.
Bitcoin Bounces at Support
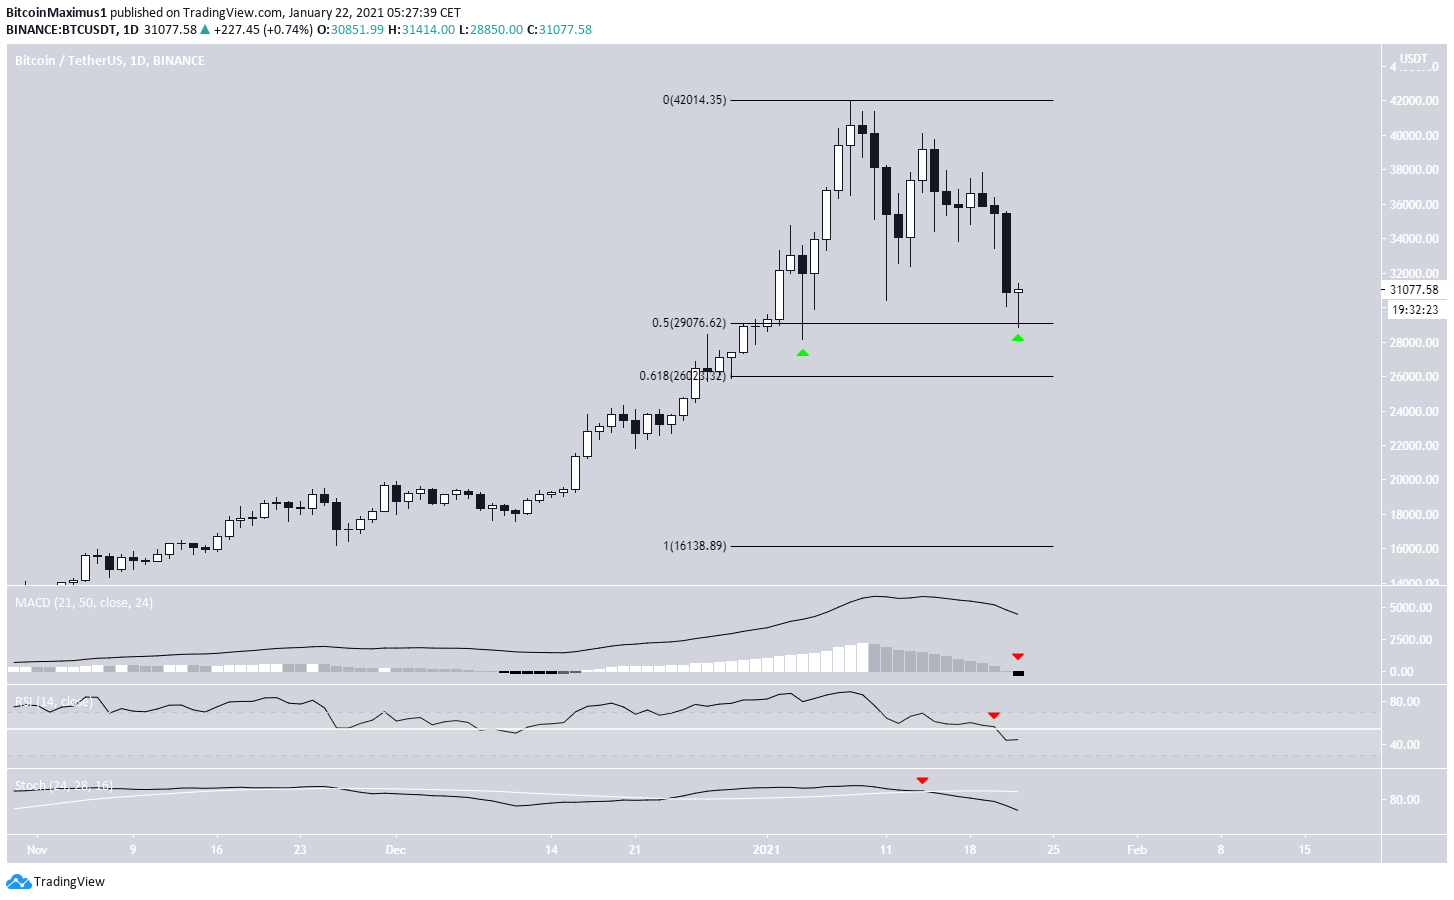
Bitcoin decreased by more than $5,000 yesterday, dropping from a high of $35,600 to a low of $30,000.
While the descent initially resumed on Jan. 22, BTC bounced at the 0.5 Fib retracement level at $29,000 and is in the process of creating a bullish candlestick with a long lower wick.
Despite the bounce, technical indicators are firmly bearish.
The MACD has crossed into negative territory, the daily RSI has crossed below 50, and the Stochastic oscillator has made a bearish cross.
If BTC were to lose the $29,000 support area, the next would be found at $26,000 (0.618 Fib retracement level).
BTC Wave Count
As outlined in yesterday’s BeInCrypto Bitcoin analysis,
“A breakdown from the $34,000 support area and the symmetrical triangle would likely confirm that BTC is heading lower, possibly toward $29,000.”
Yesterday’s breakdown took BTC to the 0.5 Fib level at $29,000 and gave waves X:Y (orange) a 1:1 ratio in the process.
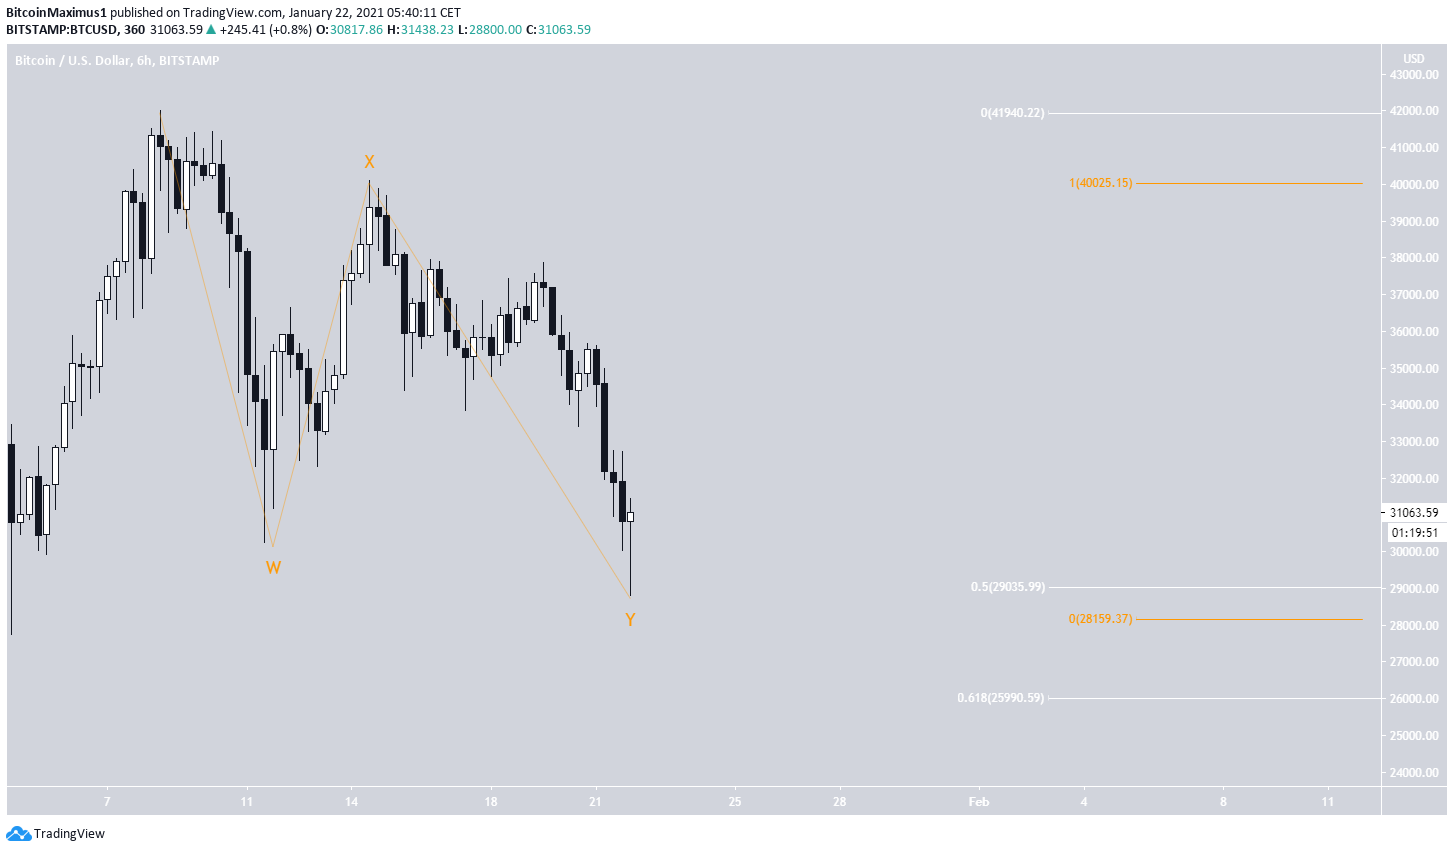
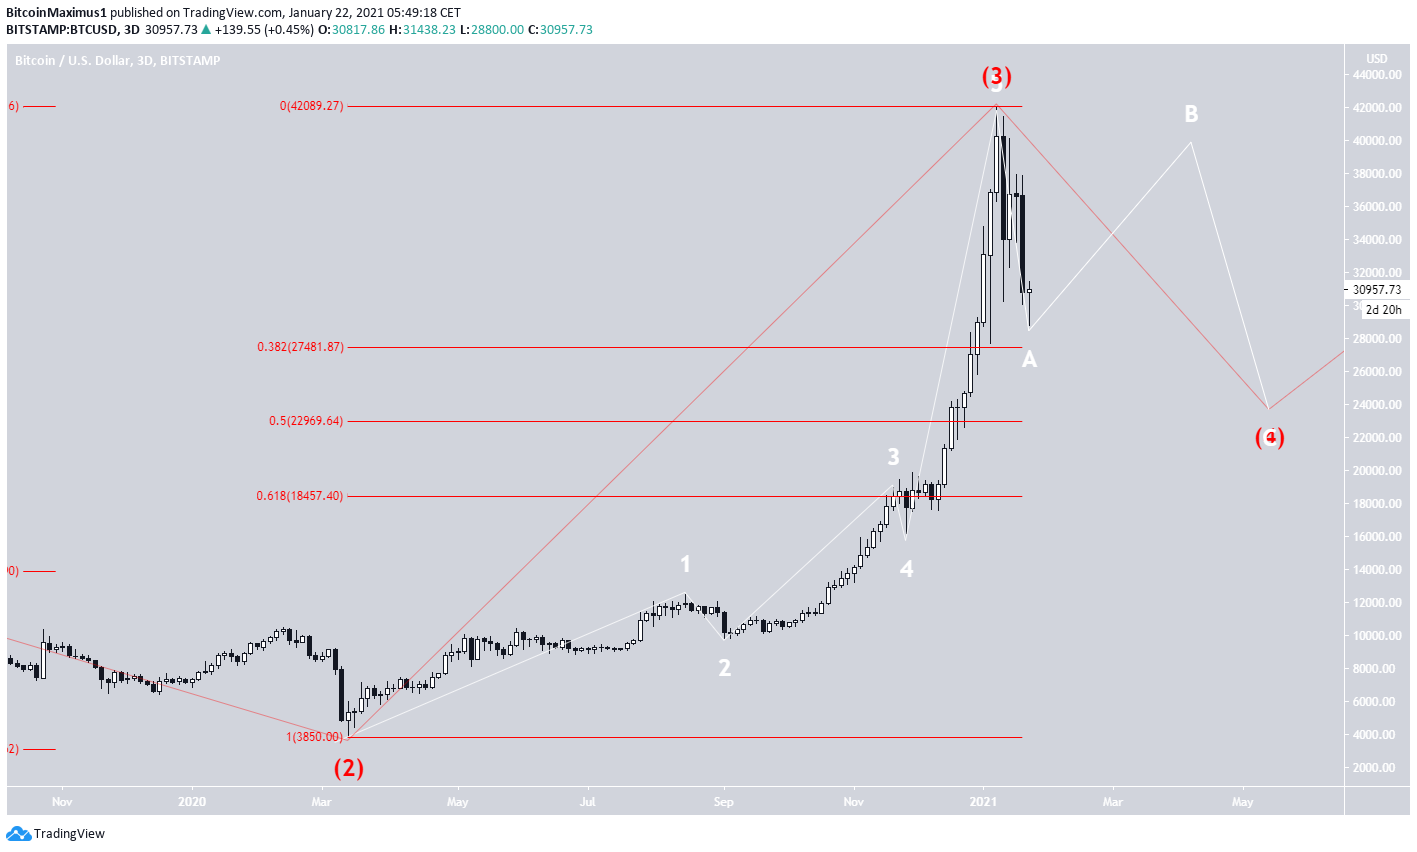
Nevertheless, the long-term count is still bearish, so it’s more than likely that this is only the first part of the corrective structure.
This would mean that BTC will head lower eventually, most likely towards $22,969 (0.5 Fib retracement level).
However, there are numerous possible patterns this move can take, so it seems futile to hypothesize which will be correct. Nevertheless, a significant bounce is likely prior to the eventual resumption of the downward trend.
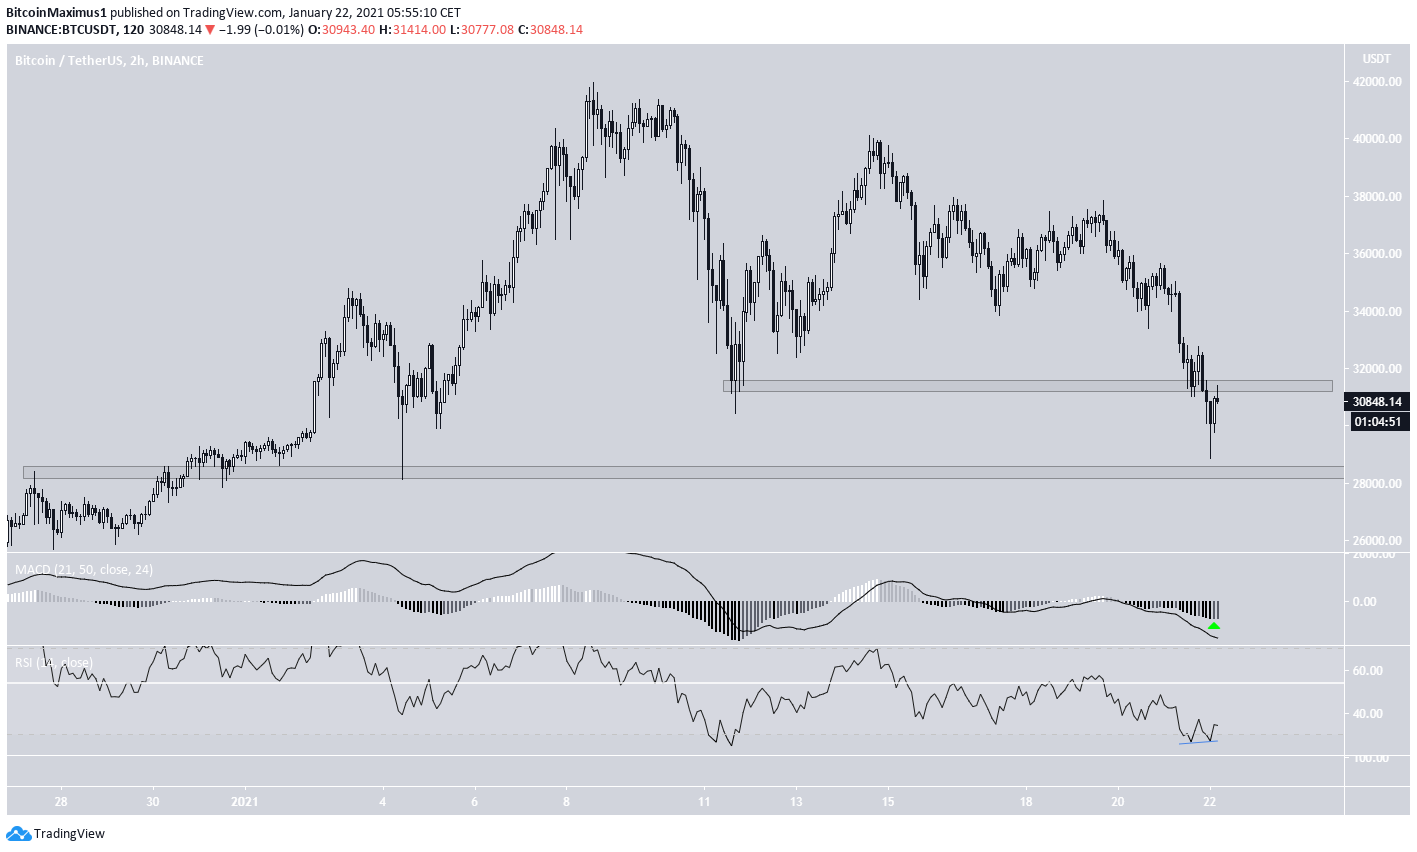
Short-Term Movement
The short-term chart shows that while there are early signs of a bullish reversal, as evidenced by the bullish divergence in the RSI, the reversal is not yet confirmed.
Reclaiming the $31,400 area would likely confirm that the reversal has begun and that BTC will head higher.
Furthermore, there is strong support at $28,200. So even if BTC gets rejected and makes a slightly lower low, it would be expected to bounce at this level.
Conclusion
It’s likely that Bitcoin has completed the first leg of a corrective structure and will now begin a significant bounce. A reclamation of the $31,400 level would help to confirm this.
For BeInCrypto’s latest Bitcoin (BTC) analysis, click here!
