


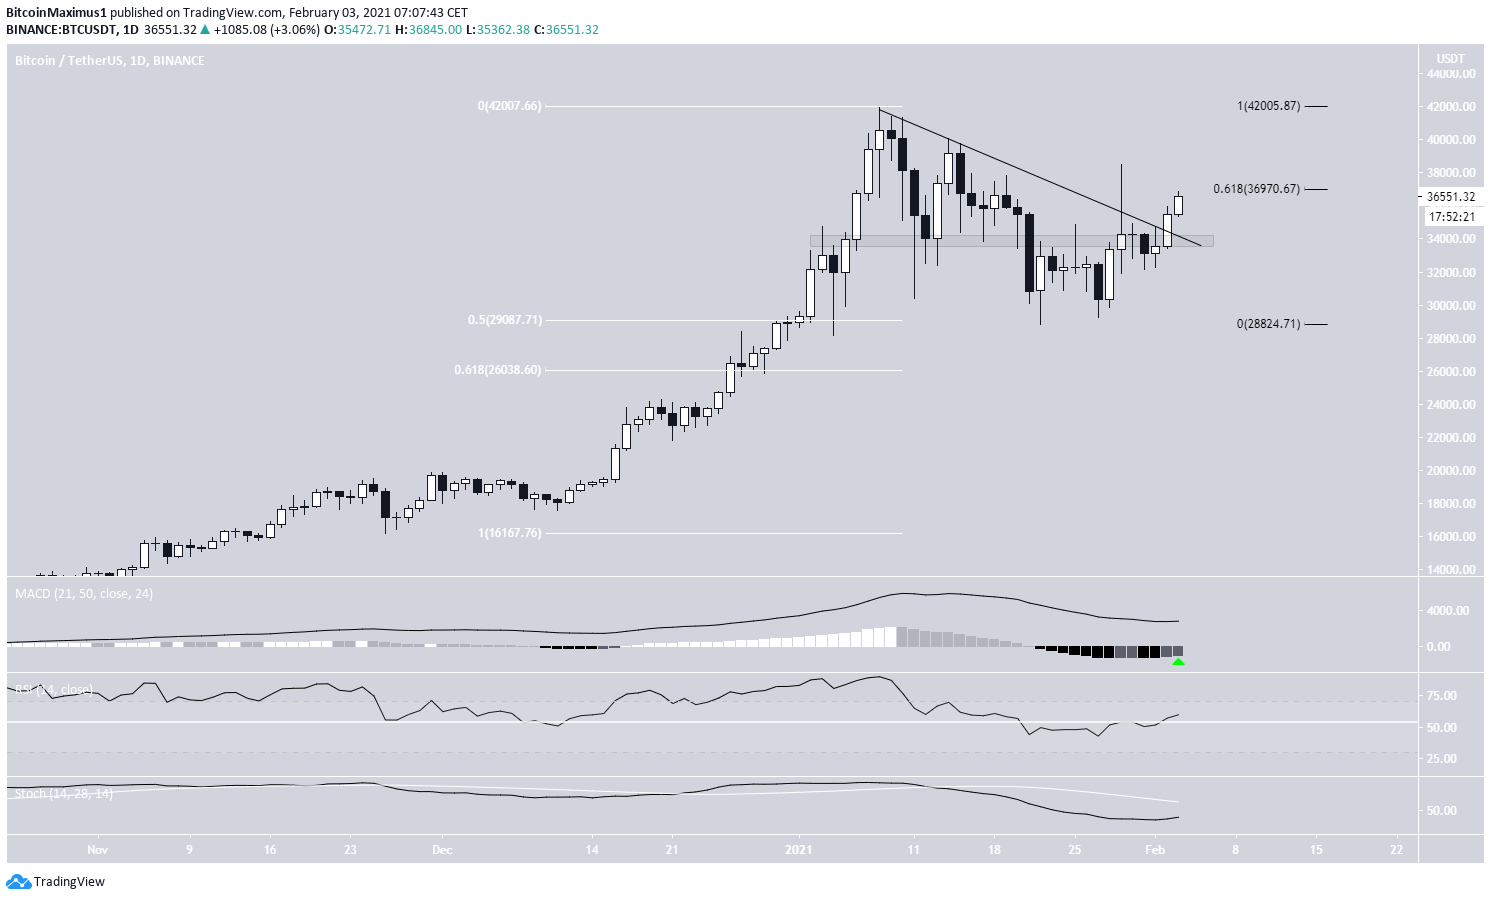
Bitcoin (BTC) broke out from a descending resistance line that had been in place since the Jan. 8 all-time high price.
Despite this, neither technical indicators nor the wave count confirms a bullish Bitcoin trend. Rather, they suggest that another decrease is in store.
Bitcoin Breaks Out
Bitcoin was rejected multiple times by the descending resistance line but finally managed to successfully break out on Feb. 2, reaching a close significantly above it. With this movement, BTC also moved above the $34,000 resistance area.
However, technical indicators have yet to confirm the bullish movement, and BTC is trading very close to the 0.618 Fib retracement resistance at $37,000. Therefore, it’s not yet confirmed that BTC is in a bullish trend.
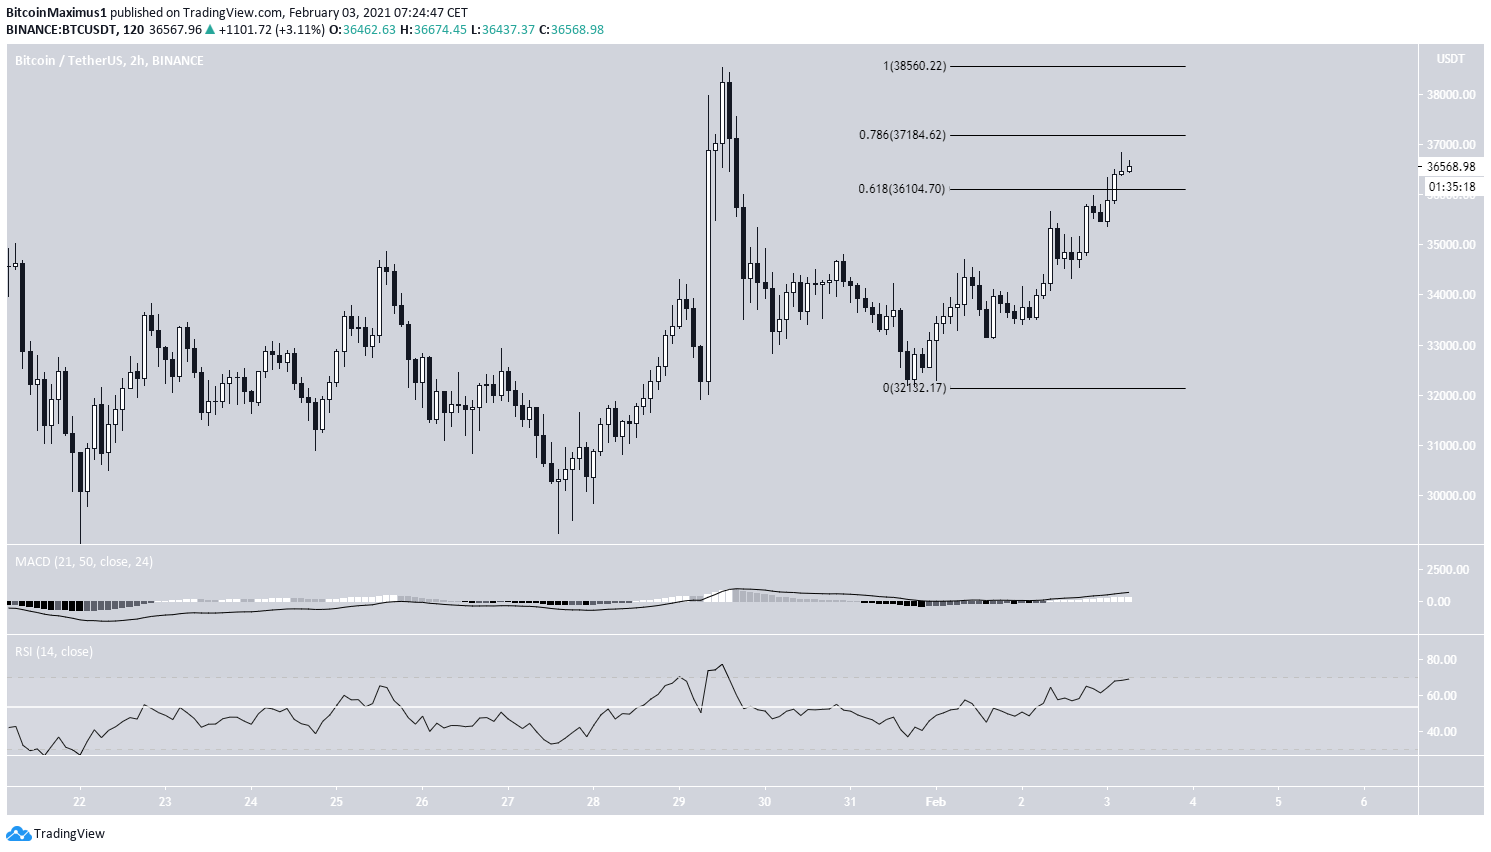
The two-hour chart provides a similar outlook.
While technical indicators have turned bullish, BTC is trading inside a resistance area that is ripe for a reversal and often acts as the top for corrective movements.
The resistance area is found between $36,100-$37,200 (0.618-0.786 Fib retracement levels).
BTC Wave Count
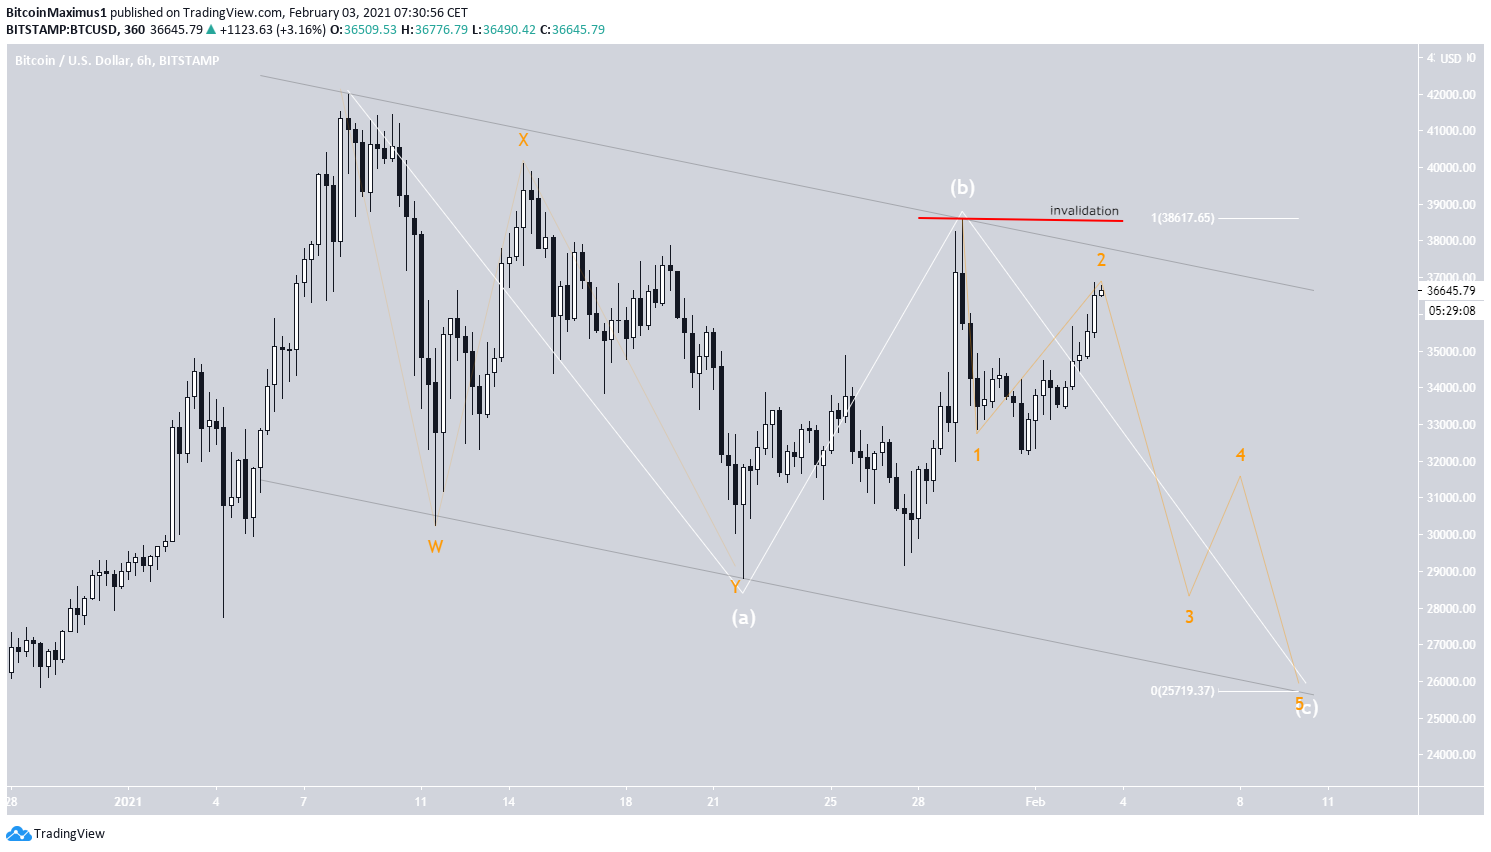
The wave count indicates that BTC is in the C wave of an A-B-C corrective structure (shown in white below) which could take it to a low of $25,700.
An increase above the Jan. 29 high of $38,620 (red line) would invalidate this particular wave count.
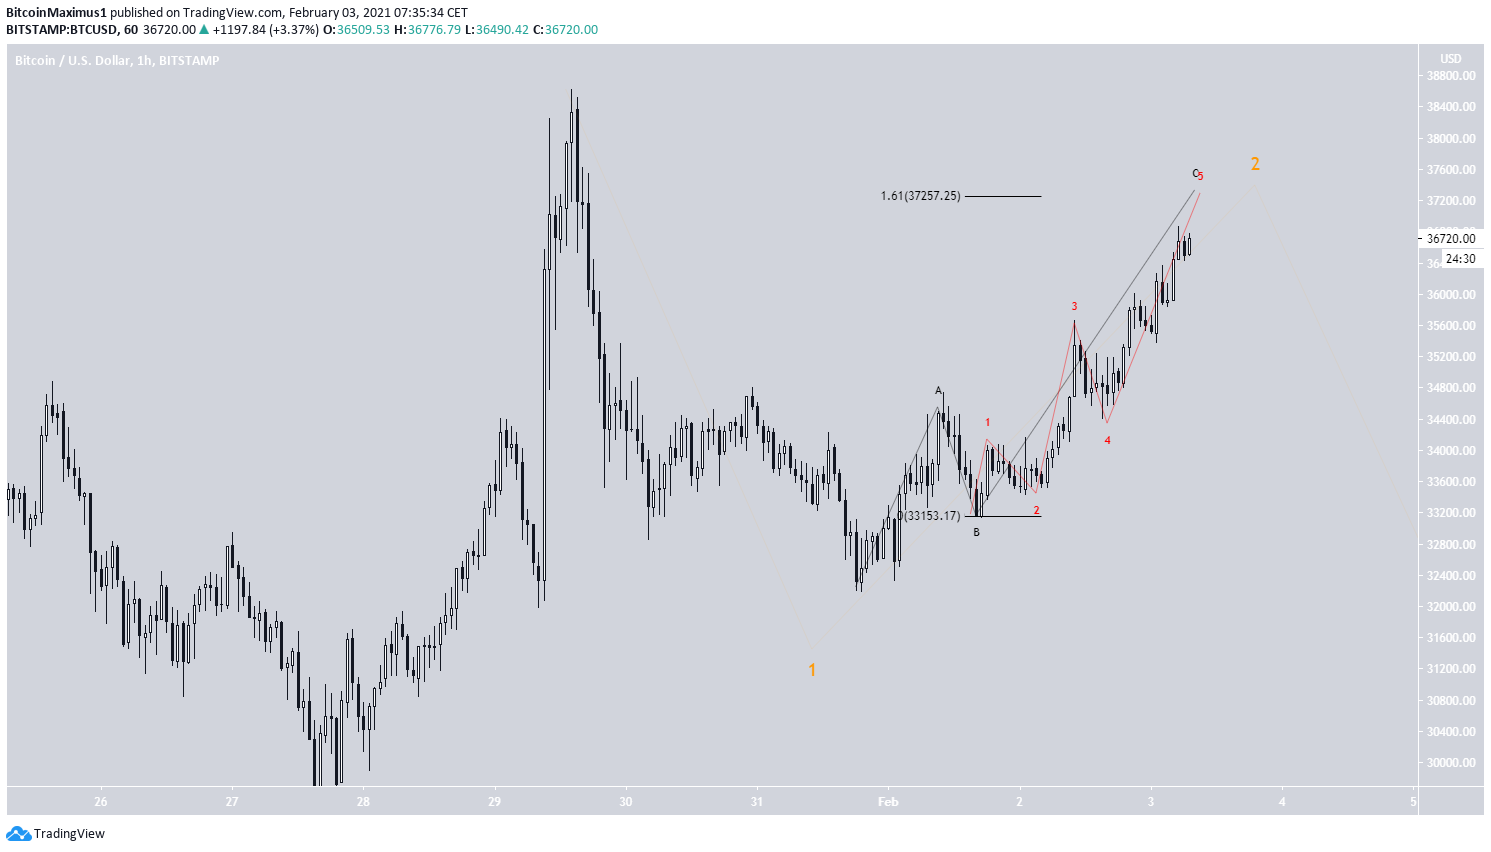
The sub-wave count is shown in orange and suggests that BTC is nearing the top of sub-wave 2.
A closer look at the second sub-wave confirms this possibility, giving a possible target of $37,257 for the top of the move. This target also coincides with the 0.786 Fib retracement resistance from the previous section.
Conclusion
Despite yesterday’s breakout, it’s not confirmed that the BTC trend is bullish. On the contrary, it’s still likely that BTC makes a move higher to $37,200 before breaking down.
For BeInCrypto’s previous Bitcoin (BTC) analysis, click here


