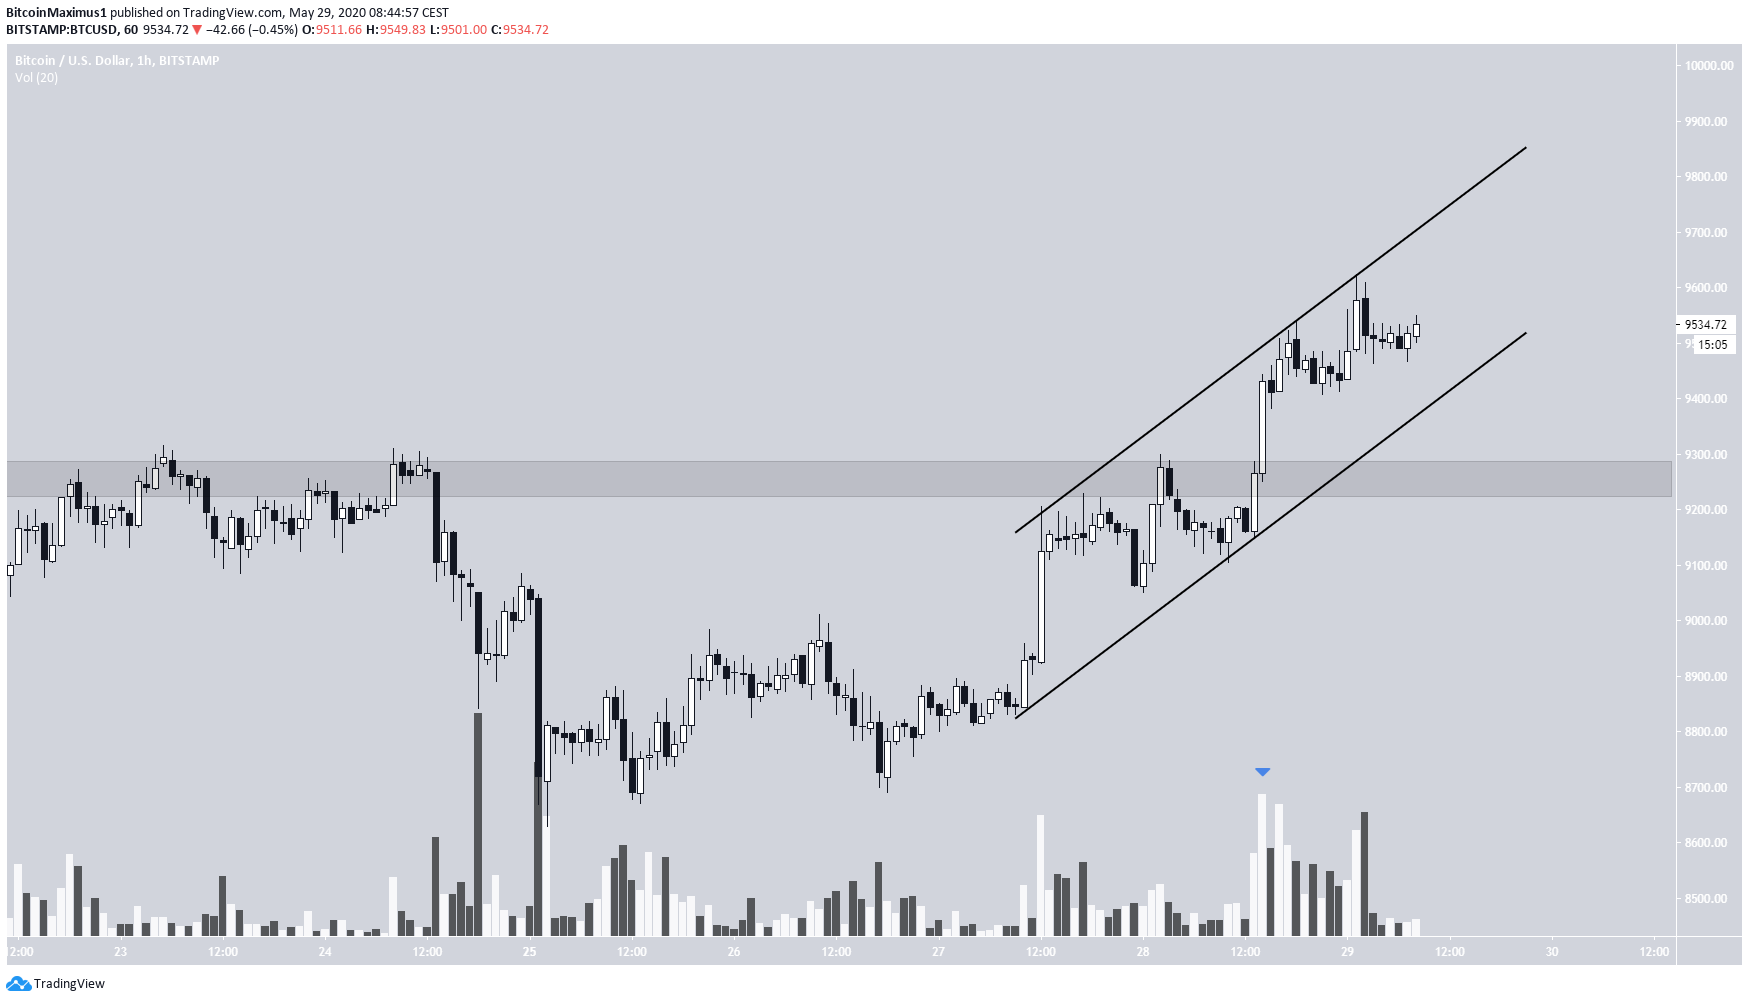
The Bitcoin price has been increasing since May 25. The rate of increase accelerated on May 27, and the price has been trading inside a steep ascending channel since.
On May 28, the Bitcoin price broke out from the $9,250 resistance area, doing so with significant volume. It looks as if the price is trading inside a parallel ascending channel, currently being in the middle of the channel.
While the support line has not been validated sufficiently, it can be estimated by drawing a line parallel to the resistance line, which currently is at $9,400.
Bitcoin Ascending Channel
As long as the price is trading inside this channel, it is expected to move upwards. While volume was considerable during the breakout, it was even higher during the recent rejection from the resistance line, allowing for the possibility that the price will eventually break down.
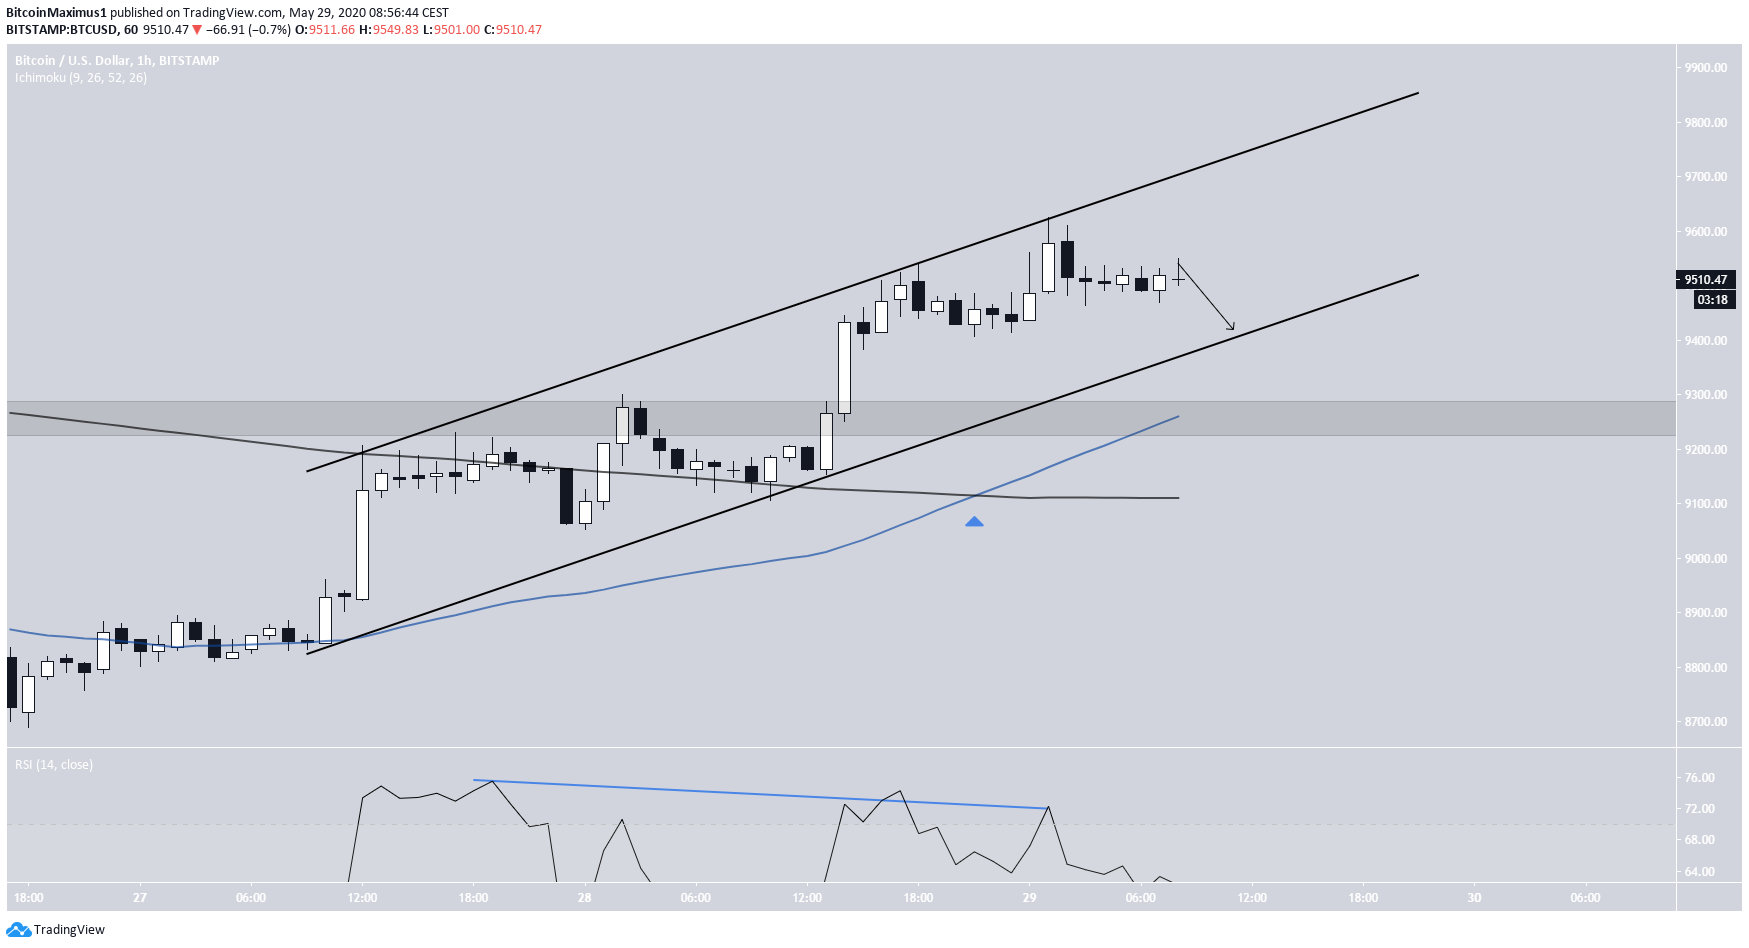
Technical indicators are undecided. While a bullish cross has transpired between the 50 and 200-hour moving averages (MA), there is a growing bearish divergence in the RSI. This suggests that the price is likely to drop to the support line of this channel, possibly finding support above the 50-hour MA, which is moving upwards.
However, whether BTC breaks out or breaks down from this pattern remains unclear.
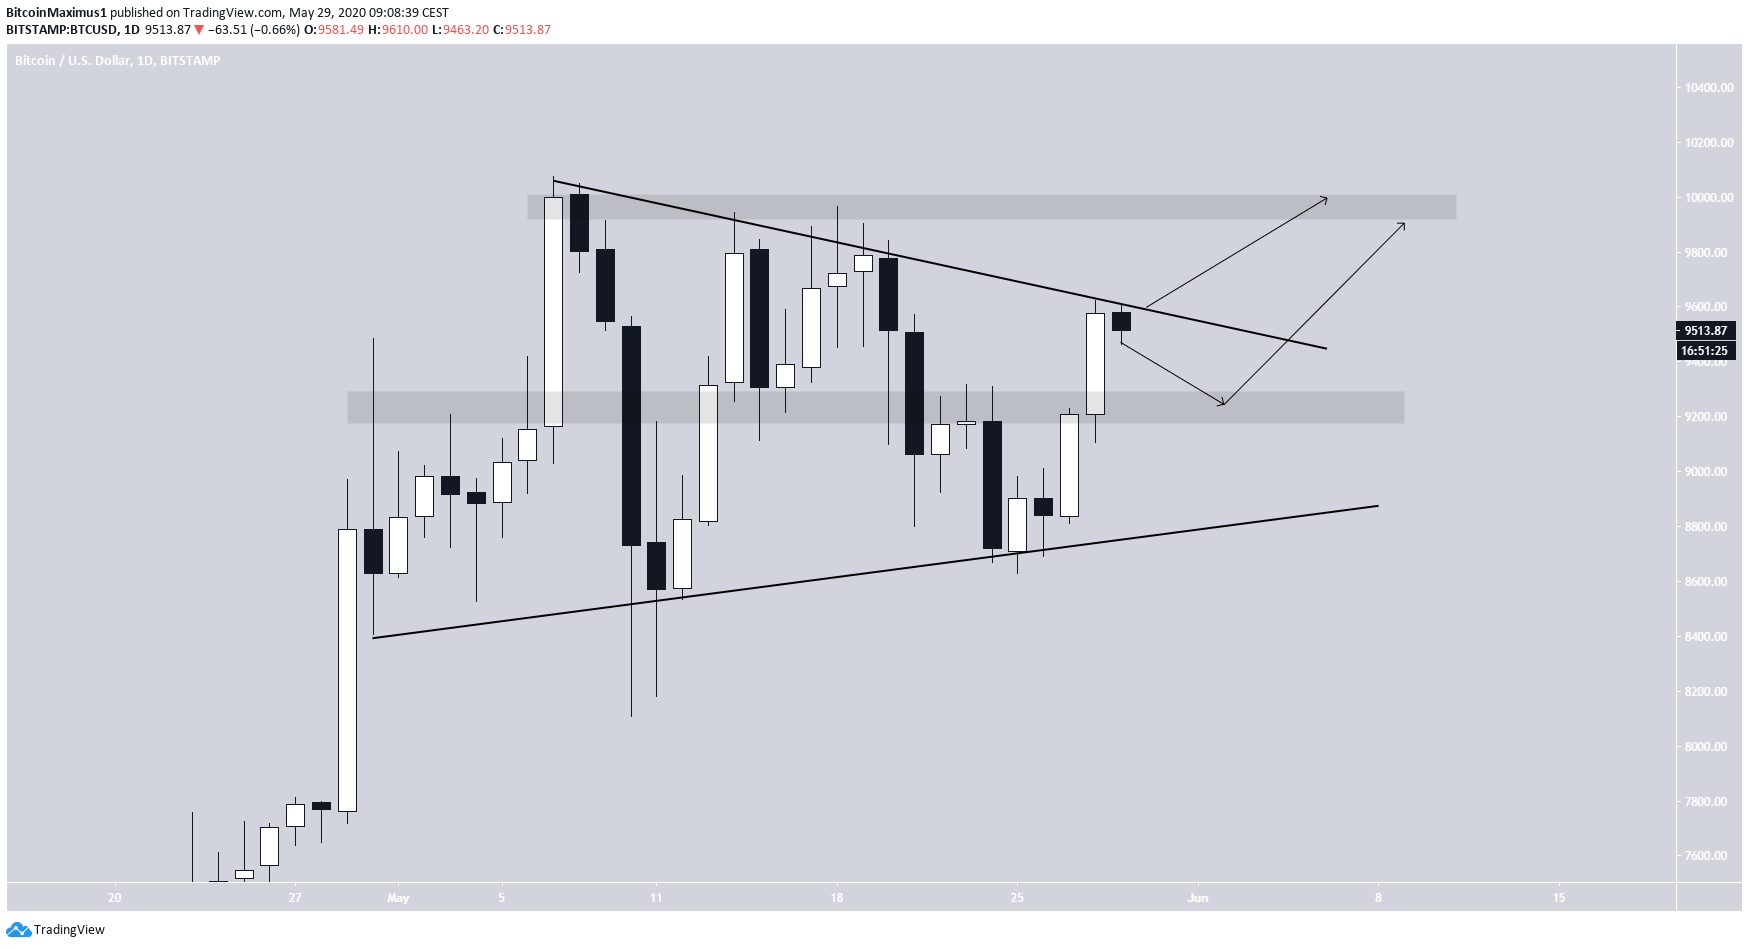
Symmetrical Triangle
In the longer-term, it seems that the Bitcoin price has been trading inside a symmetrical triangle since April 30. At the time of writing, it was trading directly under the resistance line of this triangle.
Even though the triangle is considered a neutral pattern, it is transpiring after an upward move, therefore a breakout is expected.
However, since the short-term chart reveals some weaknesses, we could see a decrease that validates the $9,250 area as support, before the price eventually breaks out.
If the price breaks out, the closest resistance area would be found at $10,000.