
On Jan. 6, Bitcoin (BTC) reached a new all-time high of $35,879.
Despite some weakness in lower time-frames, Bitcoin is expected to continue increasing toward $39,000.
Another Bitcoin All-Time High
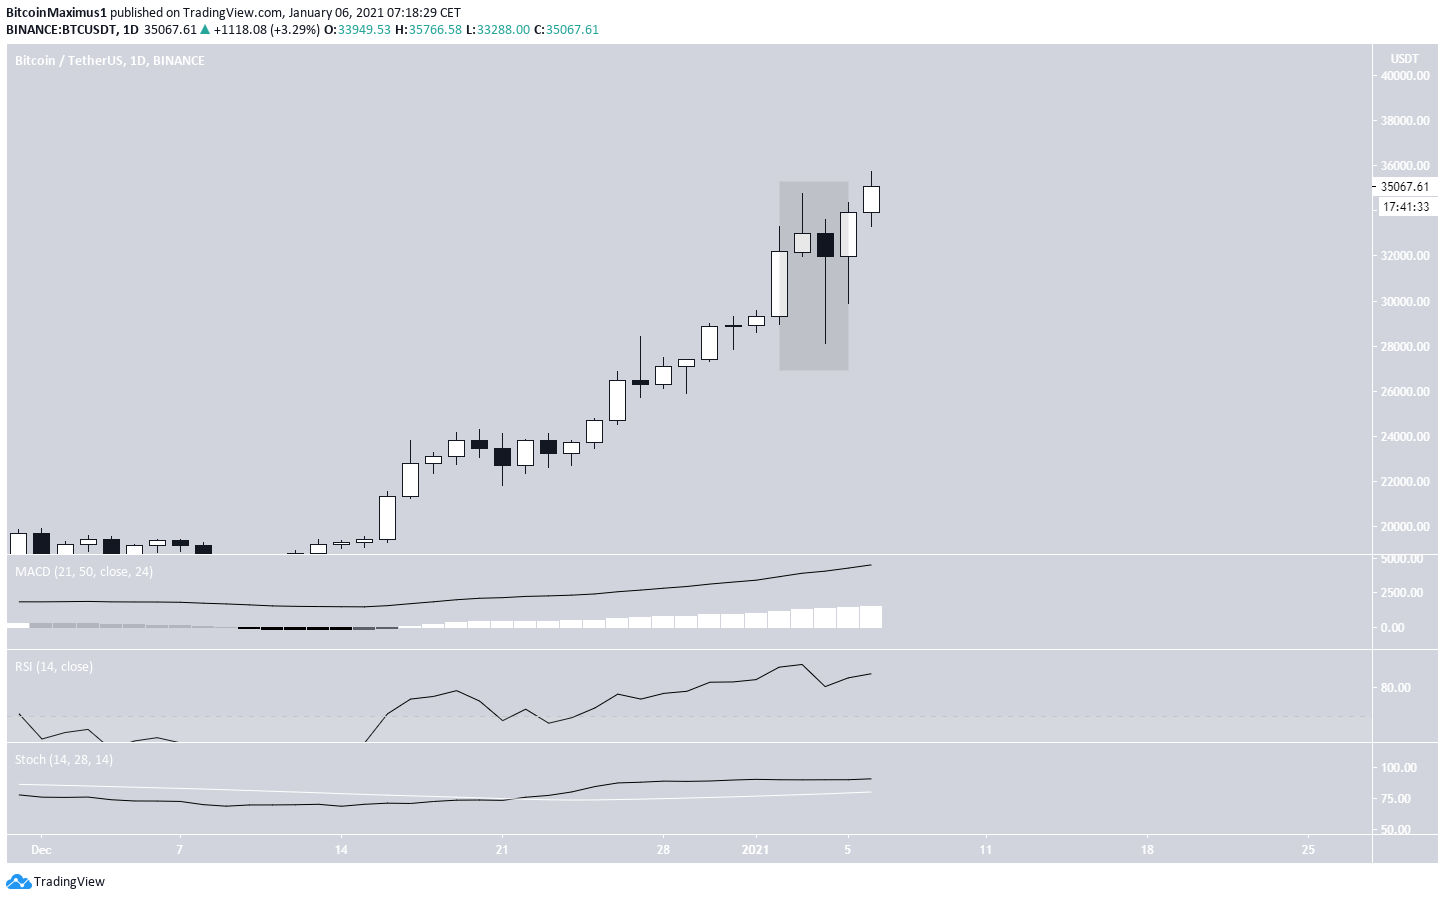
On Jan. 3 and 4, BTC created two successive bearish candlesticks, a shooting star and a hanging man. These are normally considered bearish reversal signals when found in an upward trend. These indicators suggest that BTC is likely to decrease.
However, the bearishness was invalidated with a bullish candlestick yesterday, which nearly broke the previous highs.
On Jan. 6, BTC reached yet another new all-time high of $35,879.
In the daily time-frame, technical indicators have yet to show any signs of weakness.
Lower Time Frames Show Cracks
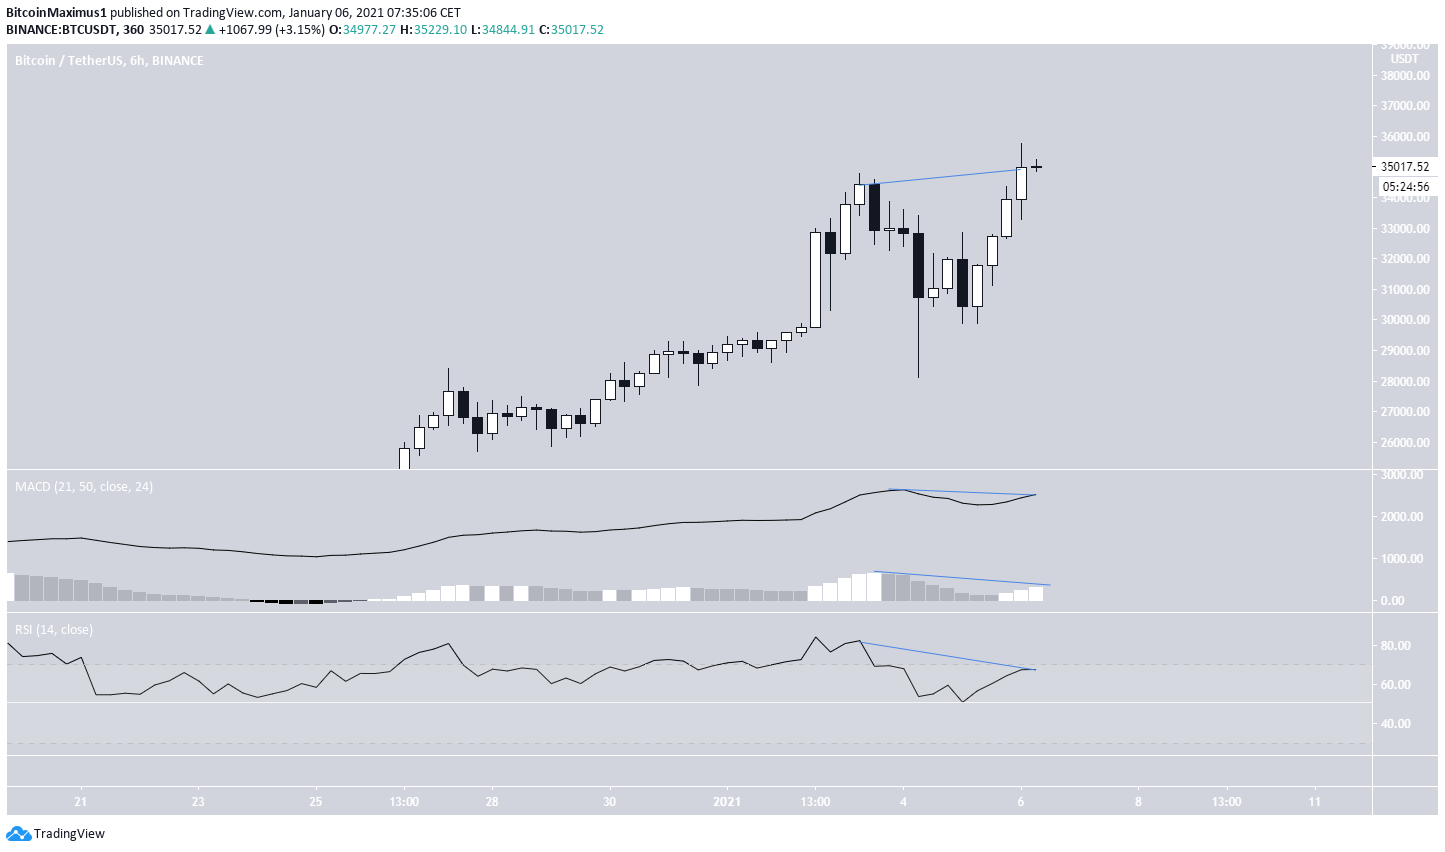
The six-hour chart shows that despite the new high, both the RSI and MACD are showing significant weakness in the form of bearish divergences.
The divergence in the MACD is visible in both the histogram and MACD line. However, the RSI has yet to complete a bearish swing failure.
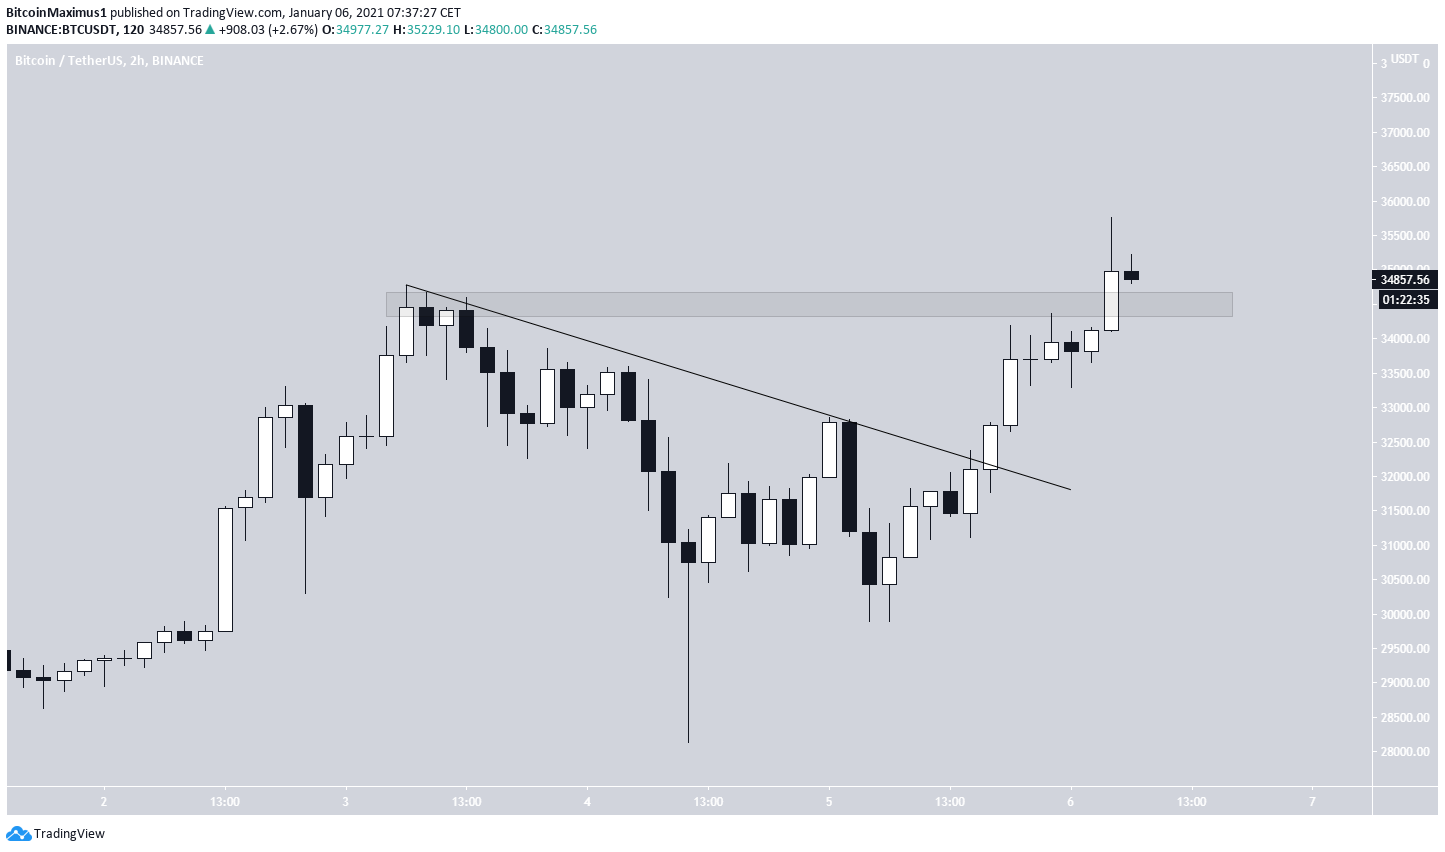
The two-hour chart shows a breakout from a descending resistance line, which was the catalyst for the upward movement.
For BTC to keep increasing, it has to validate the $34,500 area as support and continue trading above it.
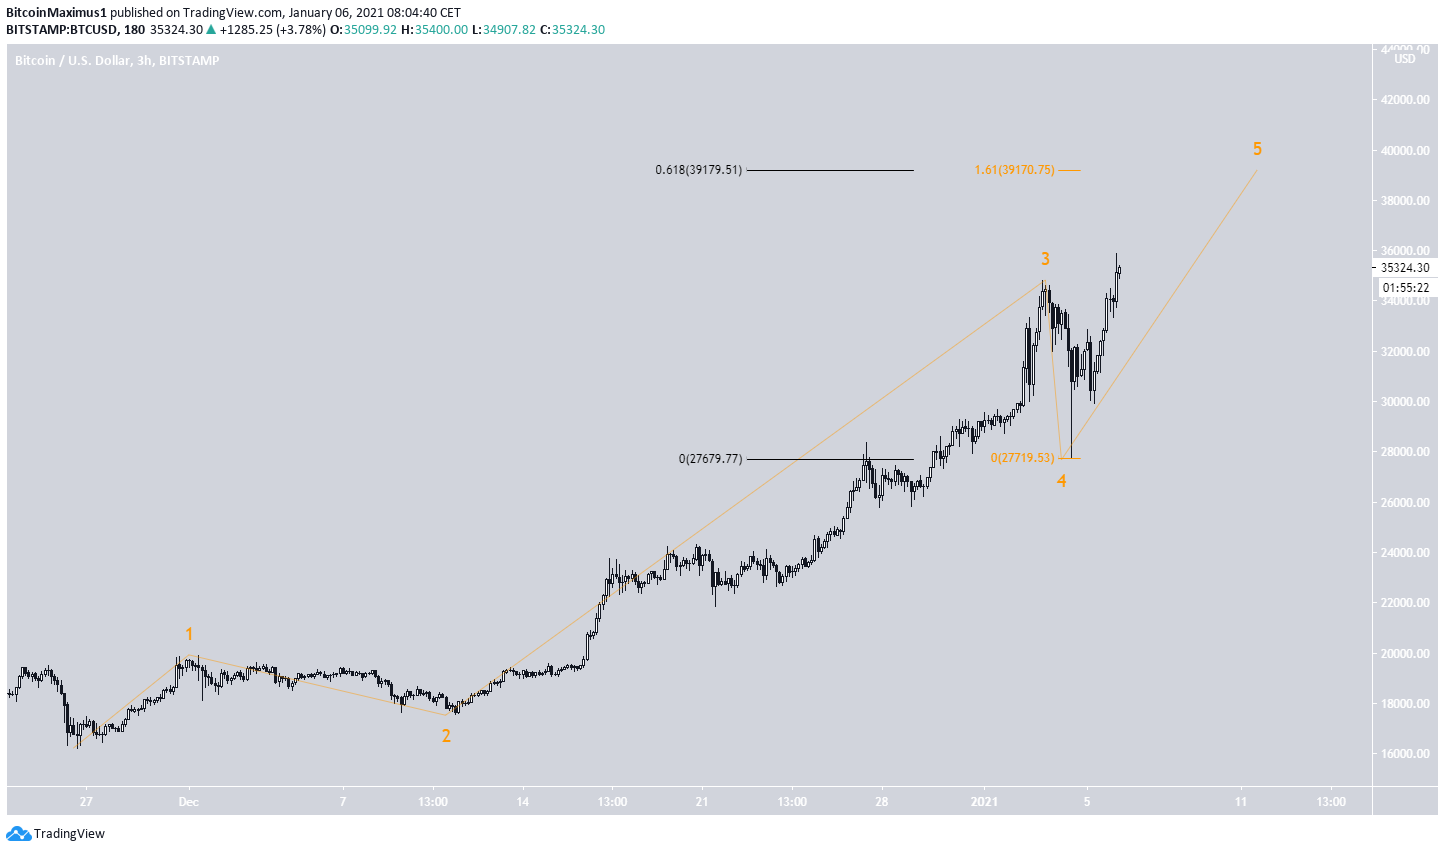
BTC Wave Count
The wave count suggests that BTC is in sub-wave 5 (orange) of wave 5 (blue).
While the rally is extremely overextended and a correction is overdue, yesterday’s movement makes it likely that BTC has one more high to complete before it begins its correction.
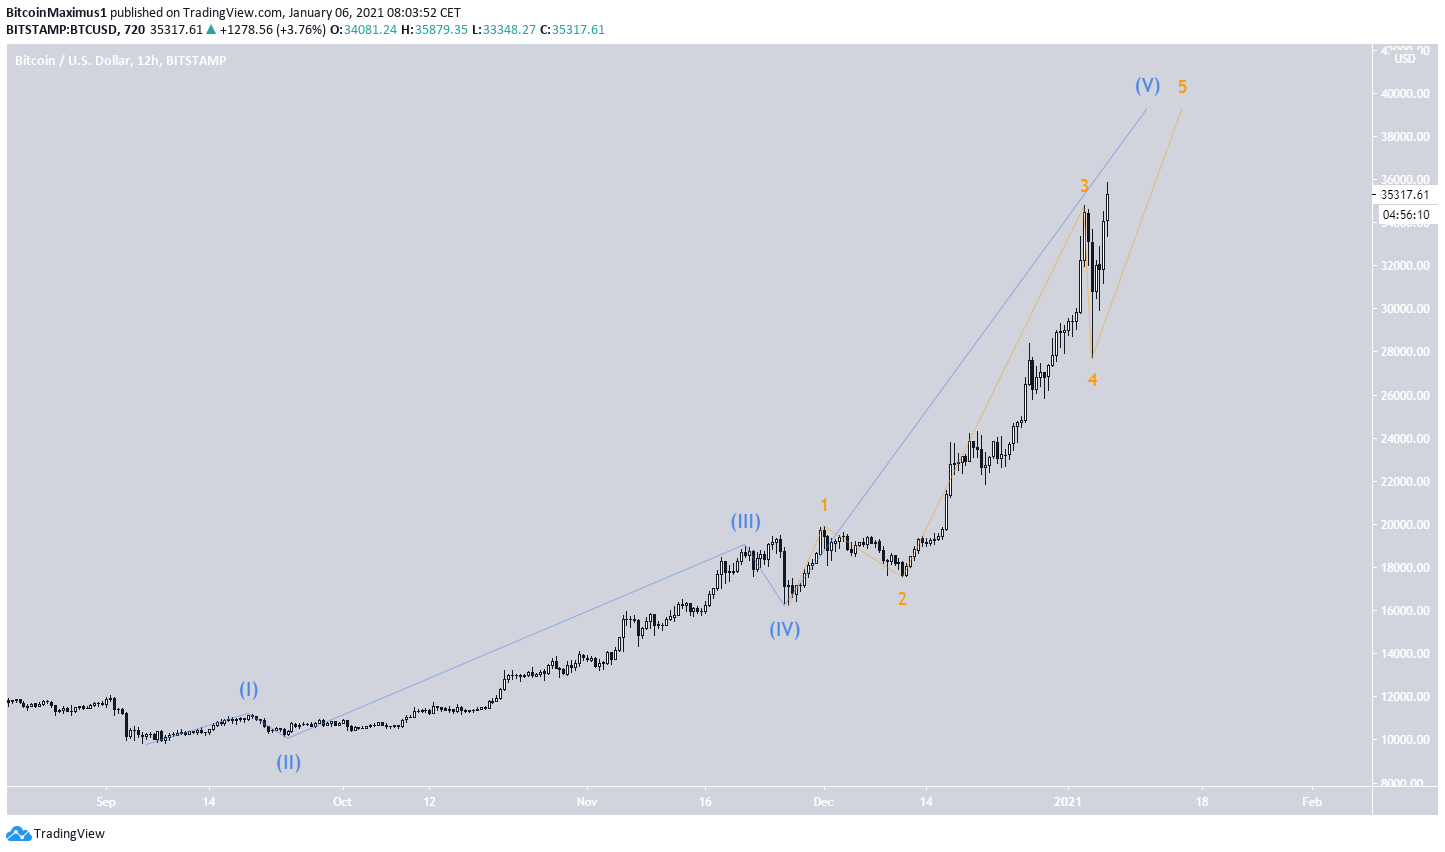
A closer look at the movement gives a target of $39,170, found by projecting the length of waves 1-3 (black) and by using an external retracement on wave 4 (orange).
Conclusion
Bitcoin is expected to continue increasing towards $39,000 before a significant corrective movement likely begins.
For BeInCrypto’s previous Bitcoin (BTC) analysis, click here!
Disclaimer: Cryptocurrency trading carries a high level of risk and may not be suitable for all investors. The views expressed in this article do not reflect those of BeInCrypto.
