


On July 23, the Bitcoin (BTC) price continued its upward move that began with a breakout on July 21.
The strength of the upward move looks intact, even as a short-term retracement is developing.
Bitcoin Meets Resistance
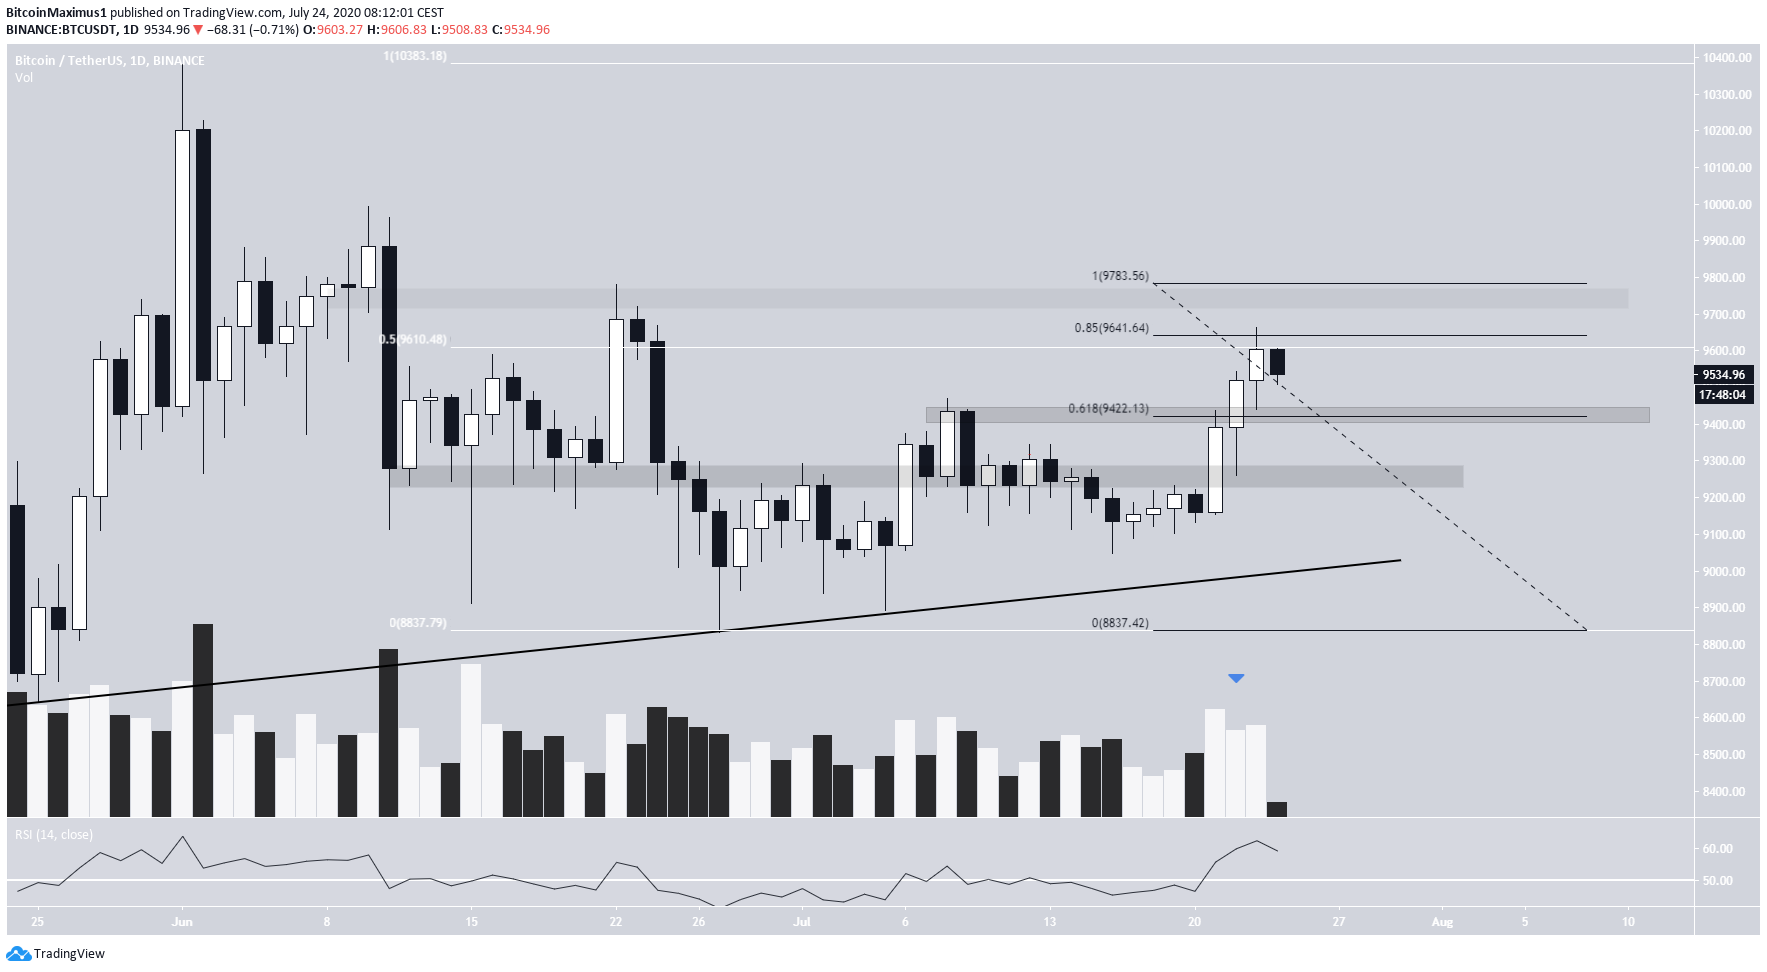
Yesterday, the Bitcoin price created another bullish candlestick that had wicks on both sides. This is the third consecutive bullish candlestick since the breakout on July 21.
The rally seems to have stalled at the 0.5 Fib level of the entire decrease that began on June 1. Using the Fib retracement tool on the most recent decrease, we see that the price has moved slightly above the 0.85 Fib level.
Since this is not a common reversal level, it’s likely that the price will eventually move above the June 22 high of $9,780.
The closest resistance area is found at $9,750, while the closest support area lies near the breakout level at $9,250. There is a minor horizontal support area at $9,420.
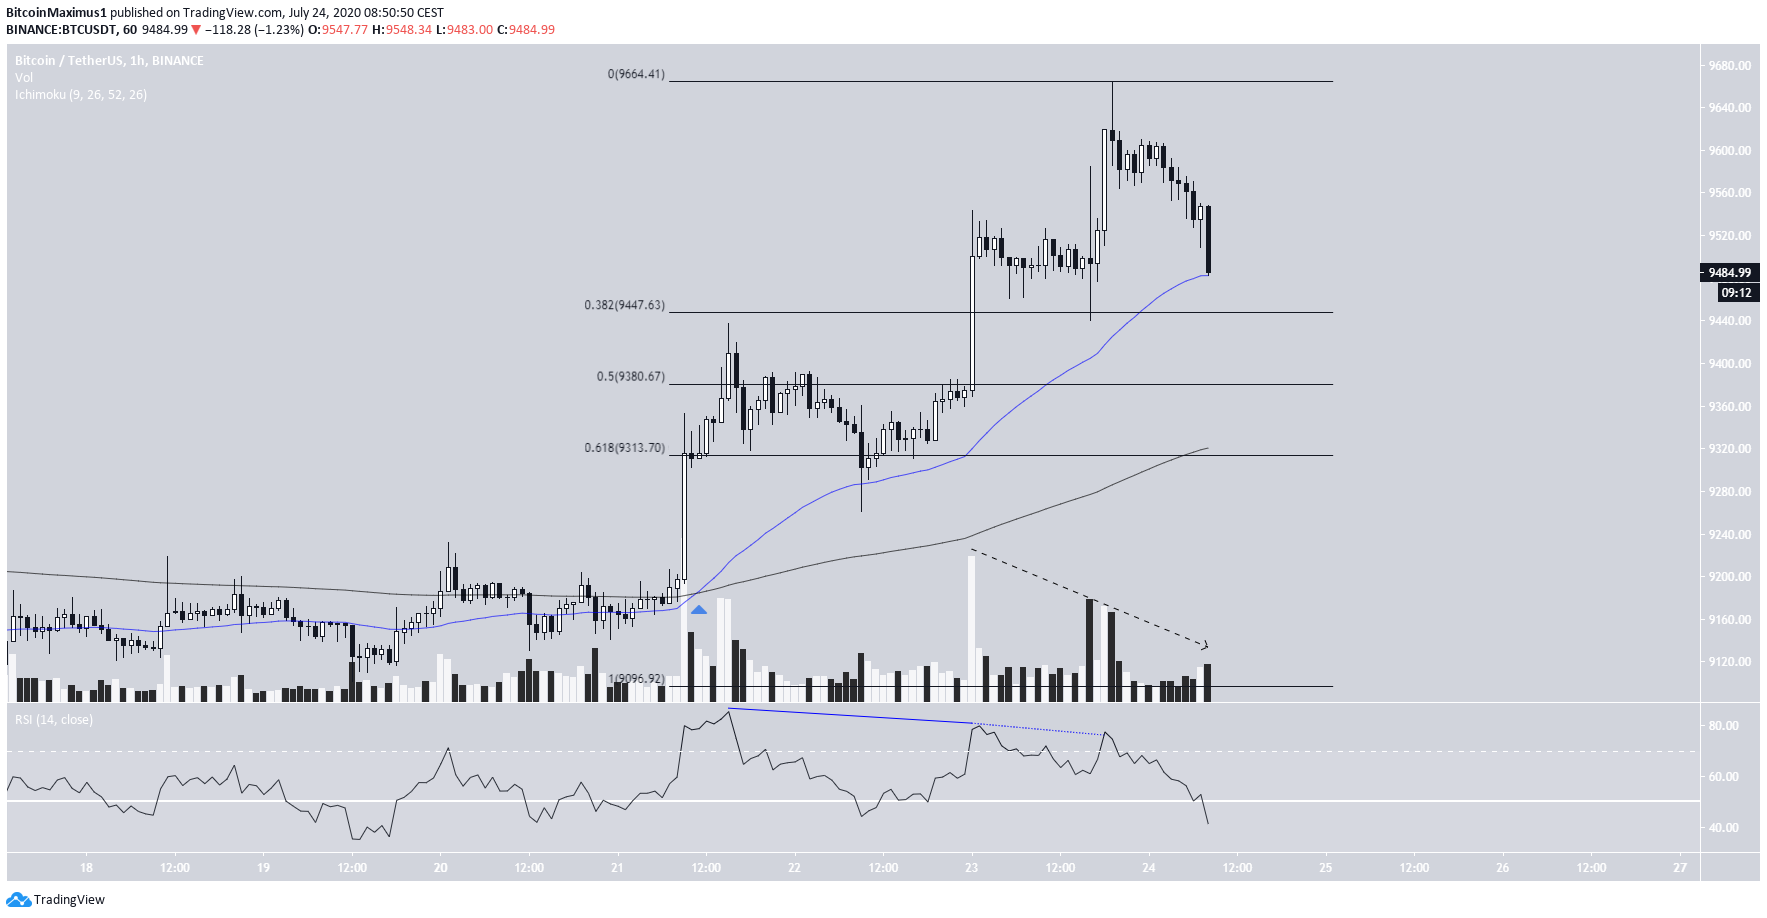
The hourly chart shows that the price has already begun to retrace after generating considerable bearish divergence in the hourly RSI.
While the price has begun to retrace, it seems to have found support above the 50-hour moving average (MA).
The most likely area for a reversal is found between $9,313 and $9,447. The former is the 0.618 Fib level of the recent increase and coincides with the 200-hour MA, while the latter is the 0.382 Fib level.
Volume has been much lower during the decrease, so it’s likely that this is just a retracement rather than the beginning of a new downward trend.
Wave Count
The Bitcoin price has been increasing since July 17. The increase intensified on July 21, indicating that wave-3 has begun.
It seems that yesterday’s high was the top of this third wave, and the price has now begun a correction, currently completing wave A of an A-B-C formation.
The likeliest level for this correction to end would be near the 0.5 Fib level at $9,380, fitting closely with the support from the first section.
Since the second wave correction went deep (0.618 Fib), it would be expected for the current wave to be more shallow, hence a retracement towards the 0.382-0.5 Fib levels.
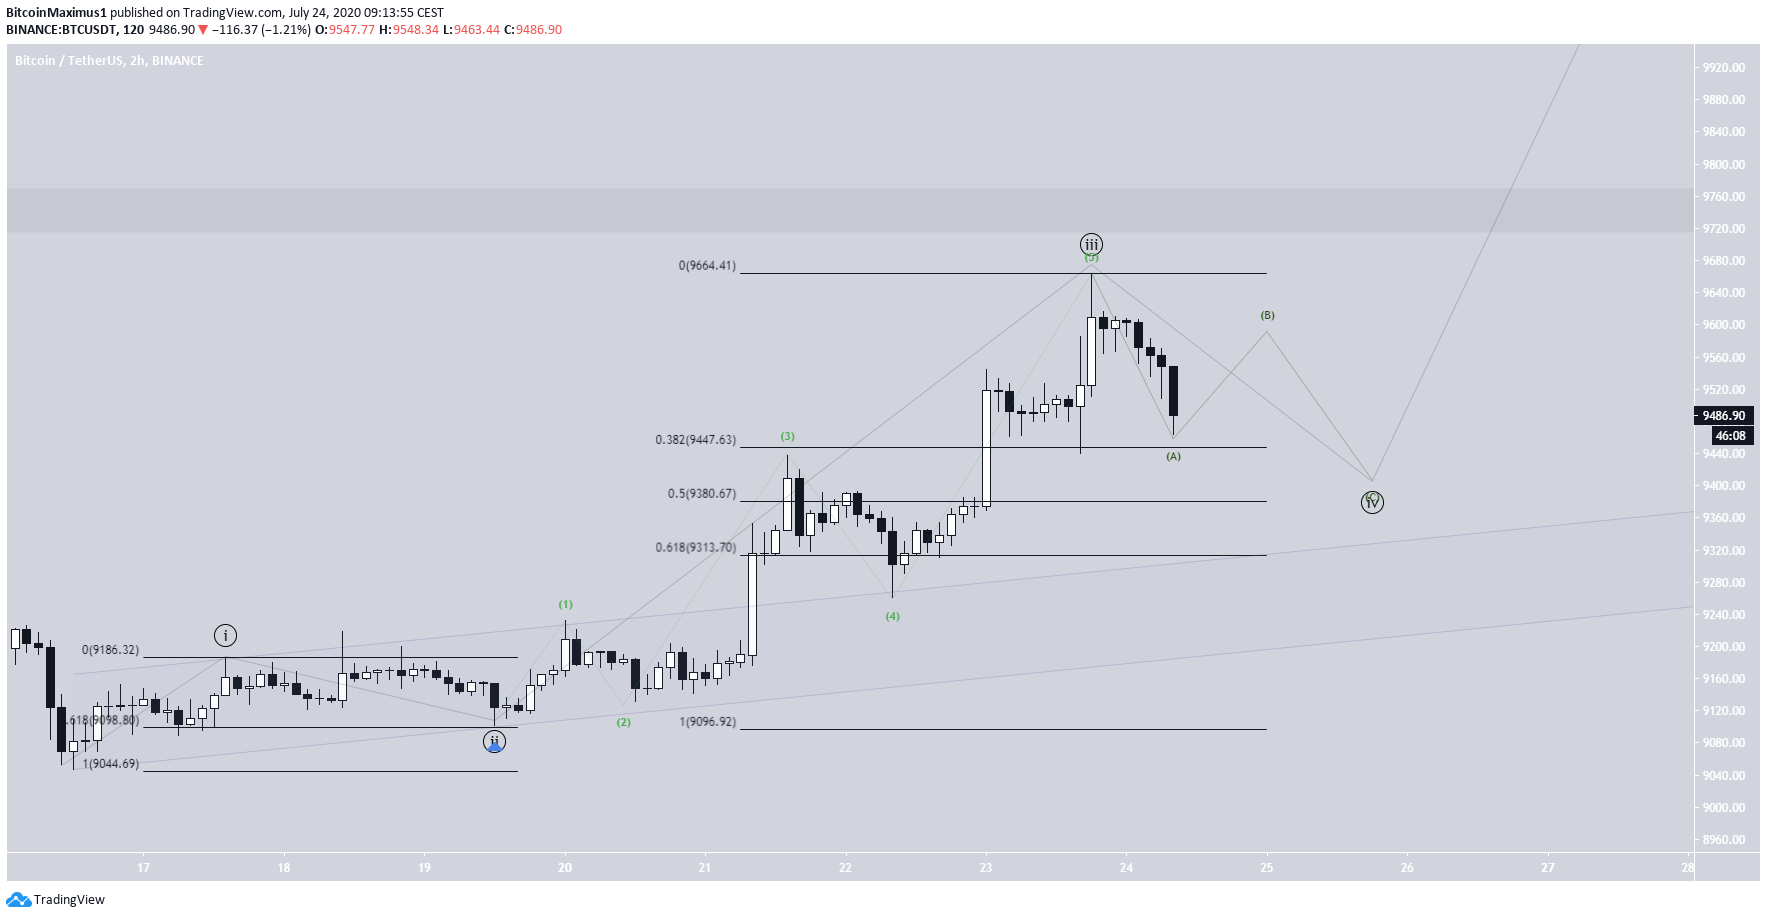
To conclude, the BTC price seems to have begun a small corrective period, which is expected to end near $9,400. Afterward, the price is likely to resume its upward movement and break out above $9,750.
For our previous analysis, click here.


