
Bitcoin (BTC) is possibly trading inside an ascending channel and is expected to continue increasing until it reaches the closest resistance area at $9,320.
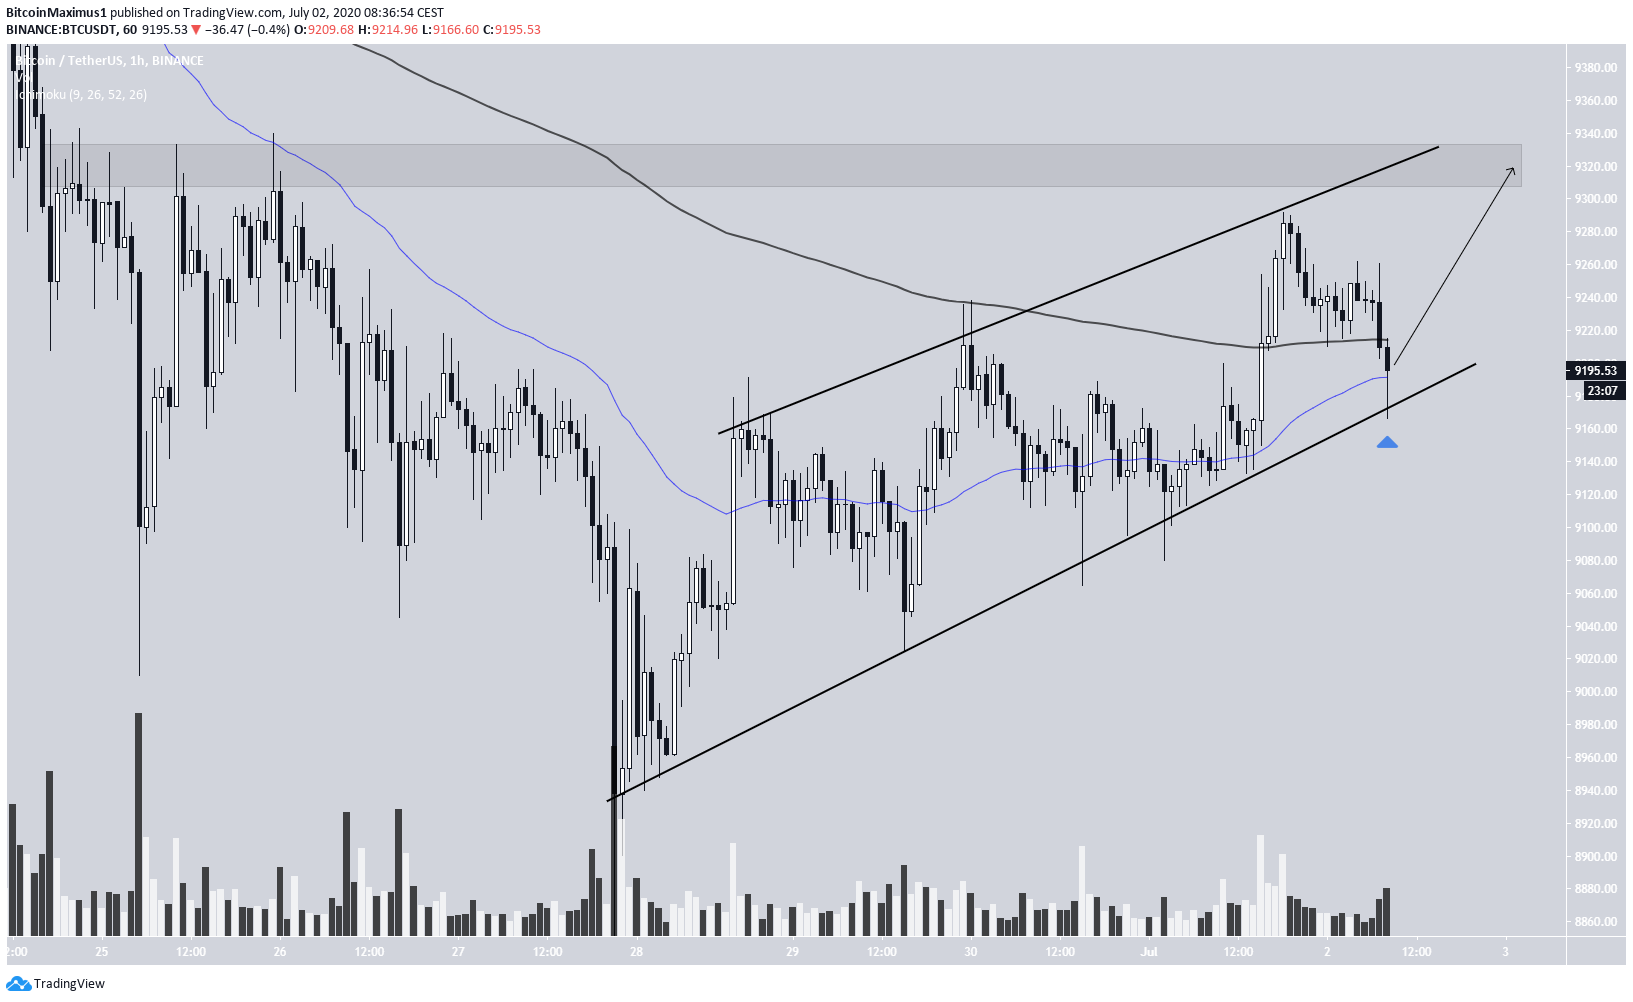
The Bitcoin price has been increasing since June 27 when it reached a low of $8,833. It created a long lower-wick and initiated an upward move. Since then, it is possible that the price is trading inside an ascending channel.
Ascending Bitcoin Channel
BTC reached the resistance line of the channel last night, with a high of $9,292, but promptly dropped and is currently trading at the support line of the channel. It is attempting to create a hammer, which is normally considered a bullish candlestick.
The price is also trading above the 50-hour moving average (MA), but only slightly below the 200-hour MA. If the price were to increase above the latter, a bullish cross would likely transpire, since the MAs are very close to each other.
The closest resistance area is found at $9,330, coinciding with the resistance line of the channel.
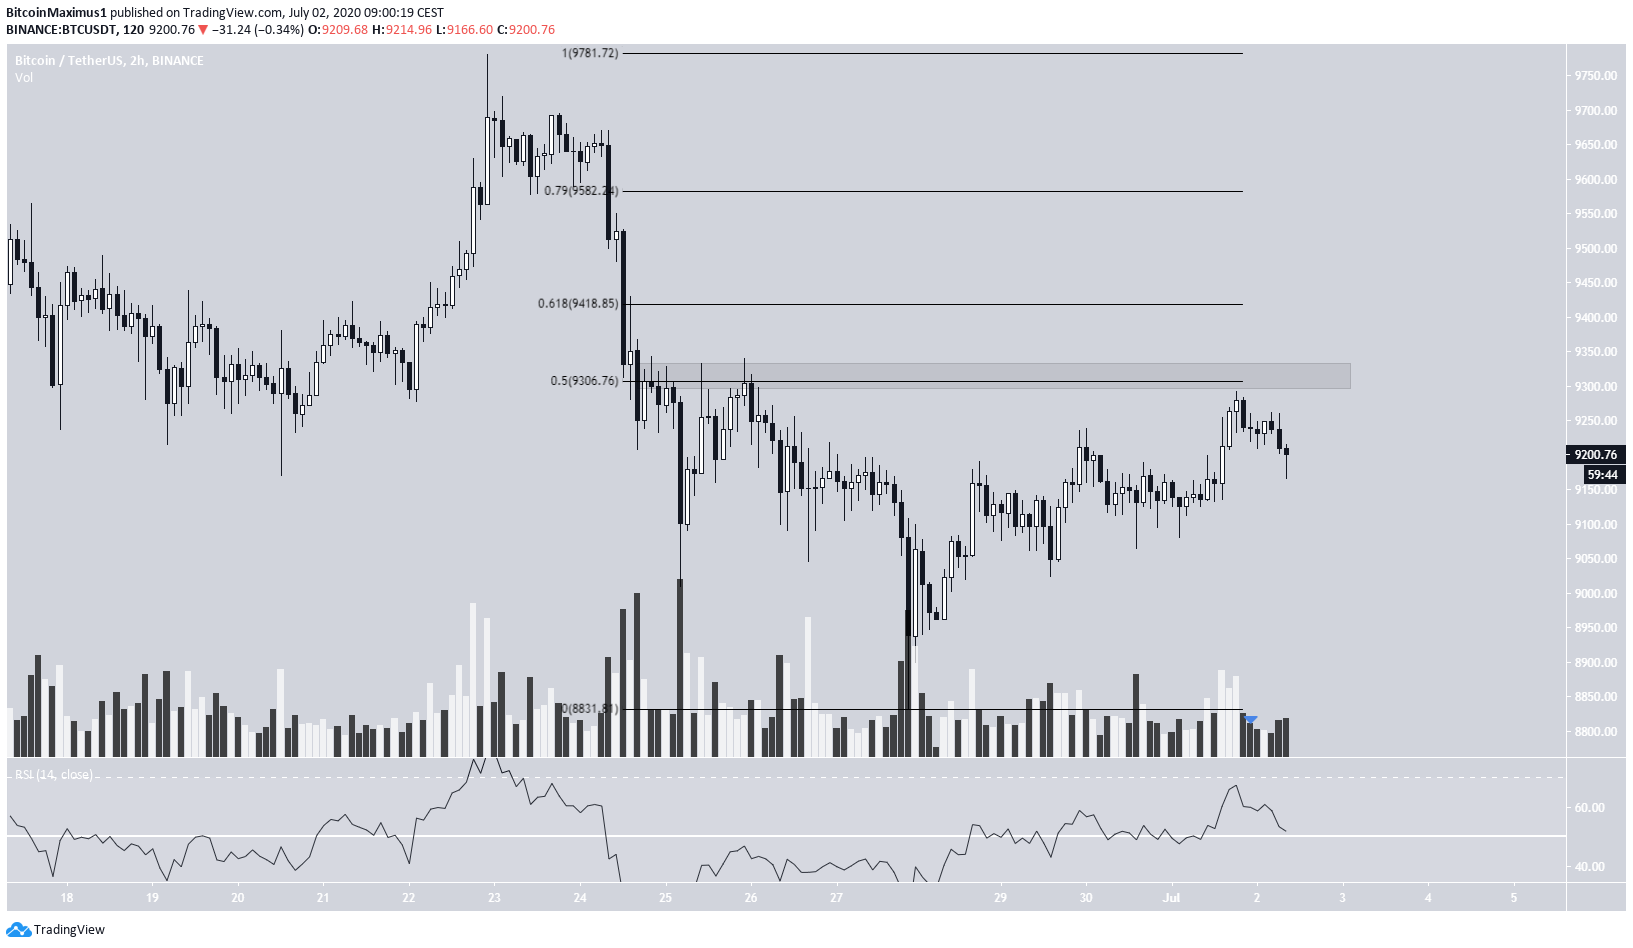
A slightly longer-term view shows that the aforementioned resistance area is also the 0.5 Fib level of the entire downward move, beginning on June 22.
Furthermore, there is no bearish divergence in the RSI, and volume has been quite low during the decrease. Therefore, it is expected that the price makes another attempt at breaking out above this resistance area, possibly heading towards the 0.618 Fib level at $9,418.
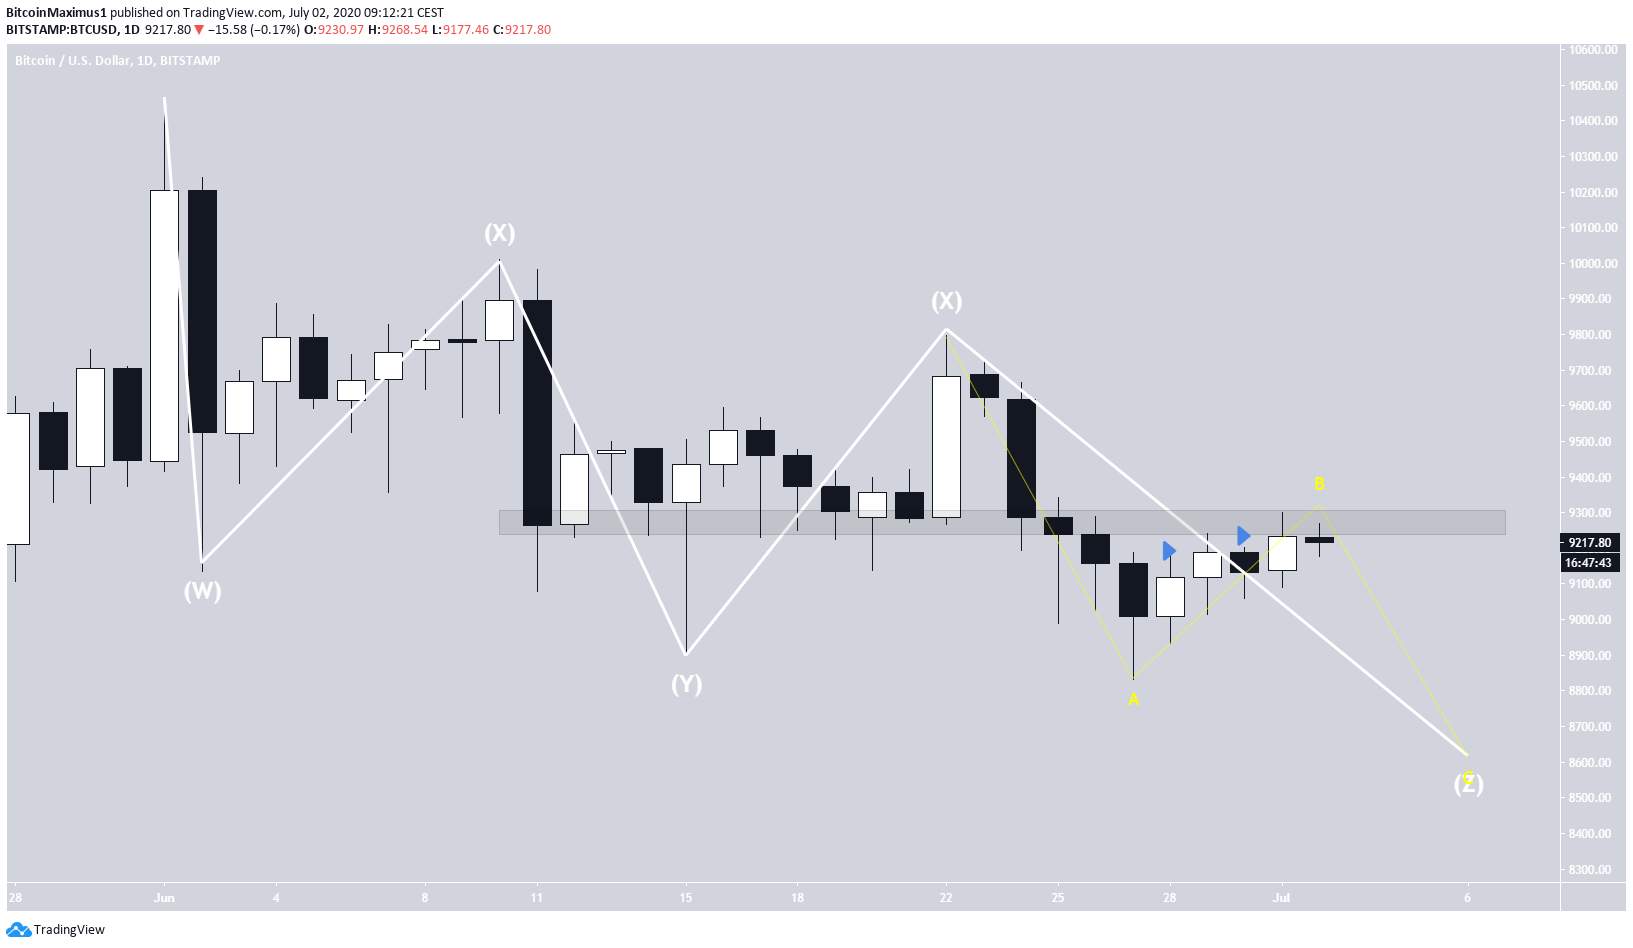
Wave Count
In the longer-term, we can see that BTC has been decreasing since it reached a high of $10,429 on June 1. The movement since resembles a complex, triple-three correction, which is labeled as W-X-Y-X-Z in the chart below.
The price is likely in the final ‘Z’ wave, which is transpiring inside an A-B-C formation.
Furthermore, the importance of the $9,300 area is highlighted, since it previously acted as support since June 8.
However, yesterday’s close was the third successive higher close, making the daily bias slightly bullish. A daily close above this $9,300 resistance area would put serious doubt in the wave count and the possibility that this movement is a retracement that will eventually lead to a continued decrease.
For our previous analysis, click here.
