

The current Bitcoin movement has several similarities with the bottom reached in 2018. If the price acts in the same way, it should consolidate until February before breaking out.
The Bitcoin price has been increasing since November 25, when it reached a low of $6615. The upward move and ensuing retracement have had similarities to the December 2018 bottom, which was the low before the entire upward move that lead to $13,764.
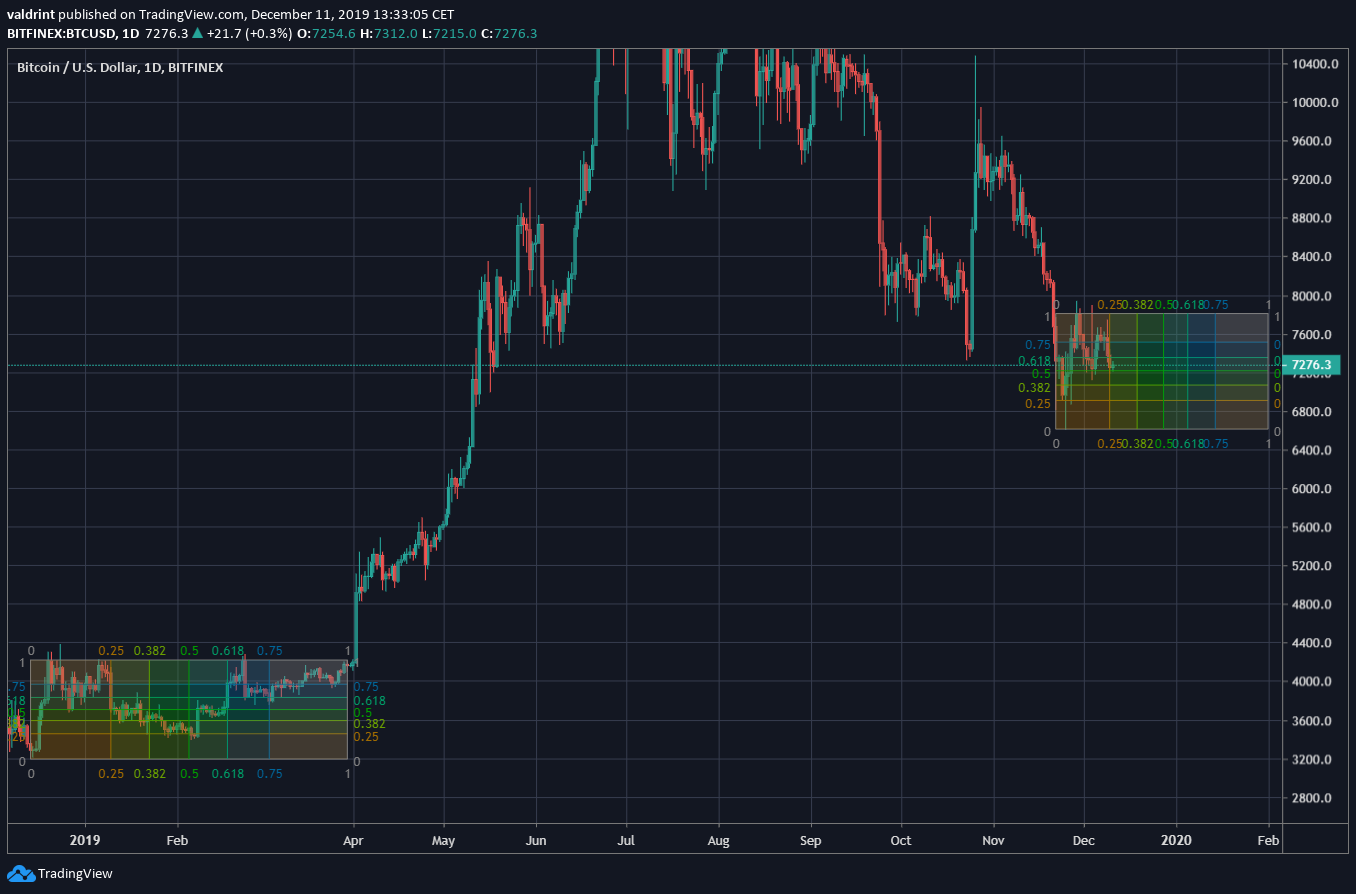
Cryptocurrency trader @davthewave outlined a possible fractal for the Bitcoin price. The fractal suggests that the movement near the December 2018 bottom is similar to the current local bottom reached on November 25, 2019.
While the tweet embraces the fact that this fractal is highly speculative, we will compare these movements and see if they really are similar. The two potentially similar movements are outlined below. If they are indeed fractals, the price is now at the quarter mark and the movement will continue until February 2020.Highly speculative [the shorter the time frame, the more speculative].
— dave the wave🌊🌓 (@davthewave) December 11, 2019
Possible bottoming fractal forming…. pic.twitter.com/o3iNcTmBpe
2018 Bottom
The Bitcoin price reached a low of $3215 on December 15, 2018, the day which marks the beginning of the fractal. The movement was preceded by bullish divergence in the oversold RSI. After the price increased to $4200, it began a downward move. It broke down below the 0.5 level and bounced twice on the 0.25 one, without completing a full retracement. Afterward, the price began another upward move and reached a high of $4200. This caused it to move above the 50- and 100-day moving averages (MA) which then proceeded to make a bullish cross. The price broke out in April and continued its upward move until it reached a high of $13,764 on June 24, 2019, and began the current correction.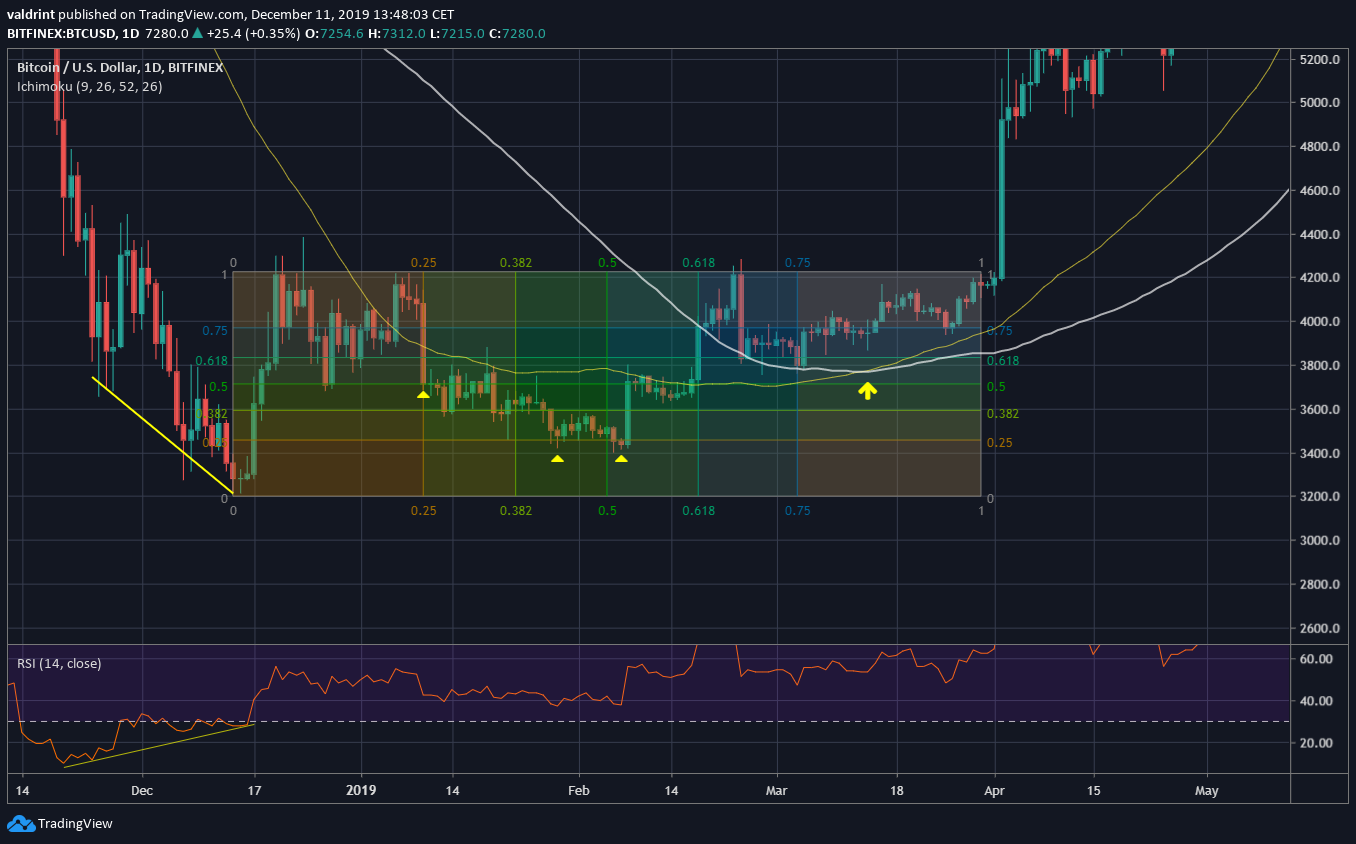
Current Bitcoin Movement
The price reached a low of $6618 on November 25. Similar to the 2018 bottom, this movement was preceded by a bullish divergence in the oversold RSI. Afterward, the price began an upward move that culminated with a high of $7800. If the price follows the same pattern, it should soon break down below $7300 and reach $6900 by the end of January. It should then begin a gradual acceleration before breaking out in February. Additionally, the 50- and 100-day MAs are moving downward. Due to their position, we could see them move in a similar way to 2018, in which they continue decreasing until 2020 before the price begins an upward move and flips them as support. Then, a bullish cross between them should occur.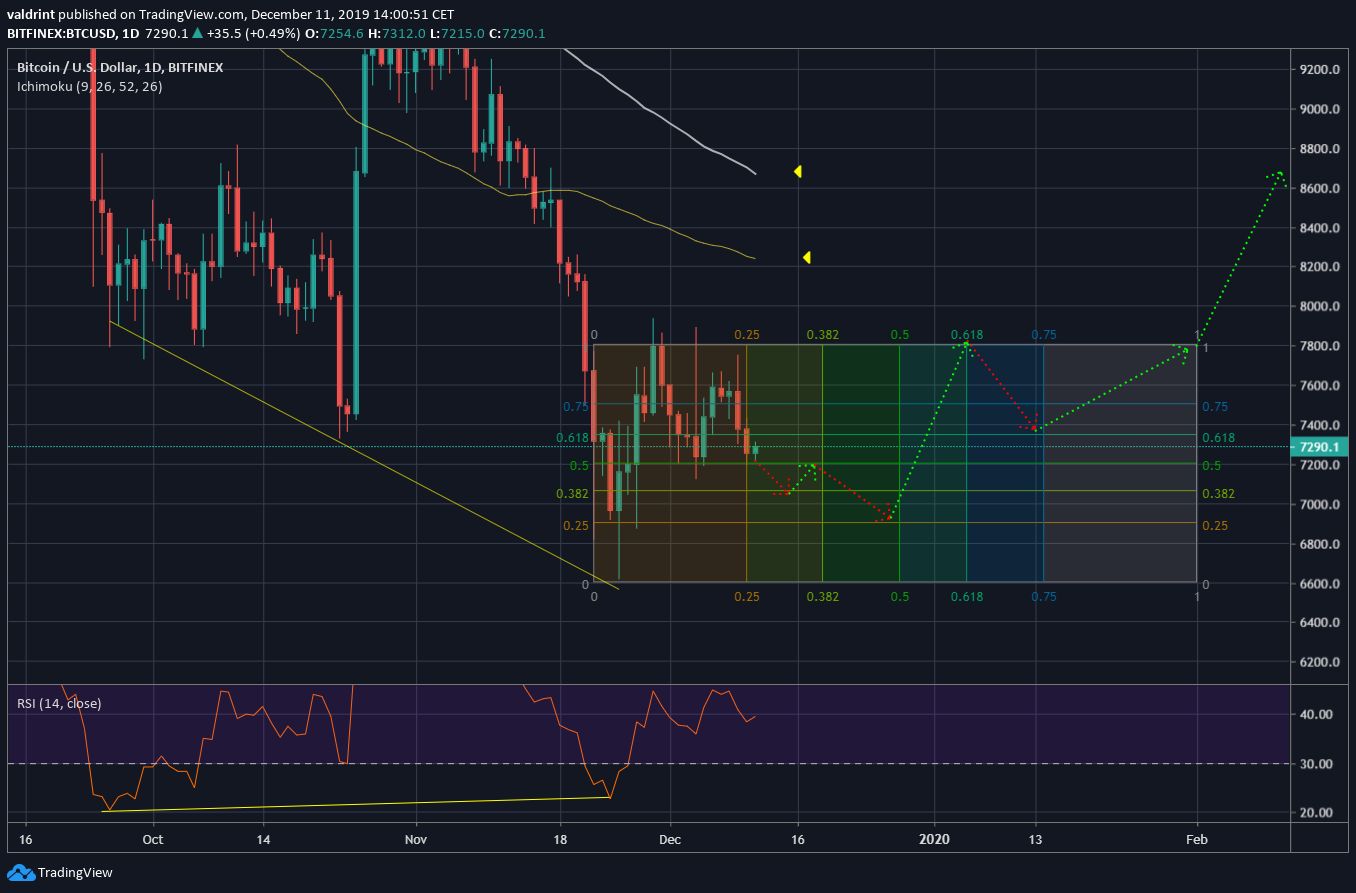 To conclude, it is possible that the 2018 bottom and the current one are similar. For the fractal to hold, the price should not decrease below $6900. A breakout should transpire in February.
Images are courtesy of TradingView, Twitter.
Top crypto platforms in the US
Disclaimer
In line with the Trust Project guidelines, this price analysis article is for informational purposes only and should not be considered financial or investment advice. BeInCrypto is committed to accurate, unbiased reporting, but market conditions are subject to change without notice. Always conduct your own research and consult with a professional before making any financial decisions. Please note that our Terms and Conditions, Privacy Policy, and Disclaimers have been updated.

Valdrin Tahiri
Valdrin discovered cryptocurrencies while he was getting his MSc in Financial Markets from the Barcelona School of Economics. Shortly after graduating, he began writing for several different cryptocurrency related websites as a freelancer before eventually taking on the role of BeInCrypto's Senior Analyst.
(I do not have a discord and will not contact you first there. Beware of scammers)
READ FULL BIO
Sponsored
Sponsored