


![Bitcoin Analysis for 2020-03-11 [Premium Analysis]](/_mfes/post/_next/image/?url=https%3A%2F%2Fassets.beincrypto.com%2Fimg%2FNQ56-sSm9thXWMBrVmqSGhHAjDc%3D%2Fsmart%2F6aefc92ea07a44f89c9ed77e199fb51d&w=1920&q=75)
On March 10, the BTC price broke out from its short-term trading range, but could not sustain the higher prices and decreased below the middle of the range shortly after.
Bitcoin (BTC) Price Highlights
- The Bitcoin price has reached an important daily support level.
- The closest support and resistance areas are found between $7,750-$8,250.
- The price initiated a short-term failed breakout.
- It is possibly trading inside a short-term symmetrical triangle.
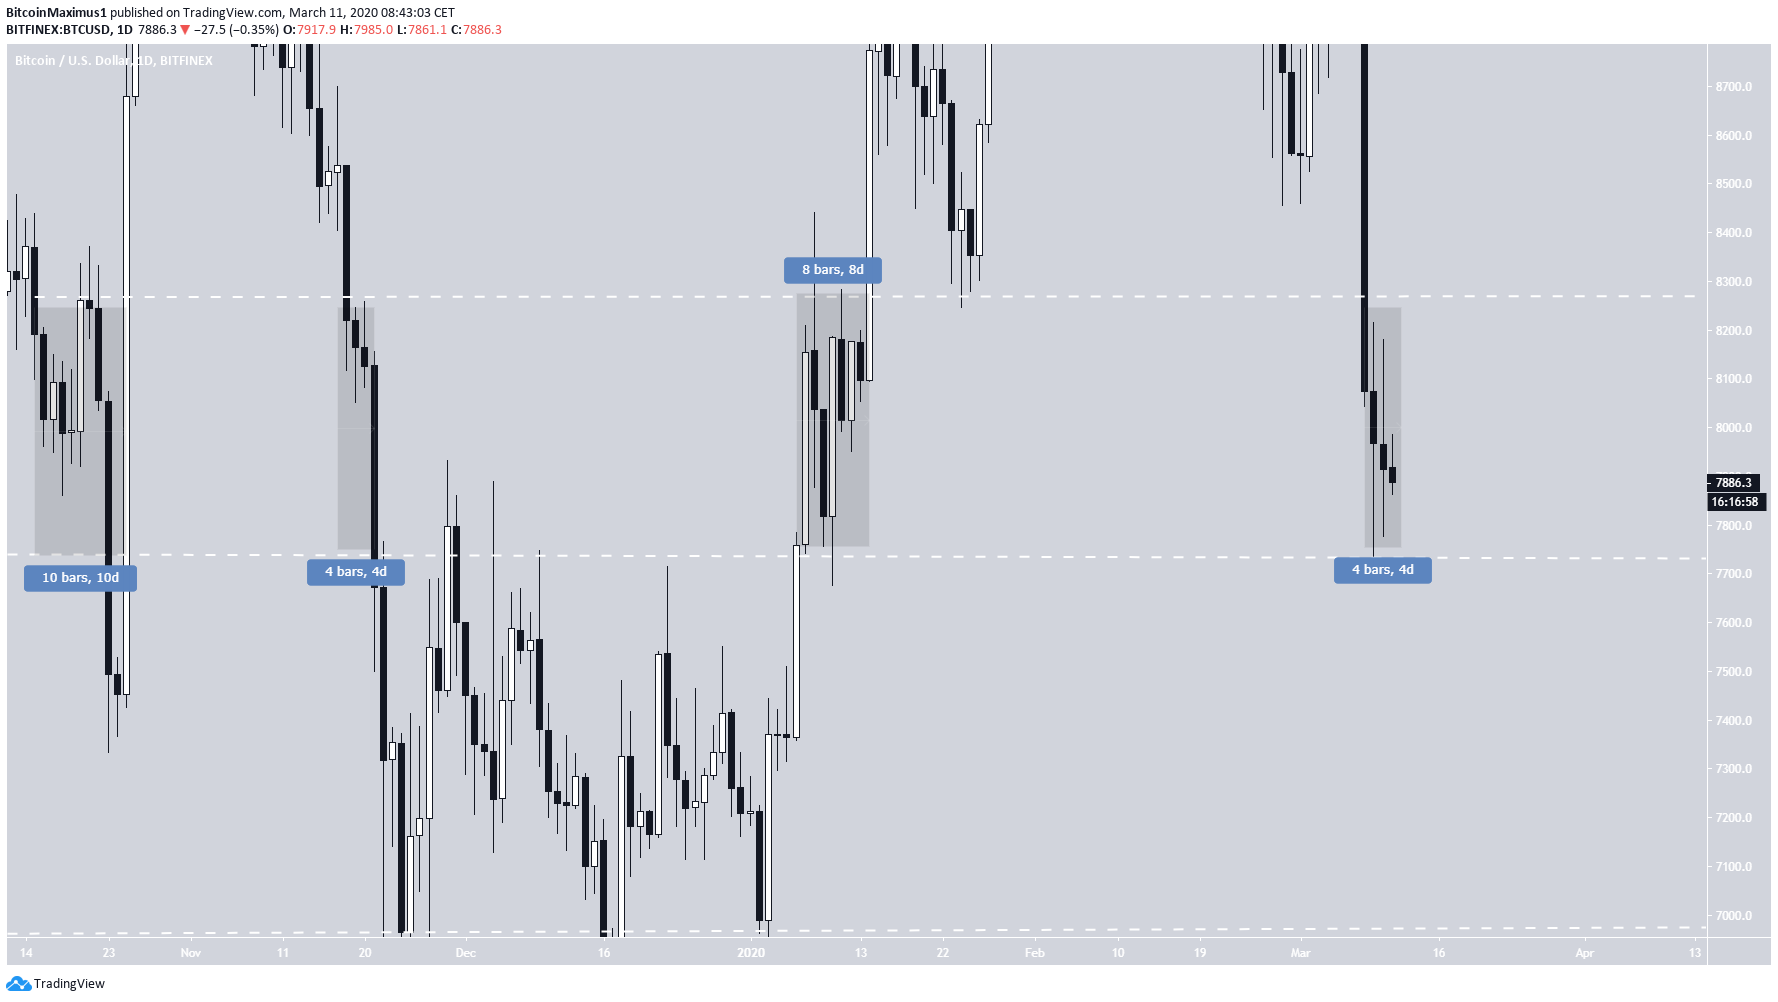
Trading Range
Today marks the fourth day in a row that the BTC price has been trading between the $7,750 and $8,250 support and resistance areas. While it has reached the support level twice in the form of long lower-wicks, it has yet to validate the resistance.
An interesting fact is that the price has traded between these levels four times since October 2019. They all have been relatively short since the price has never stayed in this range for more than 10 days. If this characteristic holds, the BTC price will move from this range in one or the other direction within a maximum of six days.
If the price breaks down, the next support area is not found until $7,000, created by the lows of December 2019.
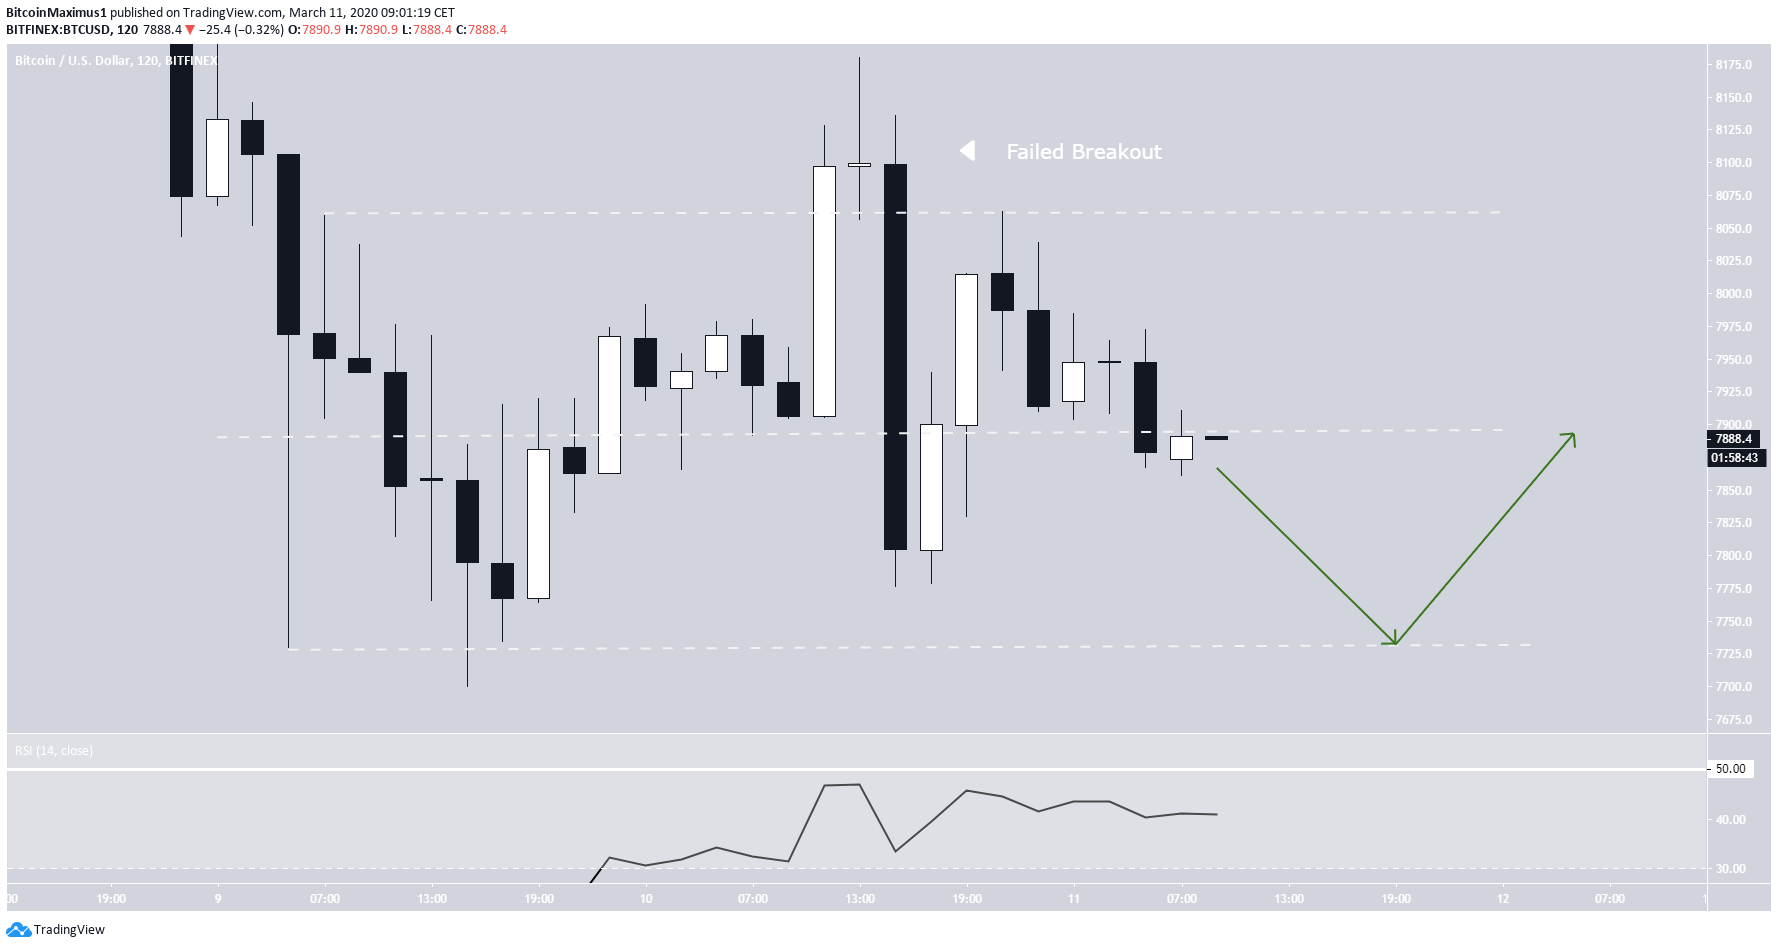
Short-Term Movement
In the short-term, the price is trading inside a range of $7,750-$8,050, with the midpoint (EQ) of the range being at $7,900. The price initiated a breakout yesterday, but failed to sustain the higher prices and followed that with a bearish engulfing candlestick. The bearishness is also supported by the fact that the RSI was rejected by the 50-line.
From here, a drop towards the support level is expected, possibly followed by an increase to the EQ.
The price is also possibly trading inside a symmetrical triangle. Since this is a continuation pattern following a price decrease, a breakdown taking the price to the support level of the short-term range would be likely.
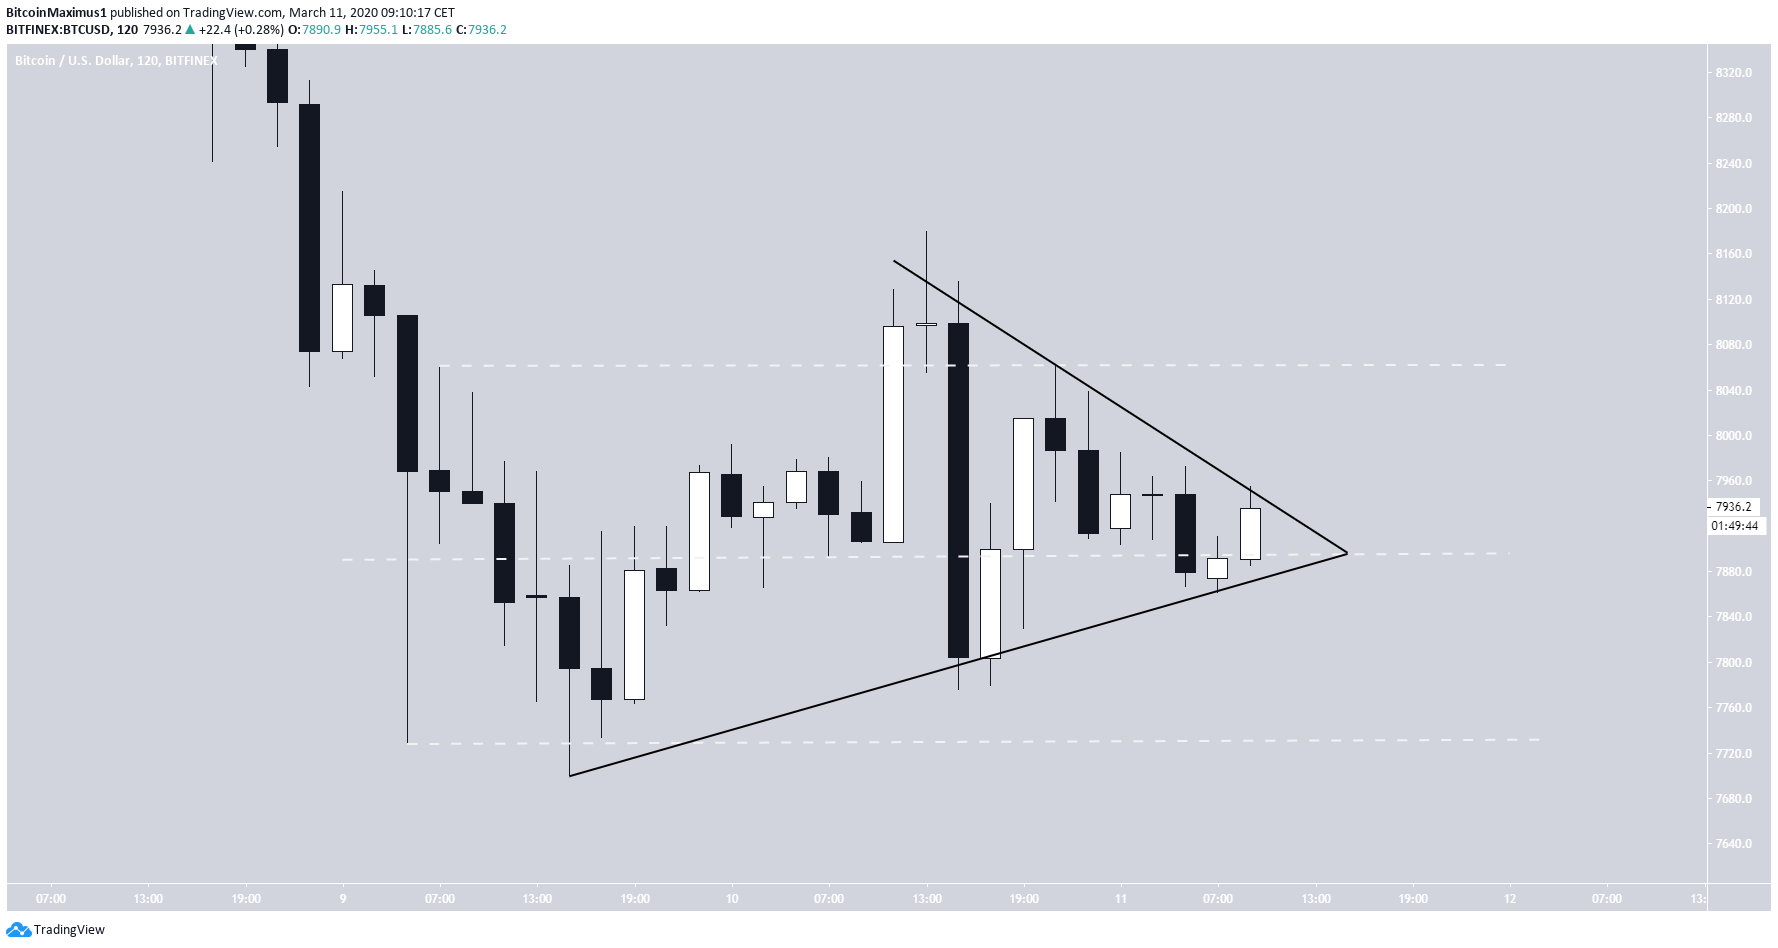
To conclude, the BTC price is trading inside a short-term range of $7,750-$8,050. It has initiated a failed breakout and decreased to the middle of the range. It is expected to drop to the support level once more.
For those interested in BeInCrypto’s previous Bitcoin analysis, click here.


