


![Bitcoin Analysis for 2020-03-10 [Premium Analysis]](/_mfes/post/_next/image/?url=https%3A%2F%2Fassets.beincrypto.com%2Fimg%2FSg_qUQ0FvQnuzckpUVFMTZLk6F4%3D%2Fsmart%2Fb591e25f861d490b85a3b5293611dd32&w=1920&q=75)
On March 9, the BTC price made a low of $7,700. While it has made several short-term bounces, it has yet to create a clearly visible higher-low that would confirm the creation of a bullish price structure.
Bitcoin (BTC) Price Highlights
- The Bitcoin price has broken down from its trading range.
- The closest support and resistance areas are found between $7,750-$8,050.
- The hourly RSI is bullish.
- The price is possibly trading inside an inverse head-and-shoulders pattern.
Trading Range
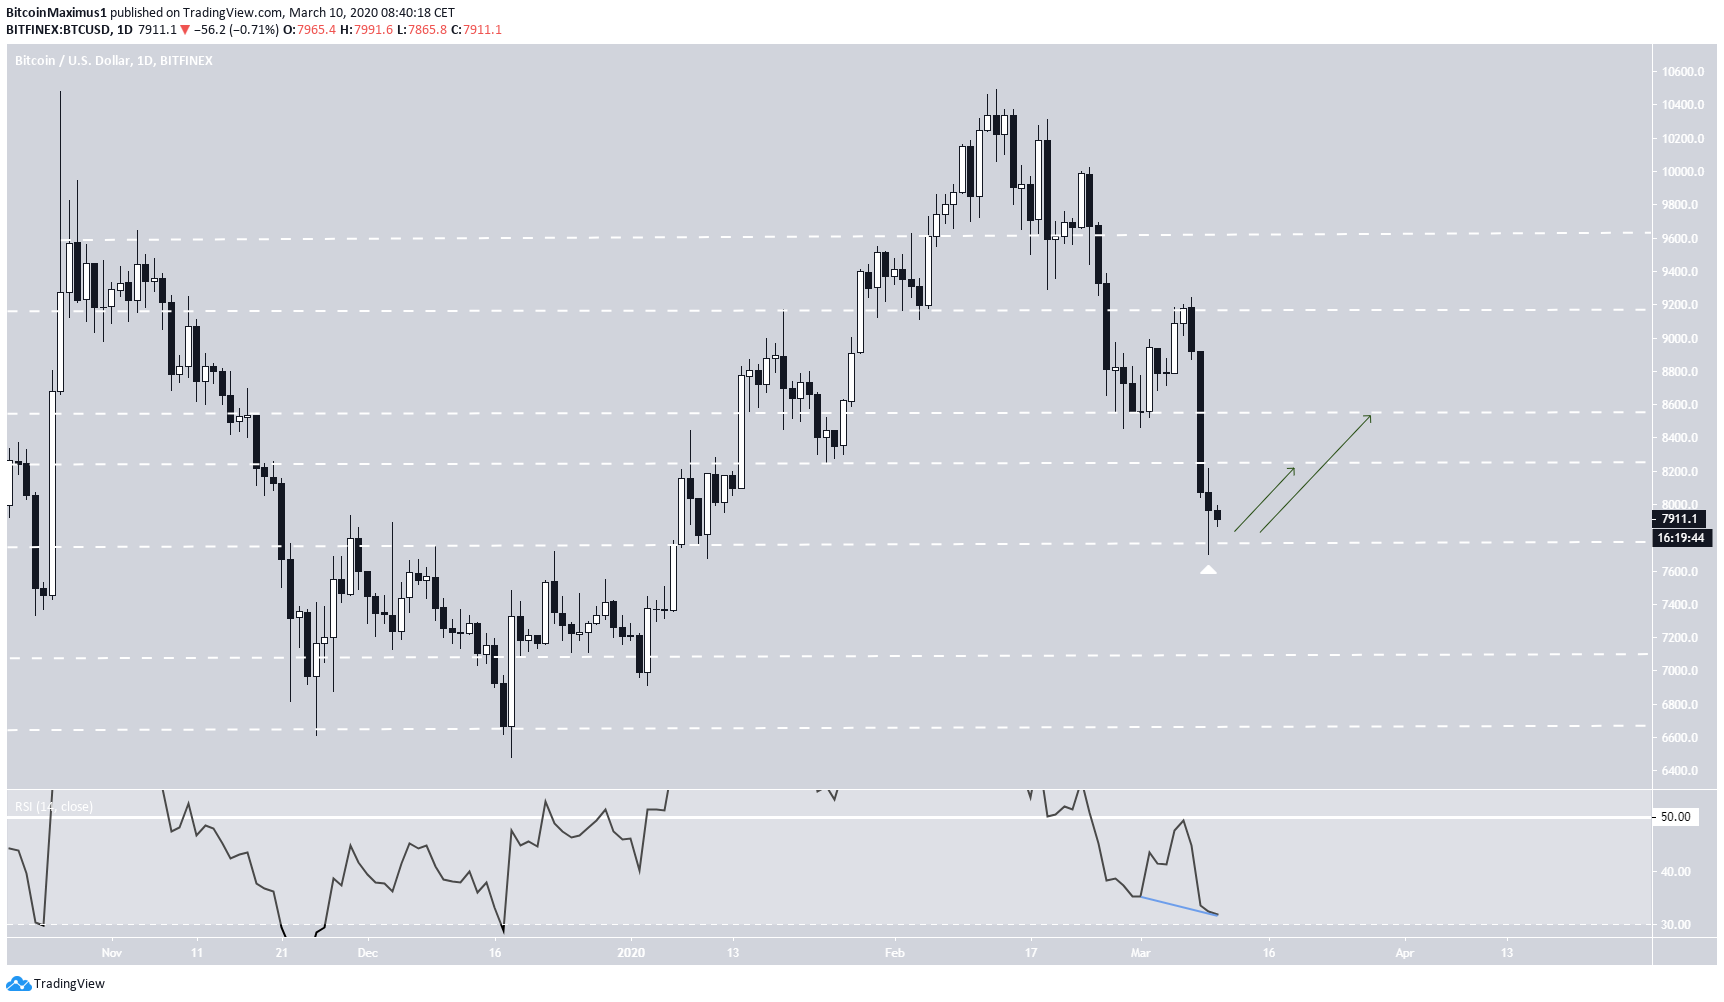
The Bitcoin price has been decreasing over the past four days. From the daily chart, there are numerous support and resistance levels traced, shown in the image below.
The price has currently found support above $7,750, a level it has not traded below since breaking out in January.
If the price initiates a bounce, the first resistance level is found at $8,250, while the next is at $8,550.
The daily RSI has yet to generate any bullish divergence and is trading below 50, indicative that the price is in a downward trend.
Short-Term Movement
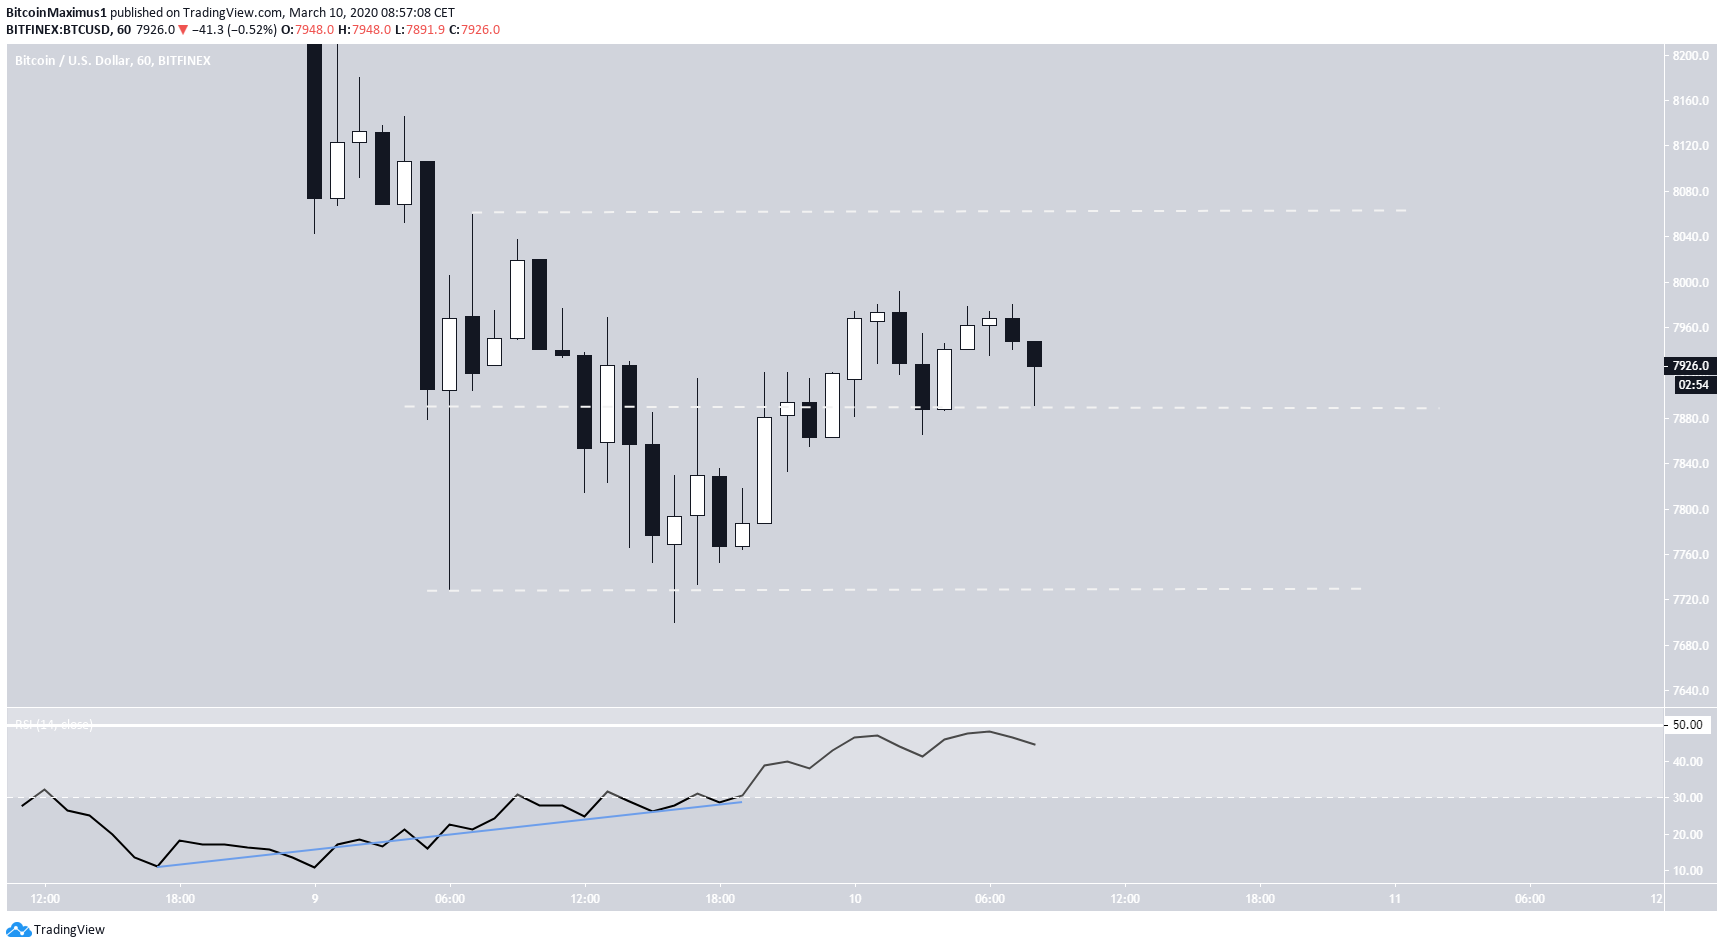
In the short-term, while the support level is the same, the current resistance is found at $8,065, creating a trading range between these two levels. The price is currently holding on above the middle of this range.
The hourly RSI has generated bullish divergence but has failed to move above 50.
The anticipated future movement is an increase toward the resistance line. A breakout above would take the price to the resistance levels outlined in the daily chart.
It is possible that BTC is trading inside an inverse head-and-shoulders pattern. While this is not confirmed, it looks as if the price is in the process of creating the right shoulder.
If true, a breakout is anticipated. A movement that travels the entire height of the pattern would take the price to the daily resistance area at $8,250.
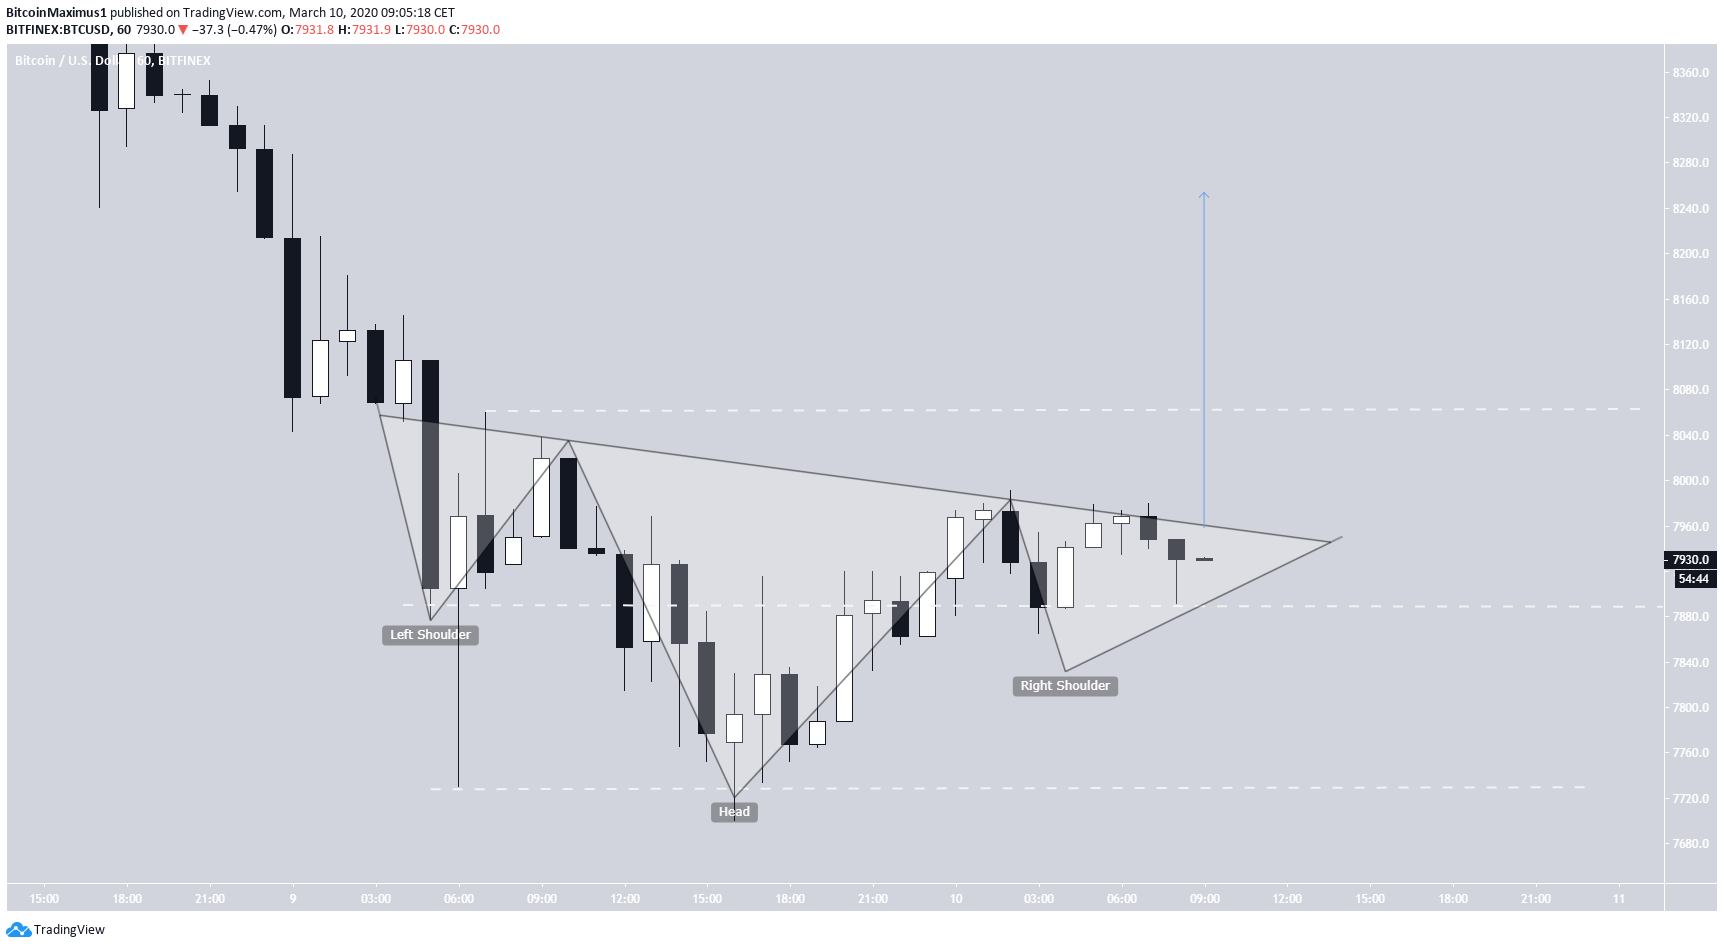
To conclude, the BTC price is trading inside a short-term range of $7,750-$8,050. It has created a bullish pattern that makes a breakout plausible, possibly taking the price to $8,250.
For those interested in BeInCrypto’s previous Bitcoin analysis, click here.


