![Bitcoin Analysis for 2020-03-06 [Premium Analysis]](/_mfes/post/_next/image/?url=https%3A%2F%2Fassets.beincrypto.com%2Fimg%2FUnXValrNHWbktUn0NamOi5ZkLR8%3D%2Fsmart%2Fd4f8af8979454b3896c0efebc8200dd0&w=1920&q=75)
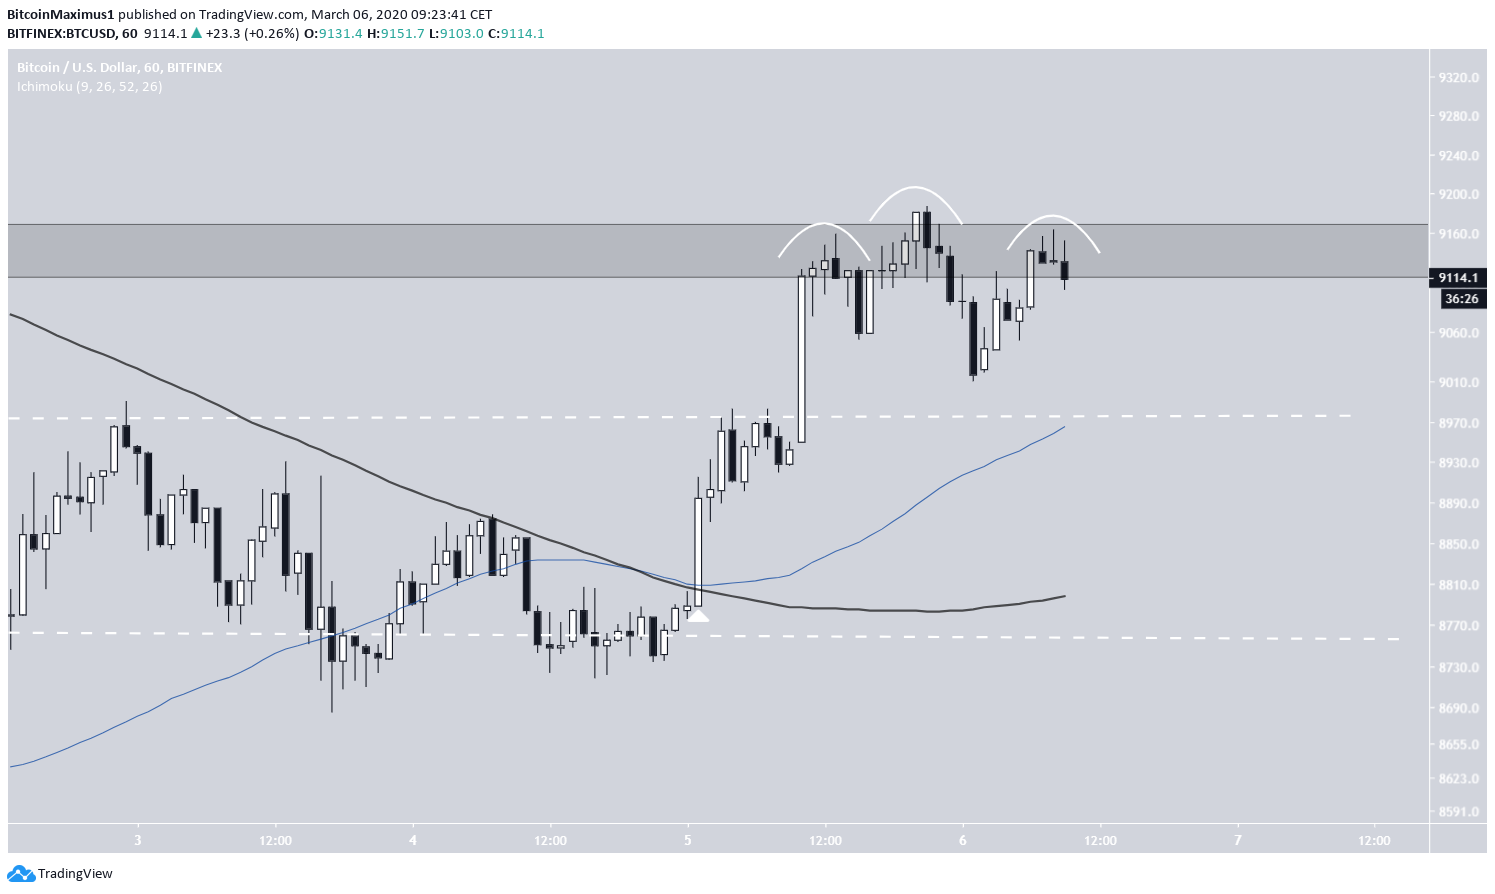
On March 5, the Bitcoin price initiated a rapid increase and moved above the resistance line of its trading range. This also caused an hourly golden cross to transpire. The price is currently trading inside the next resistance area at $9,130.
Bitcoin (BTC) Price Highlights
- The Bitcoin price has broken out above its previous trading range.
- There is resistance at $9,150 and $9,450.
- There is support at $8,975.
- It has created what resembles a head-and-shoulders pattern.
- The daily and hourly RSI are bearish.
Bitcoin Breakout
On March 5, the Bitcoin price created a bullish engulfing candlestick and bounced strongly from the middle of the range.
This caused it to move above both the 50 and 200-hour MAs, which made a bullish cross. The price continued to increase until it reached the resistance area at $9,150, where it is currently trading. But, it has created what seems like a head-and-shoulders pattern, albeit with an unclear neckline.
Therefore, the anticipated price movement would be a re-test of the breakout level combined with the 50-hour MA, prior to the continuation of the upward move.
The possibility of this short-term decrease is supported by the hourly RSI, which has generated some bearish divergence and completed a failure swing top.
Therefore, the next step is likely a decrease toward the support area at $8,975.

Future Movement
In the longer-term, the price is completing the ‘B wave.’ The area forecasted to be the end of this wave is found between the 0.5-0.618 Fib levels of the previous decrease, more specifically between $,9250-$9,400. The previous support area at $9,600 should act as the upper-limit.
This view is supported by the daily RSI, which is approaching the 50-line from below and has almost reached it. An RSI rejection along with a resistance rejection would mark the end of the pattern.

To conclude, the Bitcoin price began an upward move and broke out from its trading range. It is likely that after a short retracement, the move will continue until around $9,400 to test resistance.
For those interested in BeInCrypto’s previous Bitcoin analysis, click here.
