


![Bitcoin Analysis for 2020-02-27 [Premium Analysis]](/_mfes/post/_next/image/?url=https%3A%2F%2Fassets.beincrypto.com%2Fimg%2FLwHbIG7OGN5FownqgCWd0fj5j8g%3D%2Fsmart%2Fd77b30e58ed14b1e8b6c952c3483150e&w=1920&q=75)
On Feb 26, the Bitcoin price created a bearish engulfing candlestick and decreased by almost 7%.
Bitcoin (BTC) Price Highlights
- The Bitcoin price created a bearish engulfing candlestick.
- It bounced at the 200-day MA.
- It will possibly begin the B wave of a corrective A-B-C formation.
- There is support and resistance at $8,350 and $9,500.
Price Decrease
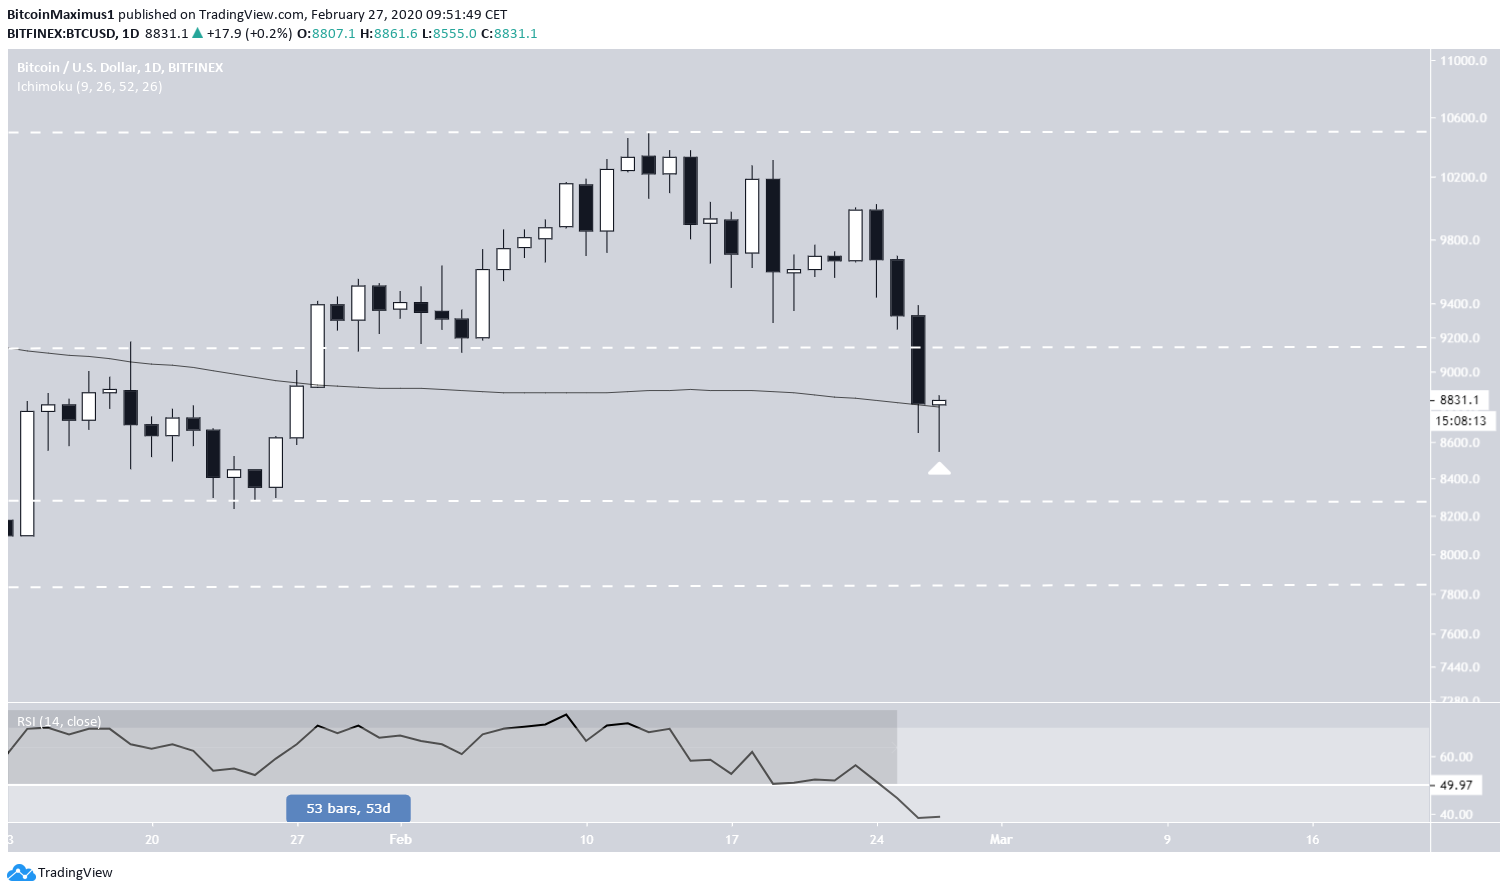
The Bitcoin price decreased rapidly on Feb 26. It created a bearish engulfing candlestick and decreased well below the $9,150 support level. Besides the breakdown, the RSI fell much below 50 after 53 days, confirming that the price is in a bearish trend.
While the price reached a low of $8,555 the next day, it immediately bounced upwards towards $8,800, where it is currently trading.
What is interesting about this bounce is that it occurred right at the 200-day moving average (MA). The price is creating a bullish inverted hammer, indicating that it wants to move upwards.
The next support area is found at $8,350.
Elliott Formation
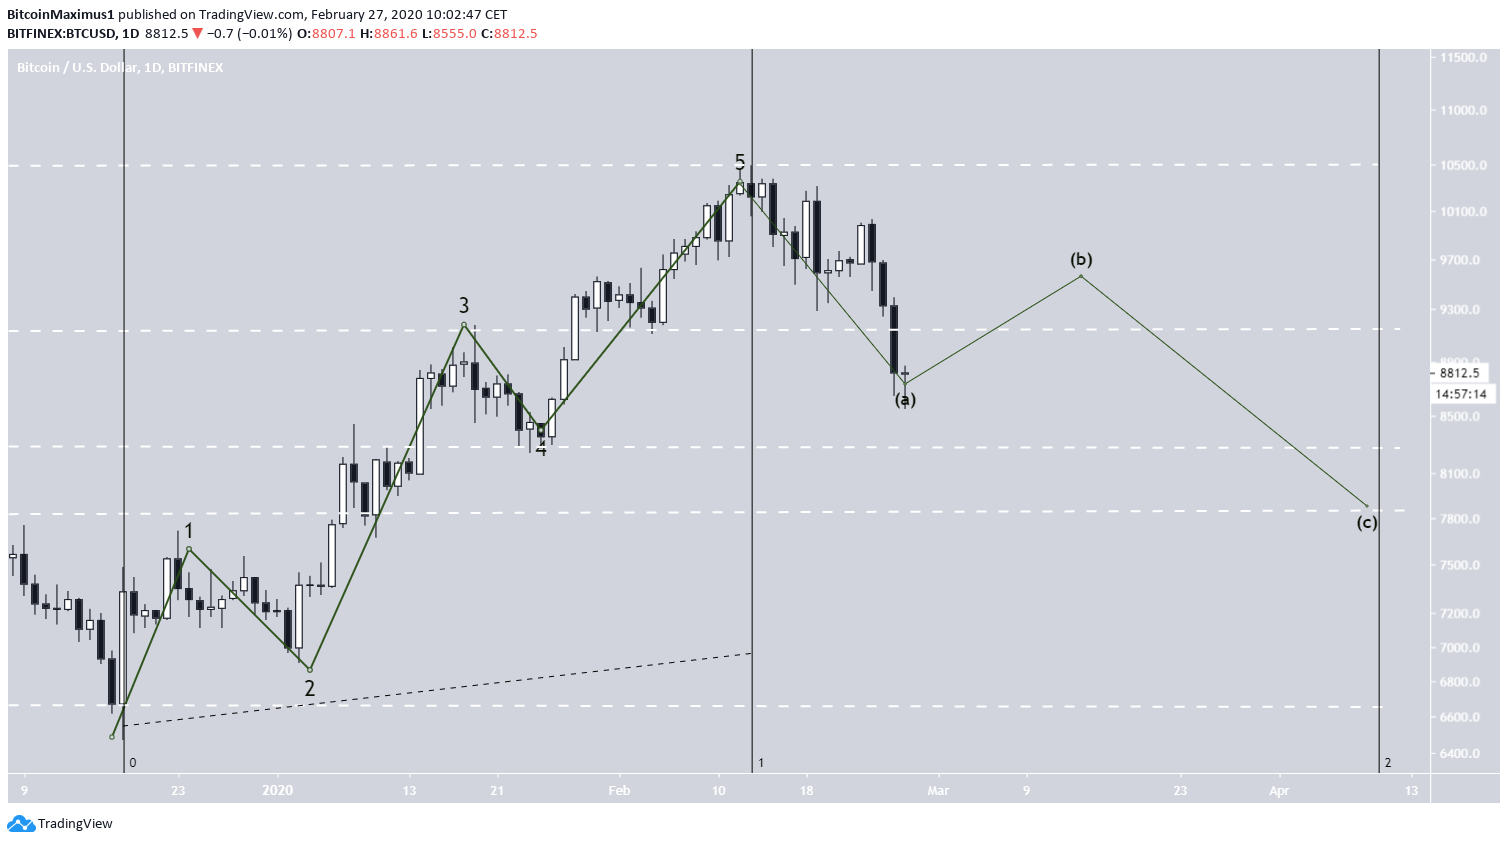
Yesterday’s rapid decrease and the RSI movement below 50 indicates that the price has begun a corrective period. On the other hand, the 200-day MA support and the ensuing bounce suggest that the price could initiate a relief rally.
So, the most likely movement is an A-B-C correction. If it takes the same amount of time as the upward move, it will end around April 10 at $7,800.
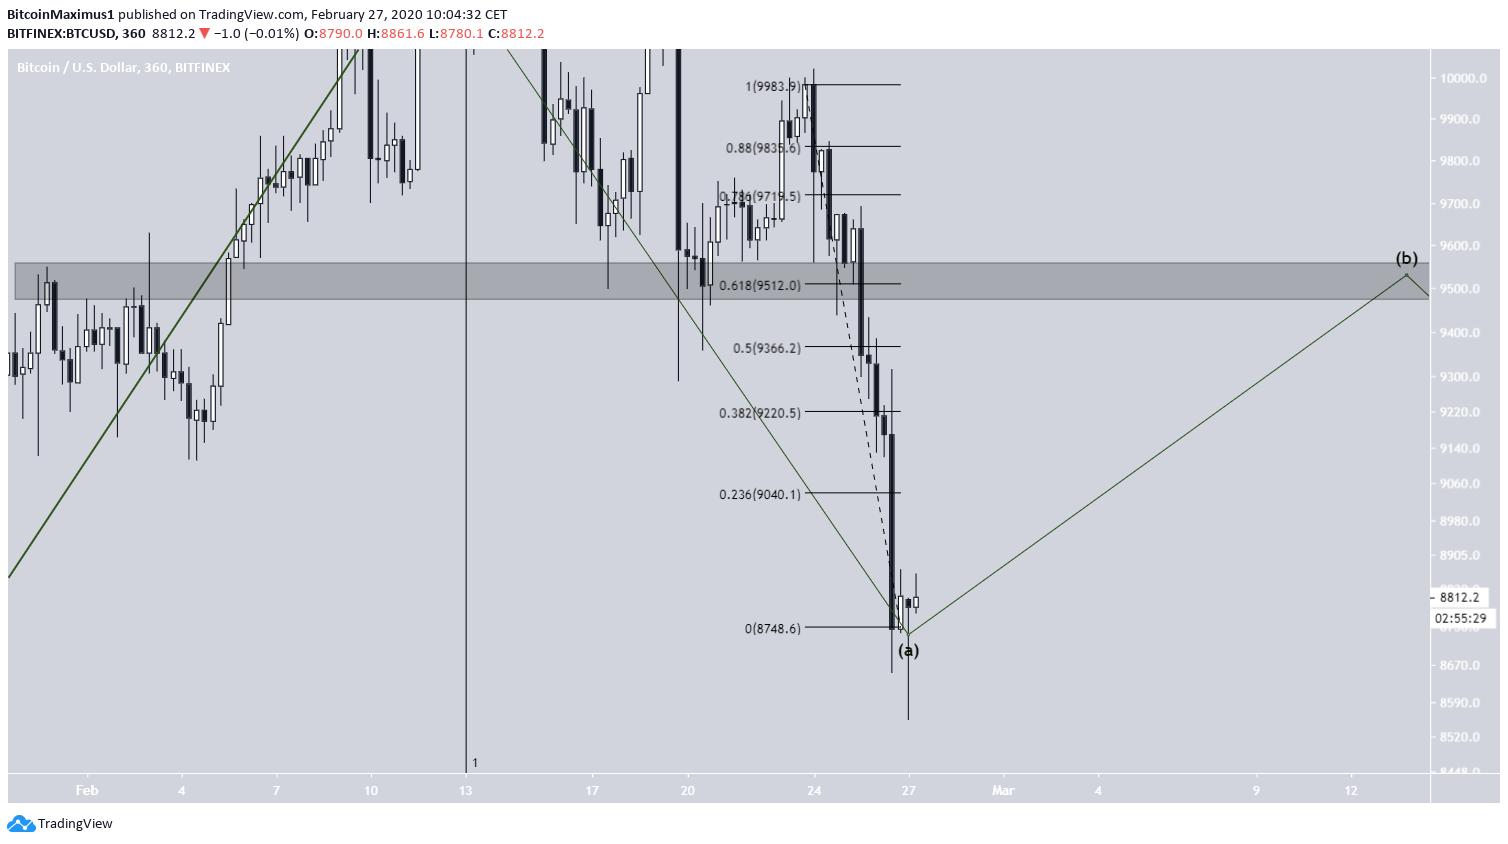
Looking at the shorter-term movement, we can see a resistance area at $9,600. This is also the 0.618 Fib level of the previous decrease.
Therefore, this is the most likely place for the top of the B-wave, after which the price is expected to decrease.
To conclude, the BTC price broke down rapidly below a significant support area, indicating that the previous upward move has ended. The price is likely to gradually increase until $9,500, before completing the correction towards $7,800. This pattern is expected to conclude in April.
For those interested in BeInCrypto’s previous Bitcoin analysis, click here.


