![Bitcoin Analysis for 2020-02-21 [Premium Analysis]](/_mfes/post/_next/image/?url=https%3A%2F%2Fassets.beincrypto.com%2Fimg%2FCfQtHZQncXp0RYFJPiFWBYwhDTc%3D%2Fsmart%2F00341f4f8d1f49998fb7e0bf88562731&w=1920&q=75)
On Feb 20, the Bitcoin price reached the support line of the short-term descending channel it has been trading in and has been increasing since.
Bitcoin Price Highlights
- The Bitcoin price is trading inside a descending channel.
- It is trying to flip the $9,650 level as support.
- The daily RSI is right at the 50-line.
- Short-term moving averages are bearish.
- There is resistance at $10,400 and $10,900.
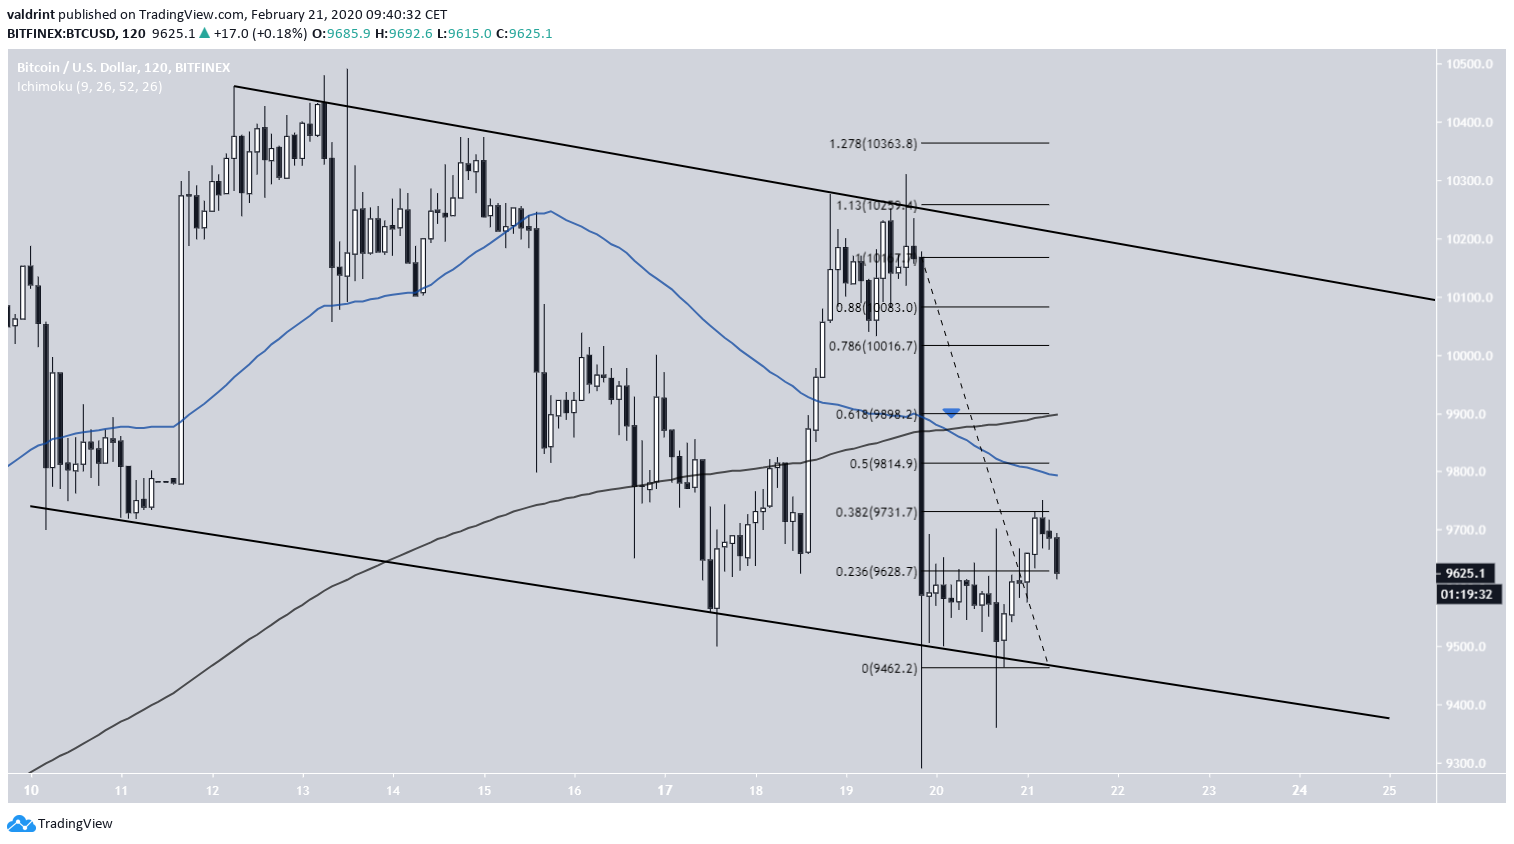
Descending Channel
The price is trading inside a short-term descending channel, It reached the support line of the channel twice on Feb 20 and began the current upward move.
However, the price has yet to move above any significant Fib retracement levels. In addition, the 50 and 200-period moving averages (MA) have made a bearish cross, and the former is providing close resistance to the price.
Therefore, until the price at least flips the 0.5 Fib level as support, the current movement should still be considered a retracement.
Trading Range
The Bitcoin price has been trading in a range with the main support/resistance areas at:
- $10,500
- $9,650
- $9,150
- $8,700
- $8,250
- $7,650
The areas are found from previous resistance/support and Fib levels. As long as the price is between two of these areas, it is likely to use them as support. BTC is currently trying to flip the $9,650 area. If it’s successful, it will probably use it as support to head upwards. If not, $9,650 will likely become resistance.
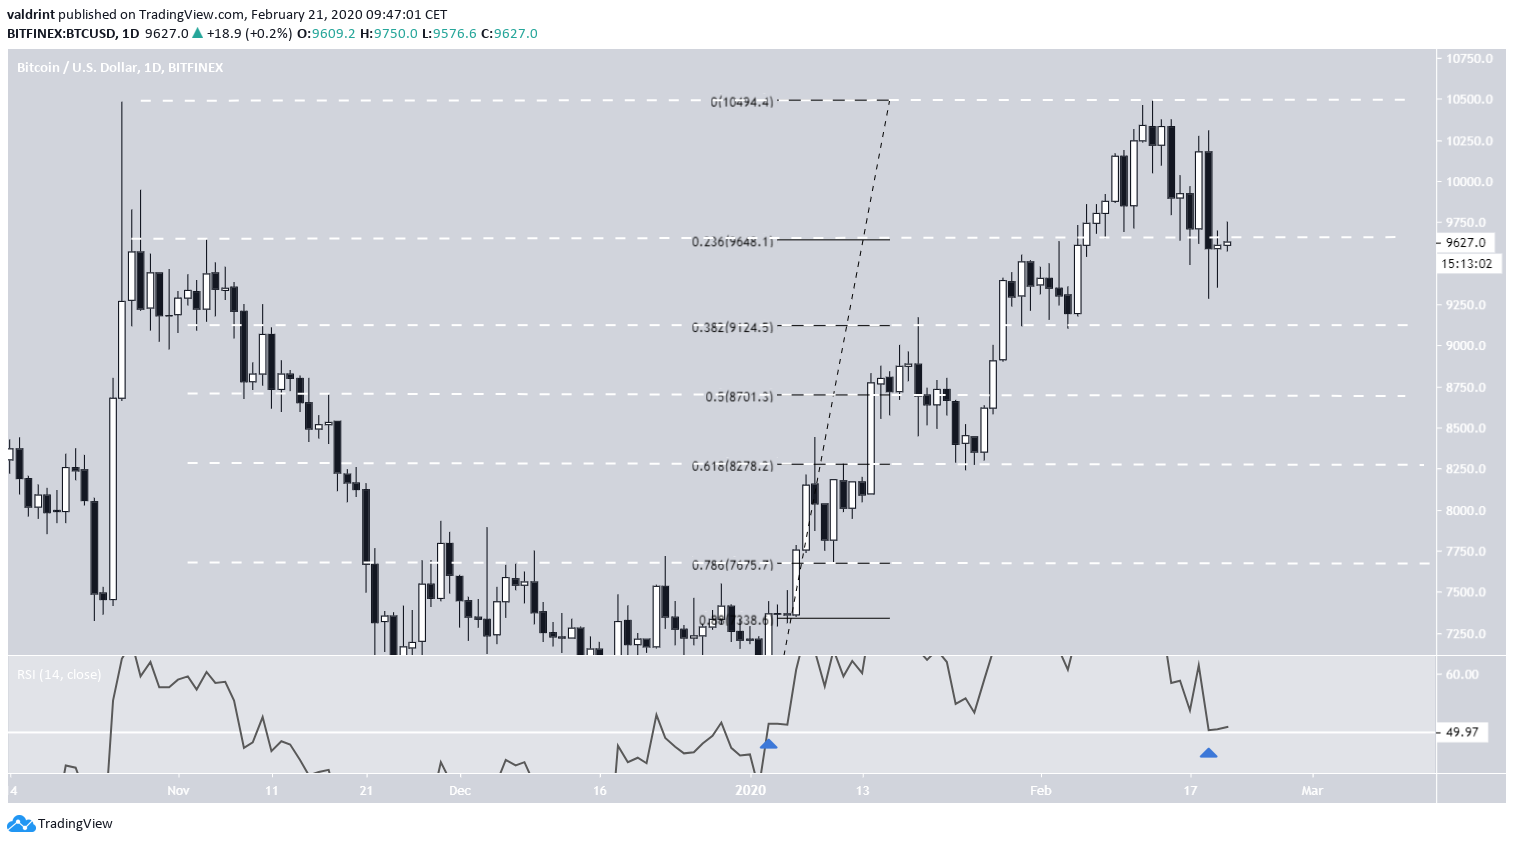
An important development is the RSI movement, which is currently right at the 50-line. The RSI moved above this line on Jan 5 at the same time the upward move from $6,963 began. As long as the RSI is above 50, the price is bullish and vice versa.
To conclude, the Bitcoin price is trading inside a descending channel, having initiated a weak bounce at its support line. A rapid movement in either direction is not expected soon.
For those interested in BeInCrypto’s previous Bitcoin analysis, click here.
