


![Bitcoin Analysis for 2020-02-19 [Premium Analysis]](/_mfes/post/_next/image/?url=https%3A%2F%2Fassets.beincrypto.com%2Fimg%2FSg_qUQ0FvQnuzckpUVFMTZLk6F4%3D%2Fsmart%2Fb591e25f861d490b85a3b5293611dd32&w=1920&q=75)
On Feb 18, the Bitcoin price bounced on the support line of its ascending channel and created a bullish engulfing candlestick, reaching a high of $10,275.
Bitcoin Price Highlights
- The Bitcoin price is trading inside an ascending channel.
- A golden cross has transpired.
- The price is likely in the fifth and final wave of an Elliott formation.
- There is support between $9,000-$9,200.
- There is resistance at $10,400 and $10,900.
Ascending Channel
The BTC price is trading inside an ascending channel. On Feb 18, it reached the support line of the channel, which also coincided with the 0.236 Fib level of the entire upward move, and bounced upwards creating a bullish engulfing candlestick in the process. The price is close to the resistance area of $10,400.
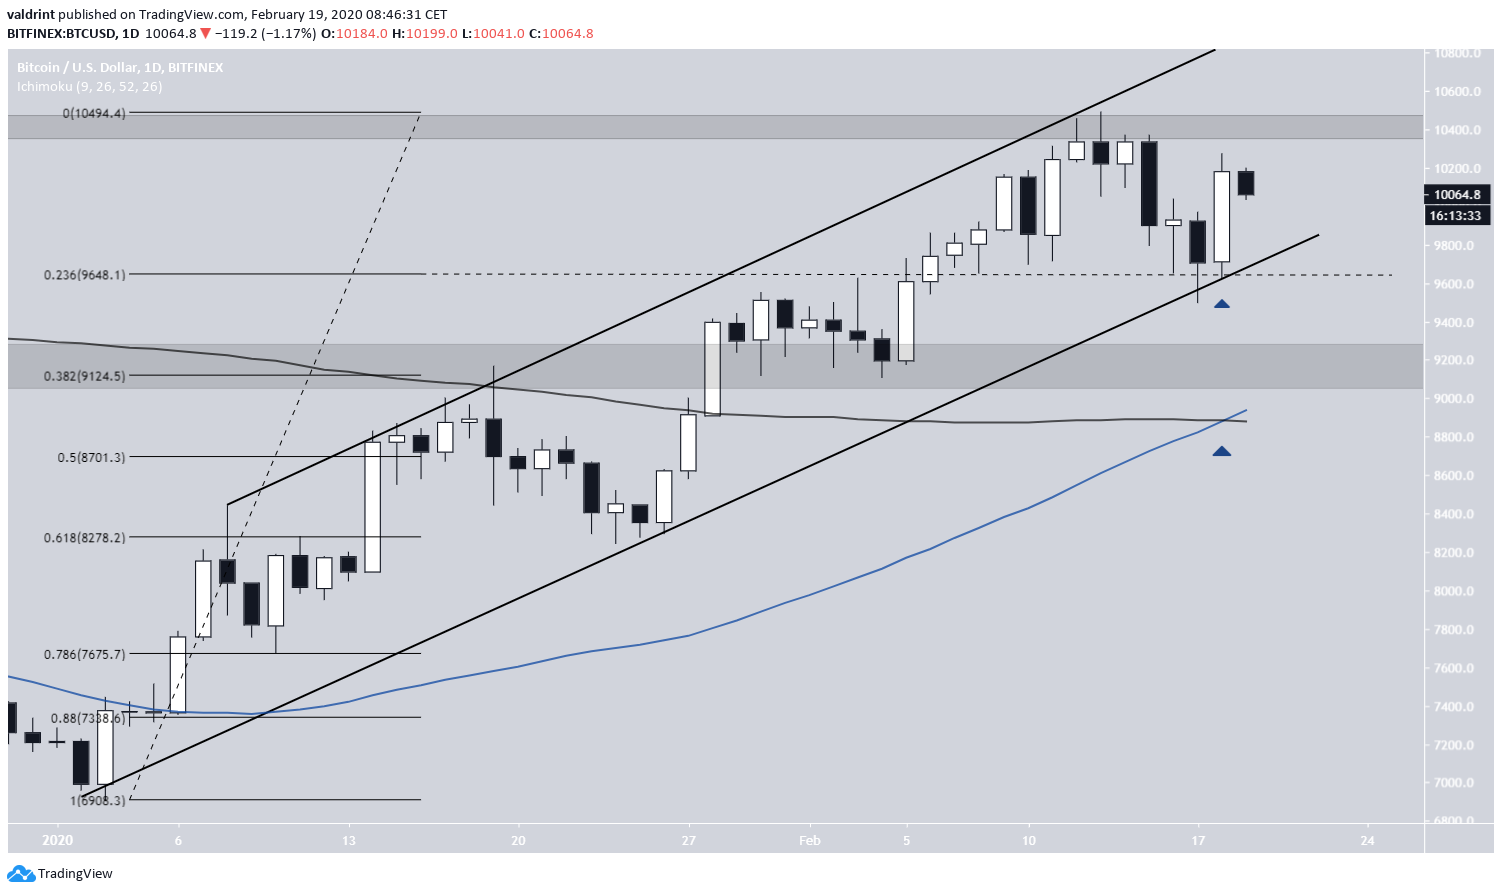
The 50 and 200-day moving averages (MAs) have just made a bullish cross, otherwise known as a golden cross. The main support area is found between $9,000 and $9,200, which is the 0.382 Fib level of the entire upward move and is supported by the bullish cross that just transpired.
RSI Pattern
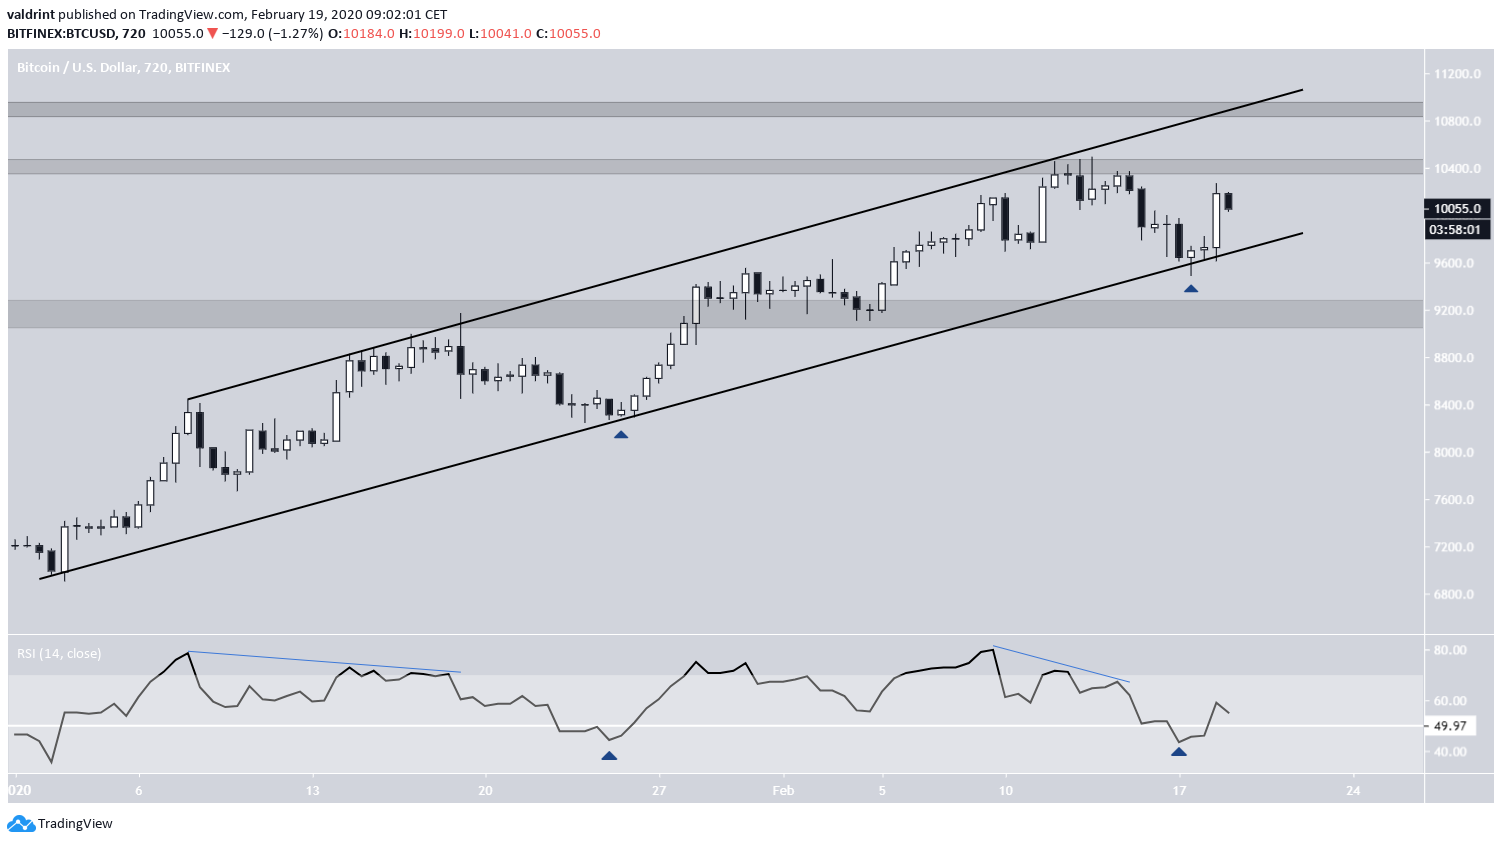
In yesterday’s analysis, BeInCrypto outlined a possible RSI pattern indicating that a bounce could soon transpire. The pattern showed bearish divergence, followed by a price and RSI drop slightly below 50, succeeded by a bounce. The 12-hour RSI suggests that the second path has a higher likelihood of being accurate.
The RSI is currently steadily above the 50-line and the price has bounced, so the fractal is confirmed and the price will likely move upwards towards the next resistance area at $10,400 and possibly higher.
Short-Term Breakout
In the short-term, the BTC price has broken out above a descending resistance line and validated it as support. In addition, it validated the 200-hour MA.
The 50-hour MA is moving upwards, setting up a golden cross in the hourly time-frame. If the price breaks out above the $10,400 resistance area, it is likely to head upward towards $11,000.

To conclude, the Bitcoin price bounced at the support line of its ascending channel and is in the process of moving upwards, likely to the resistance area at $10,400 and possibly break out towards $11,000.
For those interested in BeInCrypto’s previous Bitcoin analysis, click here.


