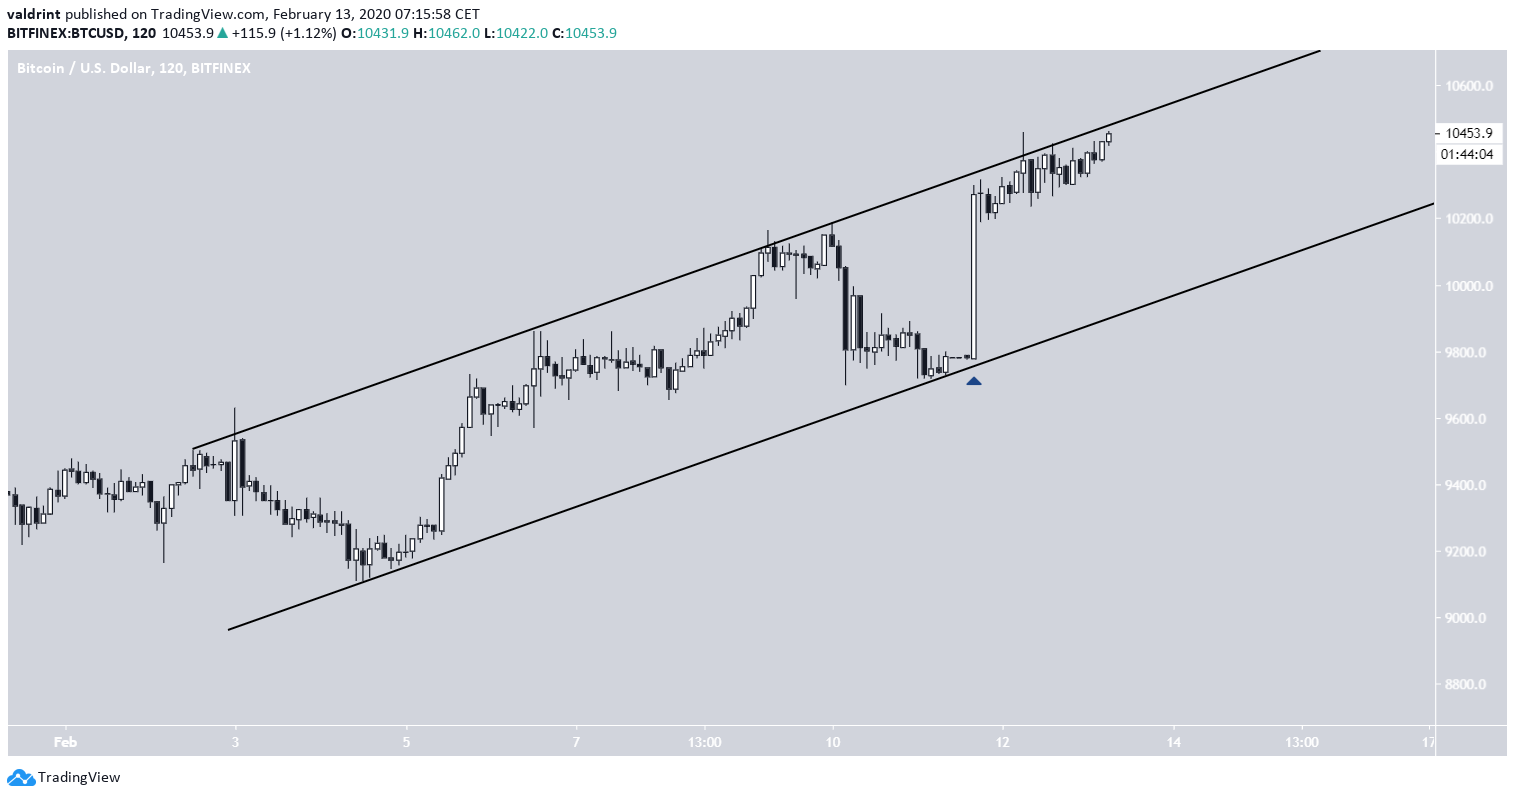
On Feb 11, the Bitcoin price initiated a strong pump and increased by five percent within one hour. The price has been increasing gradually since.
Bitcoin Price Highlights
- The Bitcoin price is trading inside a short-term ascending channel.
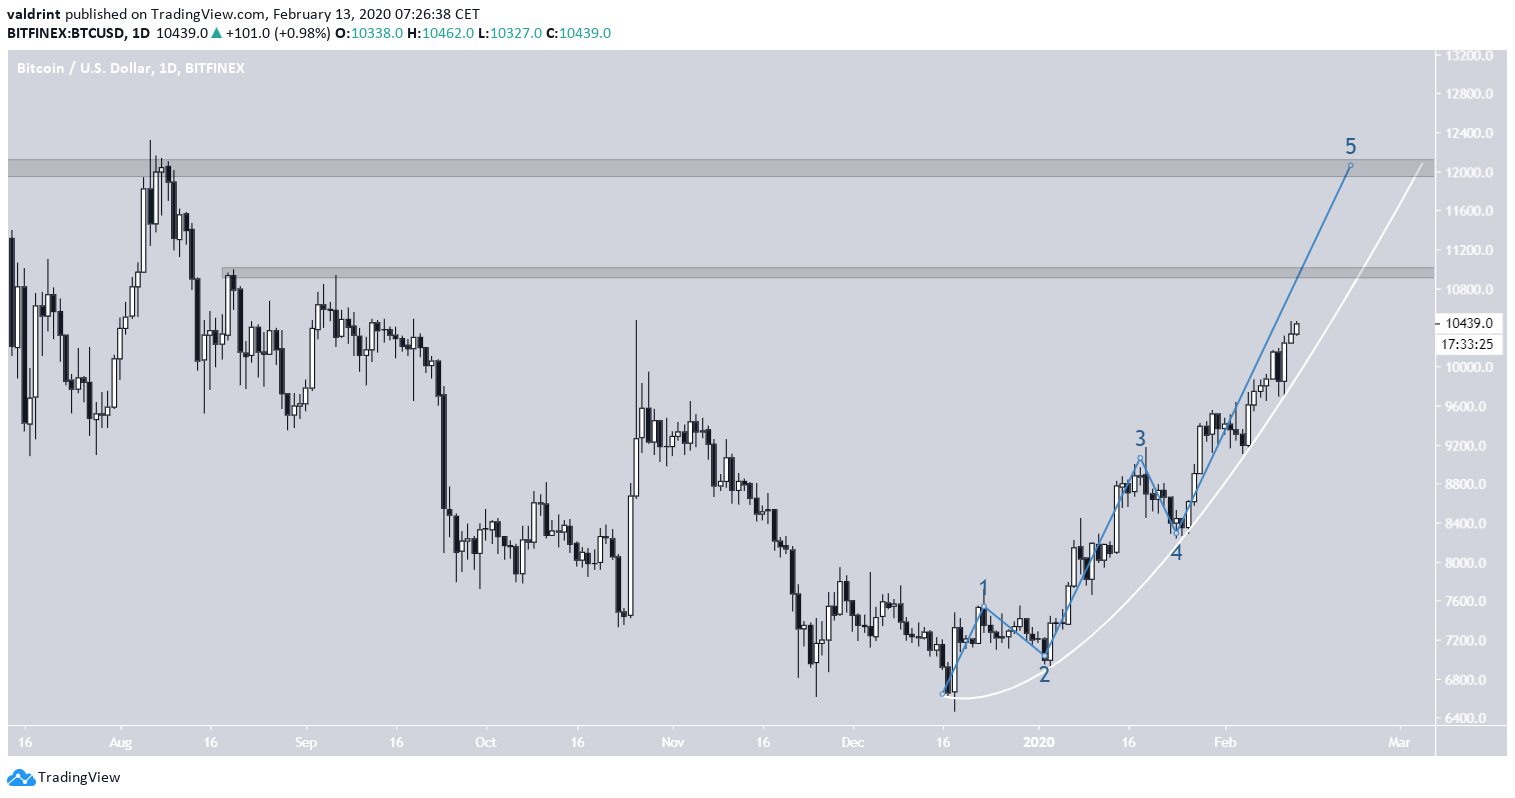
- There is resistance at $11,000 & $12,000.
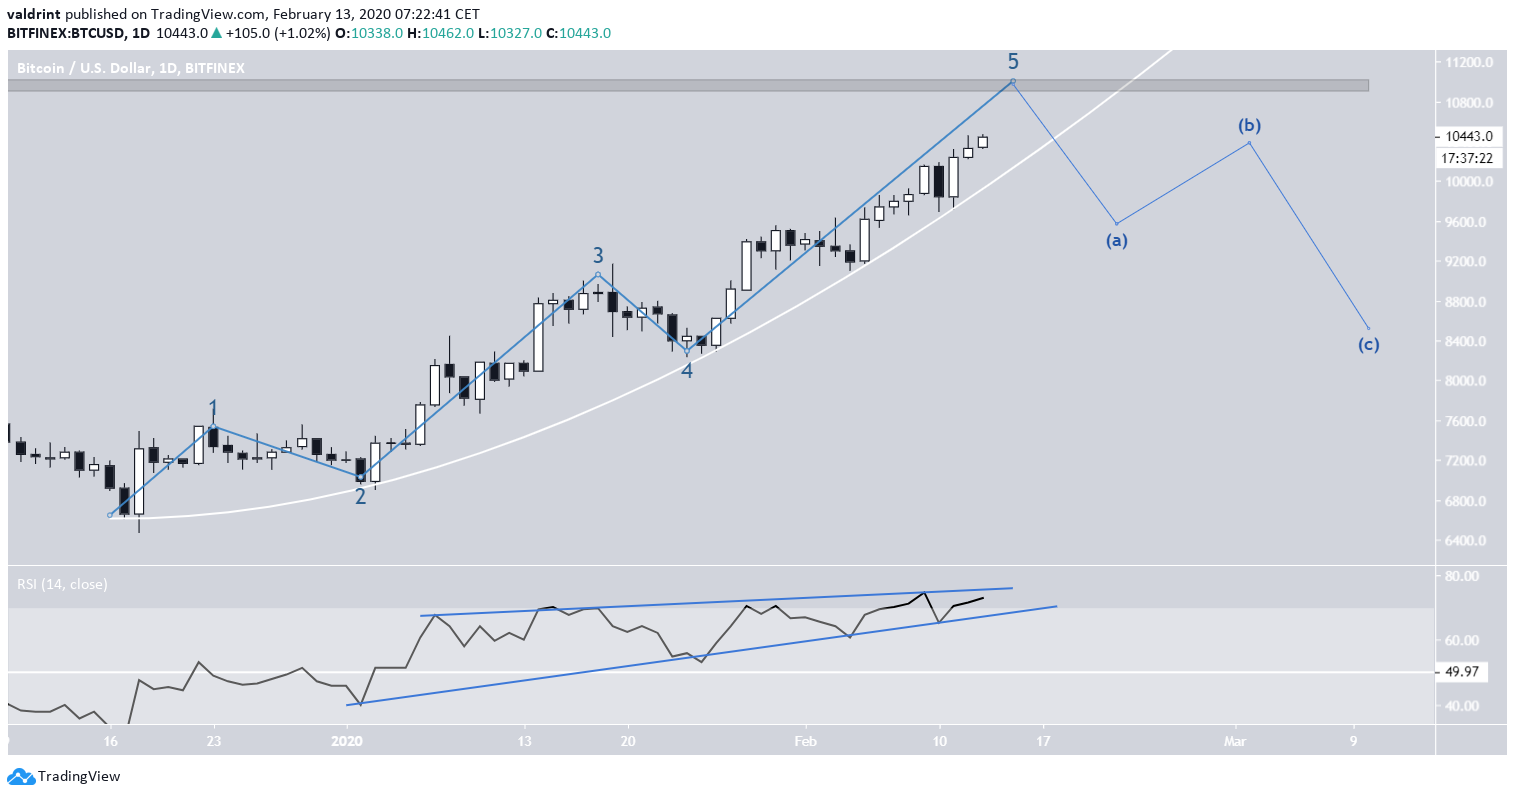
- Bitcoin is following a parabolic ascending support line.
Ascending Bitcoin Channel
Since February 3, the BTC price has been trading inside a steep ascending channel. It is currently very close to the resistance line of this channel, where it has been since it initiated the aforementioned pump (blue arrow). If the price continues to increase at the rate predicted by the channel, it will reach the $11,000 resistance area by Feb 18, at the latest.
Elliott Formation
The Bitcoin price has been following a parabolic ascending support line since December 15, 2019. The price movement resembles a five-wave Elliott formation and it looks as if the price is nearing the end of the fifth wave. A retracement is expected afterward that could take the shape of an A-B-C correction. The daily RSI supports this decrease since it has been trading inside an ascending wedge into overbought territory. One possible outline for this correction is given in the graph below. The most probable level for the top of the current wave would be at the resistance area of $11,000. A more bullish possibility would be for the Bitcoin price to create an extended wave five that goes all the way to the next resistance area at $12,000. Extended wave fives are not uncommon.
By the slope of the ascending support line, we can determine that this area could be reached by the end of February.
While at the current time we cannot know with certainty whether the Bitcoin price will get there, the price movement if/once the price reaches $11,000 will be helpful in determining if it will. The daily RSI has yet to show any signs of weakness, so the current bullish trend is still intact. A breakdown from the ascending wedge in the previous image would invalidate this possibility.
 To conclude, the Bitcoin price created a strong bullish candlestick on February 11 and has been increasing since. We believe the increase will continue until the price reaches at least one of the resistance areas outlined above.
For those interested in BeInCrypto’s previous Bitcoin analysis, click here.
Top crypto platforms in the US
Disclaimer
In line with the Trust Project guidelines, this price analysis article is for informational purposes only and should not be considered financial or investment advice. BeInCrypto is committed to accurate, unbiased reporting, but market conditions are subject to change without notice. Always conduct your own research and consult with a professional before making any financial decisions. Please note that our Terms and Conditions, Privacy Policy, and Disclaimers have been updated.

Valdrin Tahiri
Valdrin discovered cryptocurrencies while he was getting his MSc in Financial Markets from the Barcelona School of Economics. Shortly after graduating, he began writing for several different cryptocurrency related websites as a freelancer before eventually taking on the role of BeInCrypto's Senior Analyst.
(I do not have a discord and will not contact you first there. Beware of scammers)
READ FULL BIO
Sponsored
Sponsored
![Bitcoin Analysis for 2020-02-13 [Premium Analysis]](https://beincrypto.com/wp-content/uploads/2020/01/bic_BTC_speed_bitcoin.jpg.optimal.jpg)