


![Bitcoin Analysis for 2020-02-03 [Premium Analysis]](/_mfes/post/_next/image/?url=https%3A%2F%2Fassets.beincrypto.com%2Fimg%2FSZ9x2MRGZkOJUPcTmdkZb5itgtM%3D%2Fsmart%2F4de7421d806140df984f74f8ea6ad1db&w=1920&q=75)
Over the previous week, the price of Bitcoin increased considerably, creating a bullish candlestick. However, it failed to reach a close above a significant resistance area. It now looks that it will soon break above resistance, keeping the current support line intact.
Bitcoin Price Highlights
- The Bitcoin price is trading above its 50-week moving average (MA).
- There is long-term resistance at $9,350.
- There is long-term support at $7,450.
- The price is following a parabolic ascending support line.

Bitcoin Weekly Outlook
Last week the Bitcoin price increased considerably, creating a bullish engulfing candlestick in the process. However, the price failed to reach a close above the previous breakdown level at $9,350. This would allow for the price to head towards the range highs above $13,000.
The price is trading above its 50-week moving average. So, even though it is at a significant resistance area, the weekly outlook is bullish.
The primary support area is found at $7,450.

Parabolic Support
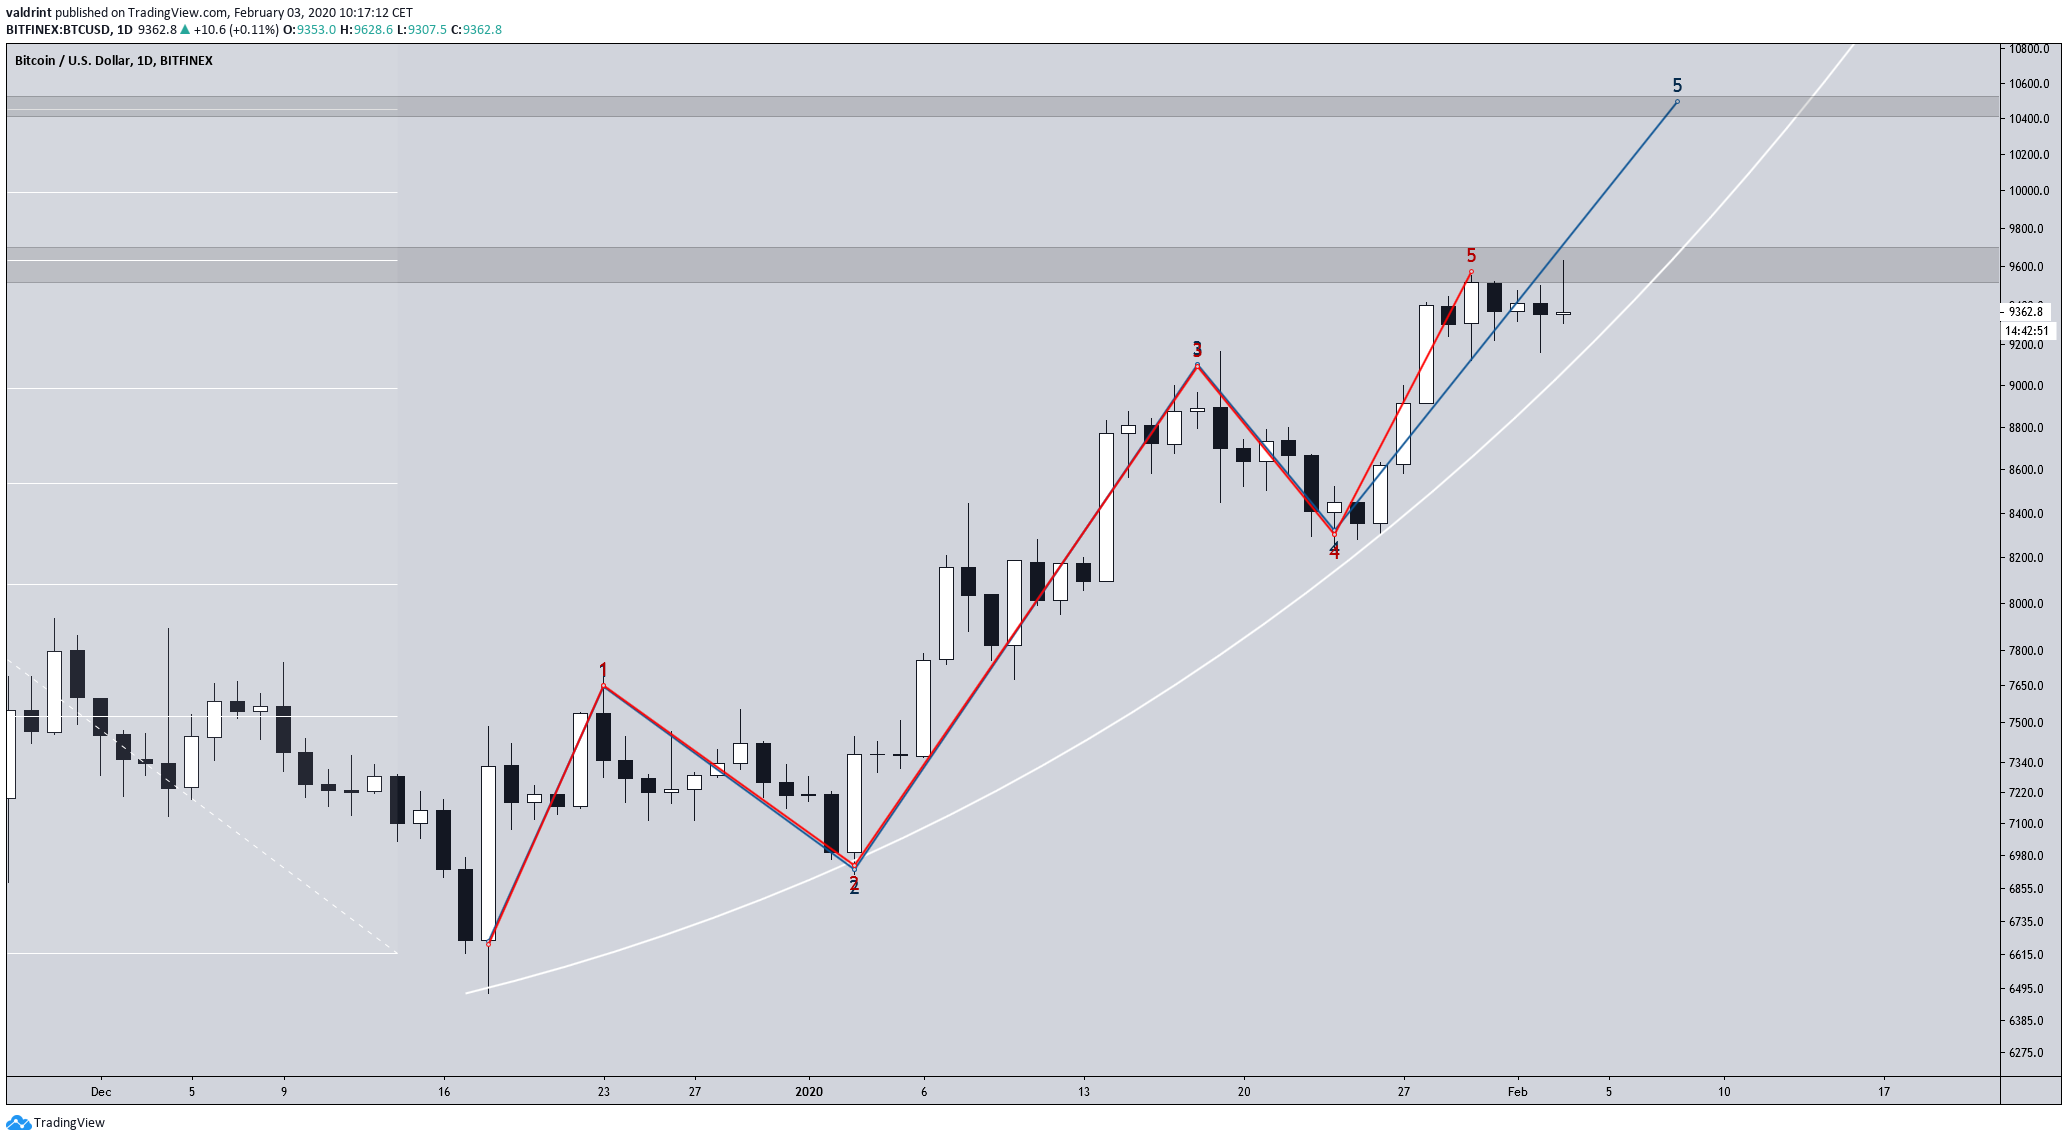
The Bitcoin price has been following a parabolic ascending support line since Dec 17, 2019.
The price movement closely resembles a five-wave Elliott formation. Currently, the price is likely in the fifth and final wave of this formation.
There are two ways this formation might unfold. Either the price bounces on this support line and rapidly increases towards $10,400, completing an extended fifth wave or the price breaks down and initiates a rapid decrease towards $8,000.
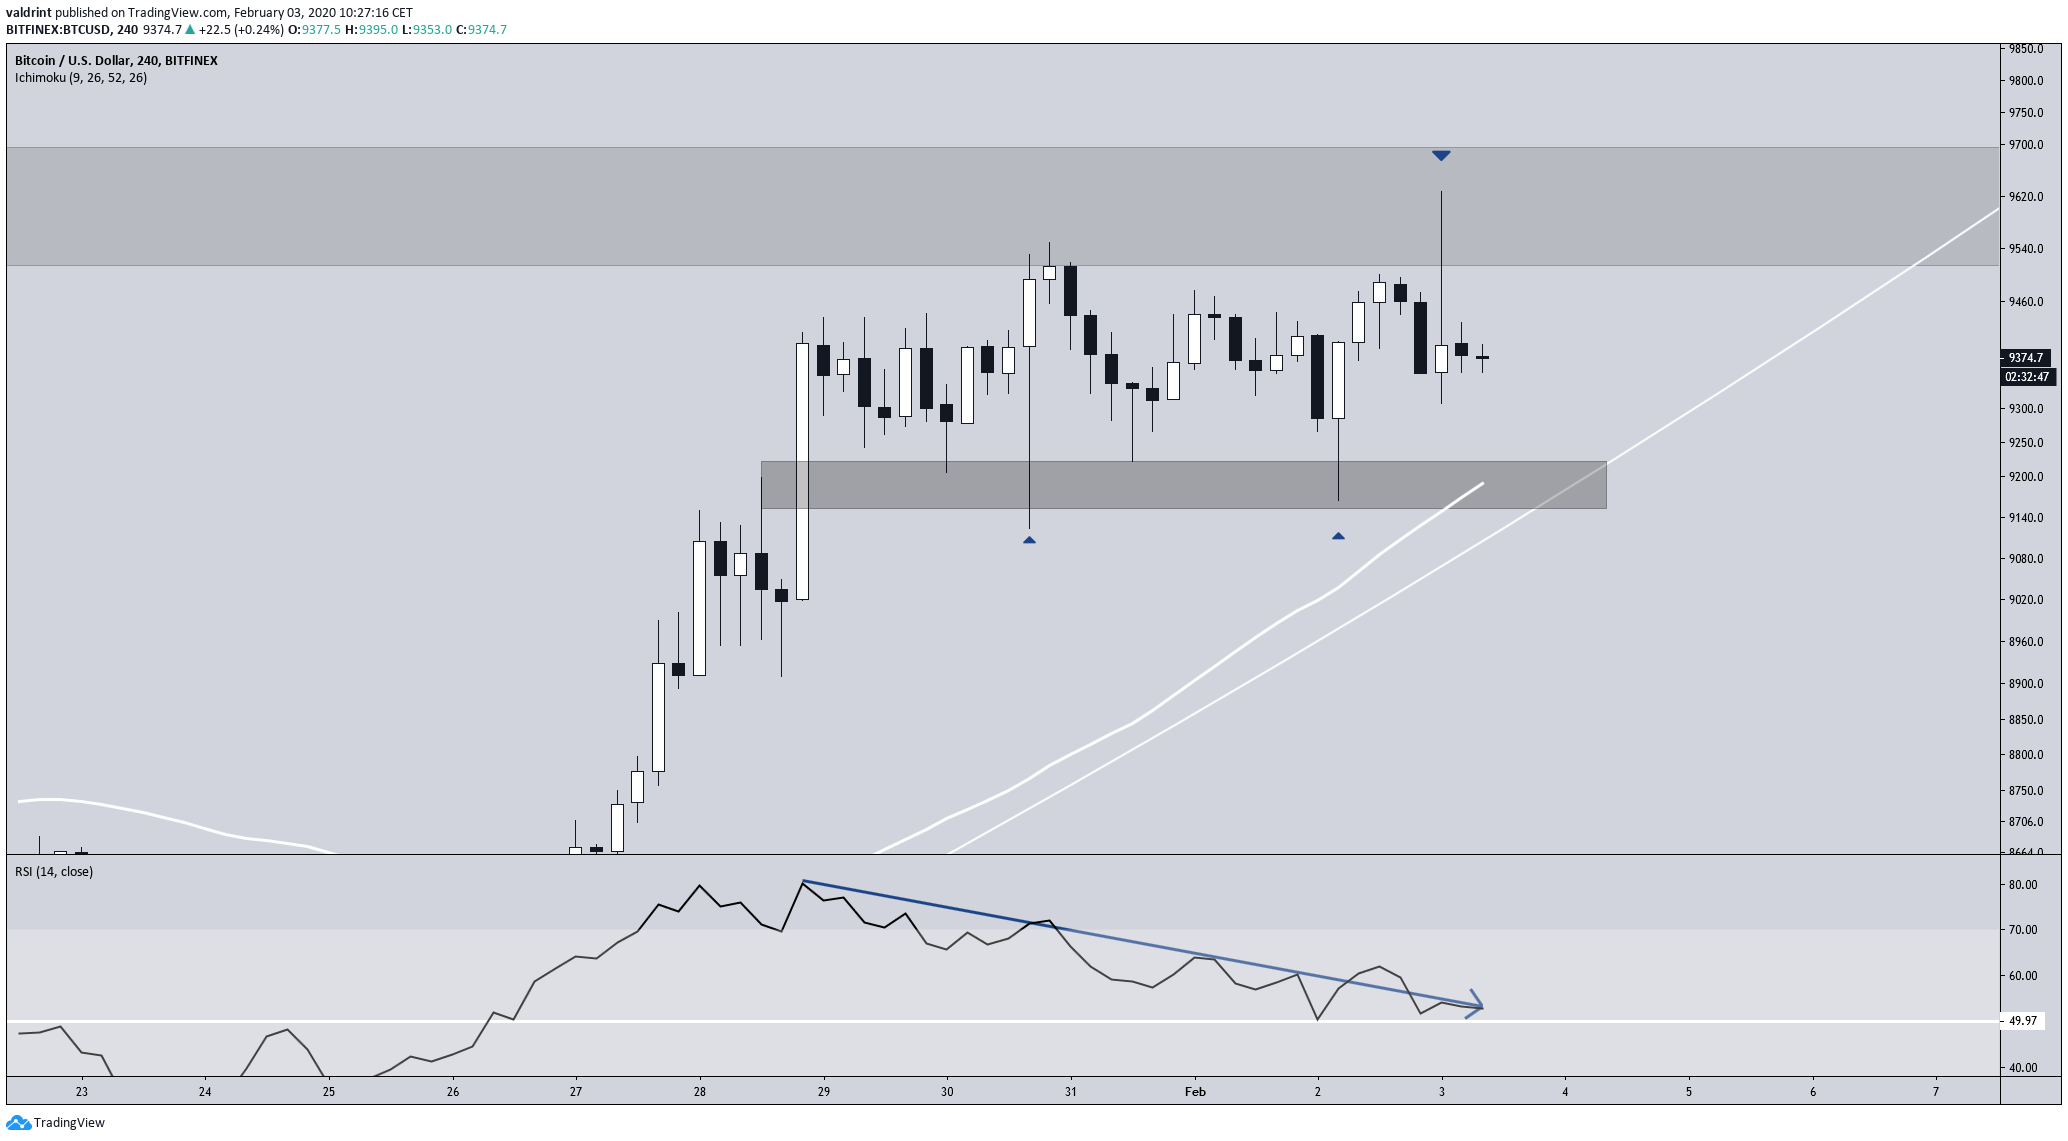
In the short-term, the price created two long lower wicks inside the $9,200 minor support and moved upward. This support area also coincides with the 200-hour moving average.
However, the price created a similarly long upper wick afterward when it made a failed breakout attempt. In addition, the RSI has been generating a bearish divergence but has stayed above 50.
Thus, there are some bullish and bearish indicators giving mixed signals.
Future Movement
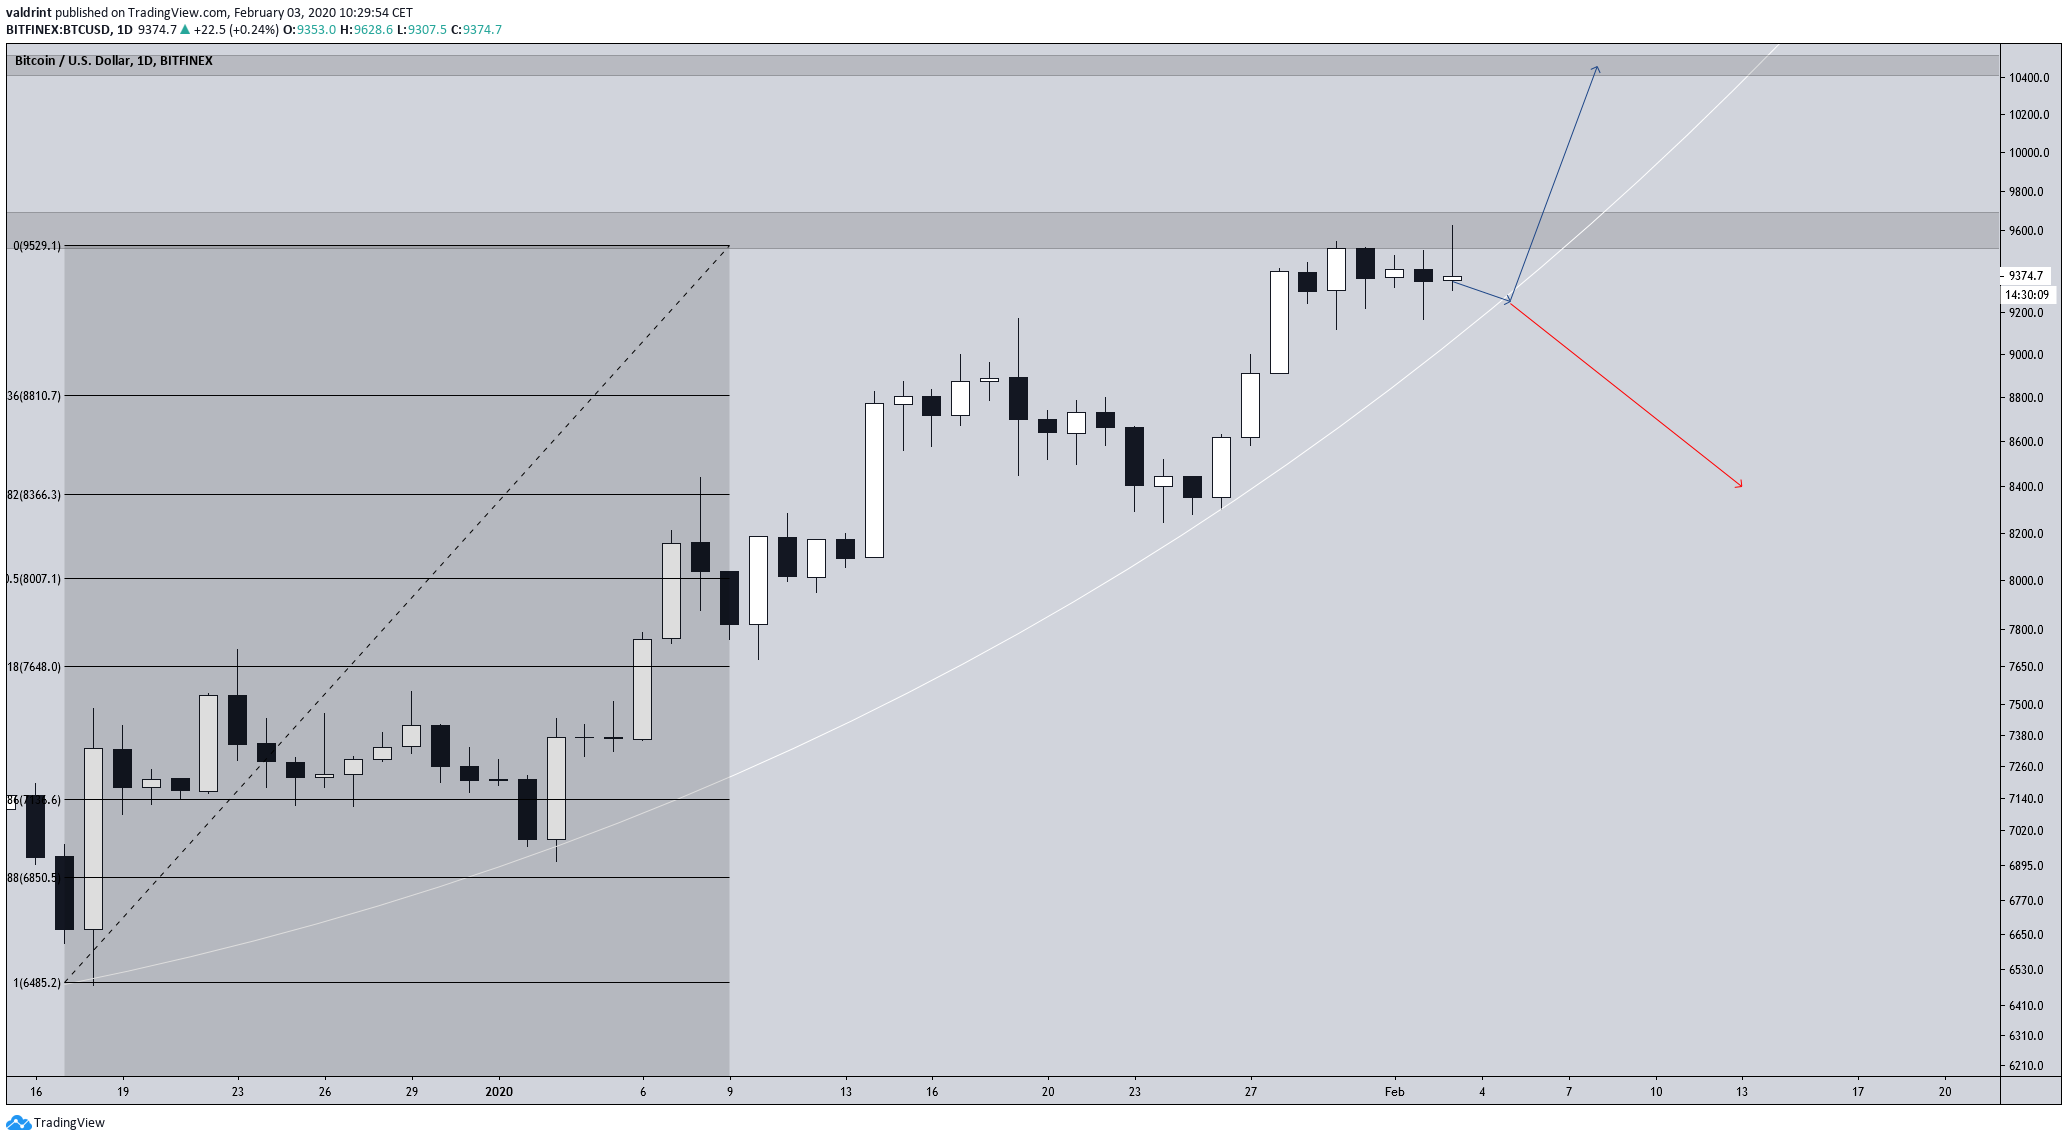
Out of the two outcomes outlined above, the bullish scenario has a better chance of transpiring, mostly because the current trend is bullish and the weakness shown from the price is not significant enough to predict a decrease.
Thus, the expected price movement would be a decrease to validate the support line, followed by a bounce above $10,000
The use of a stop loss below $9,000 could be beneficial in mitigating losses but still allow investors to rake in profits in case of an upward move.
To conclude, the BTC price has reached a very important resistance level. It will likely be successful in moving above this zone to head towards $10,000.
For those interested in BeInCrypto’s previous Bitcoin analysis, click here.


