![Bitcoin Analysis for 2020-01-30 [Premium Analysis]](/_mfes/post/_next/image/?url=https%3A%2F%2Fassets.beincrypto.com%2Fimg%2F0Fzo-OdpVr3R9QGYlmwcfbEsGD4%3D%2Fsmart%2F9676ac43b35f488682dfa5d4455def46&w=1920&q=75)
The Bitcoin price has created a very short-term ascending triangle. It looks poised to break out and reach the resistance area at $9,600.
Bitcoin Price Highlights
- The Bitcoin price is following a parabolic ascending support line.
- It has created a short-term ascending triangle.
- It may be in the fifth, and final wave, of an Elliott formation.
- There is resistance at $9,600 and $11,100.
- There is support at $9,100.
Ascending Support
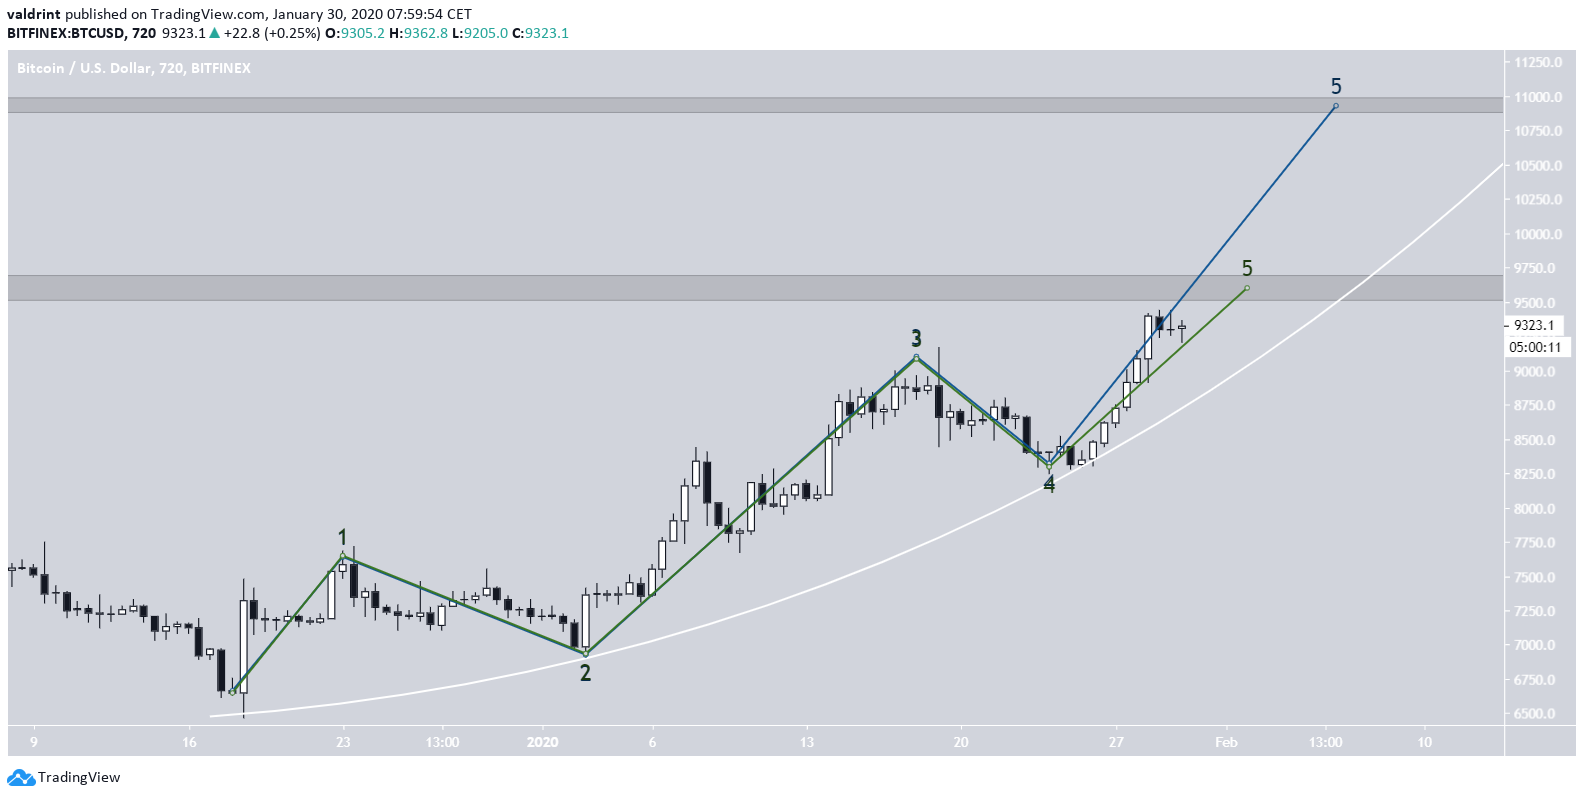
The Bitcoin price has been following a curved ascending support line since reaching a low on Dec 17, 2019.
The price movement since then resembles a five-wave Elliott formation, which indicates that it’s likely in the final wave.
The anticipated target for this wave is found at $9,600. However, there is a more bullish possibility in which the price creates an extended fifth wave and increases all the way to $11,000.
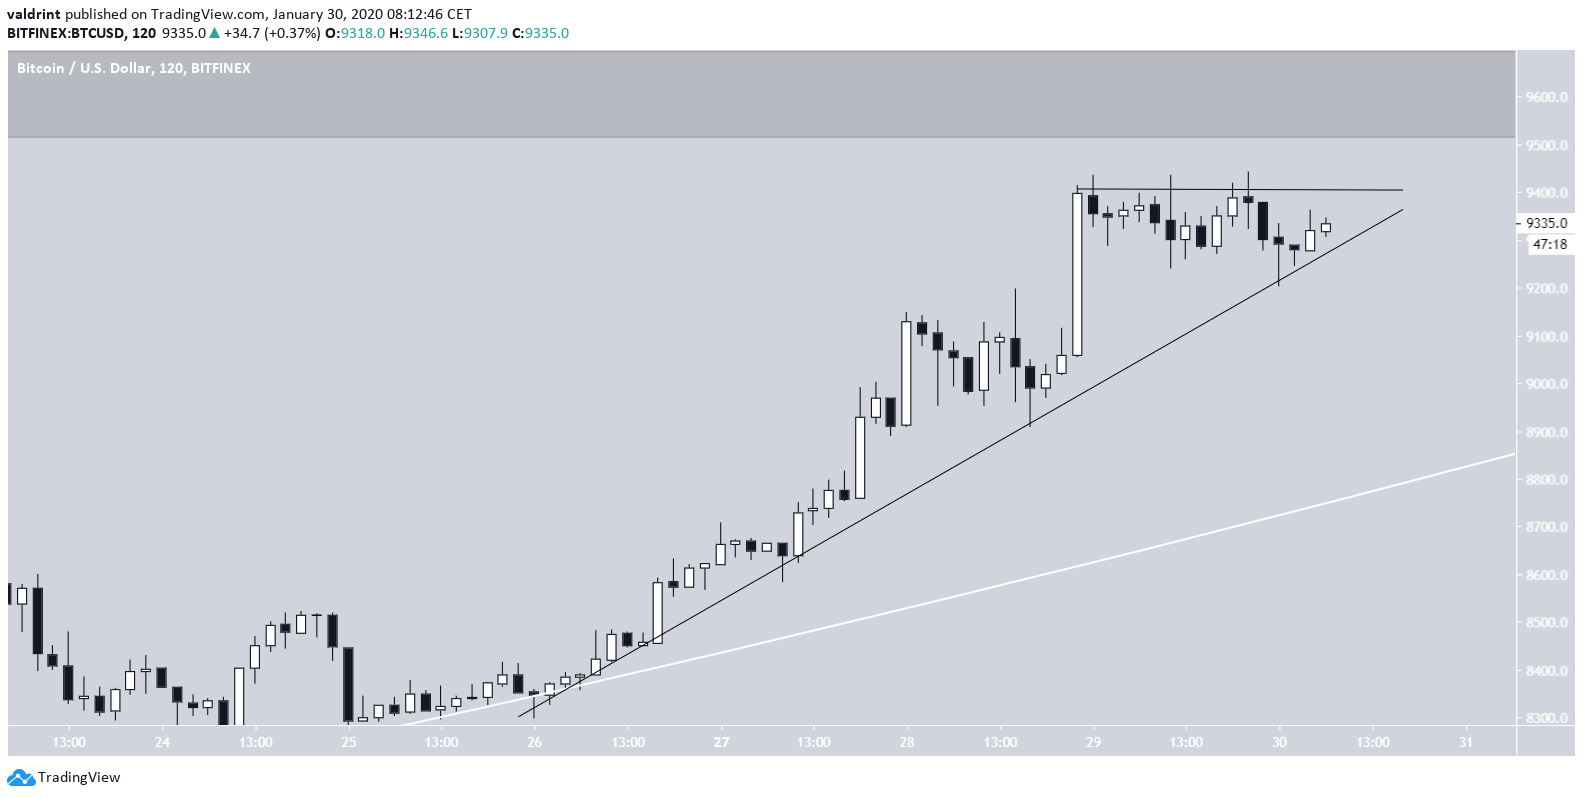
During the formation of this wave, the BTC price looks like it is following an ascending support line. Yesterday, the price made several attempts at moving above $9,400, all unsuccessful.
This created an ascending triangle, which is projected to end later today.
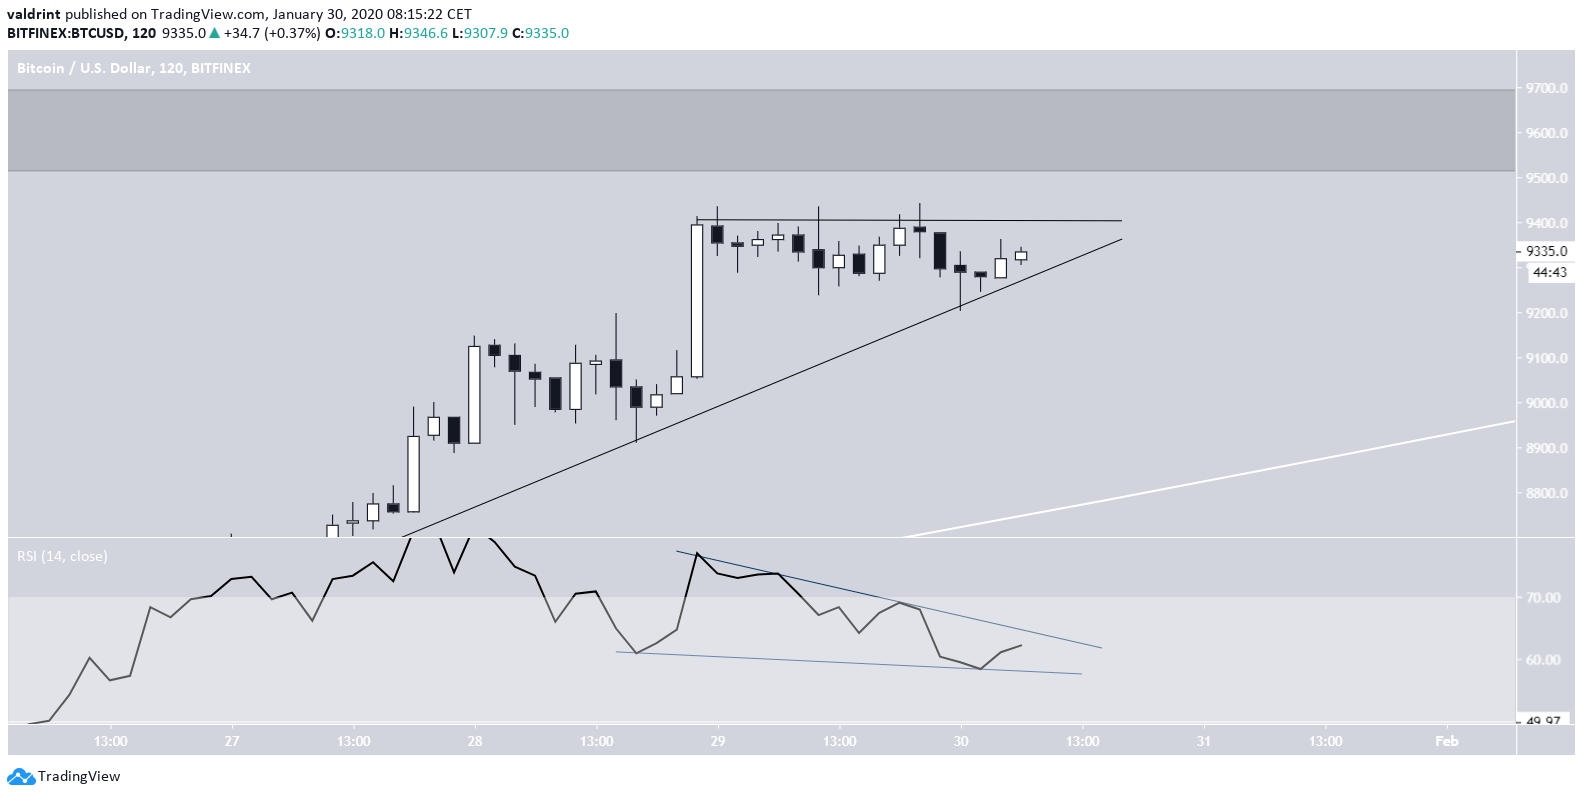
RSI Divergence
After the RSI generated bearish divergence during the top, a small decrease followed. But, the price did not break down from the ascending support line and the RSI created a descending wedge, out of which a breakout is expected.
Therefore, the price breaking out from this newly created triangle and reaching the resistance area at $9,600 is expected. The presence or absence of reversal signs once it gets there will determine whether the price continues to increase towards $11,100 or begins a corrective period.
To conclude, the Bitcoin price is likely in the fifth, and final wave, of an Elliott correction. A breakout from the current short-term pattern could take it to the resistance area at $9,600.
For those interested in BeInCrypto’s previous Bitcoin analysis, click here.
