


![Bitcoin Analysis for 2020-01-16 [Premium Analysis]](/_mfes/post/_next/image/?url=https%3A%2F%2Fassets.beincrypto.com%2Fimg%2F5OxM4Gb2yzL2VgNpXWfEEZvwhfU%3D%2Fsmart%2F85b1fcb31bf24357ba22c0f7247ee1e5&w=1920&q=75)
Bitcoin Price Highlights
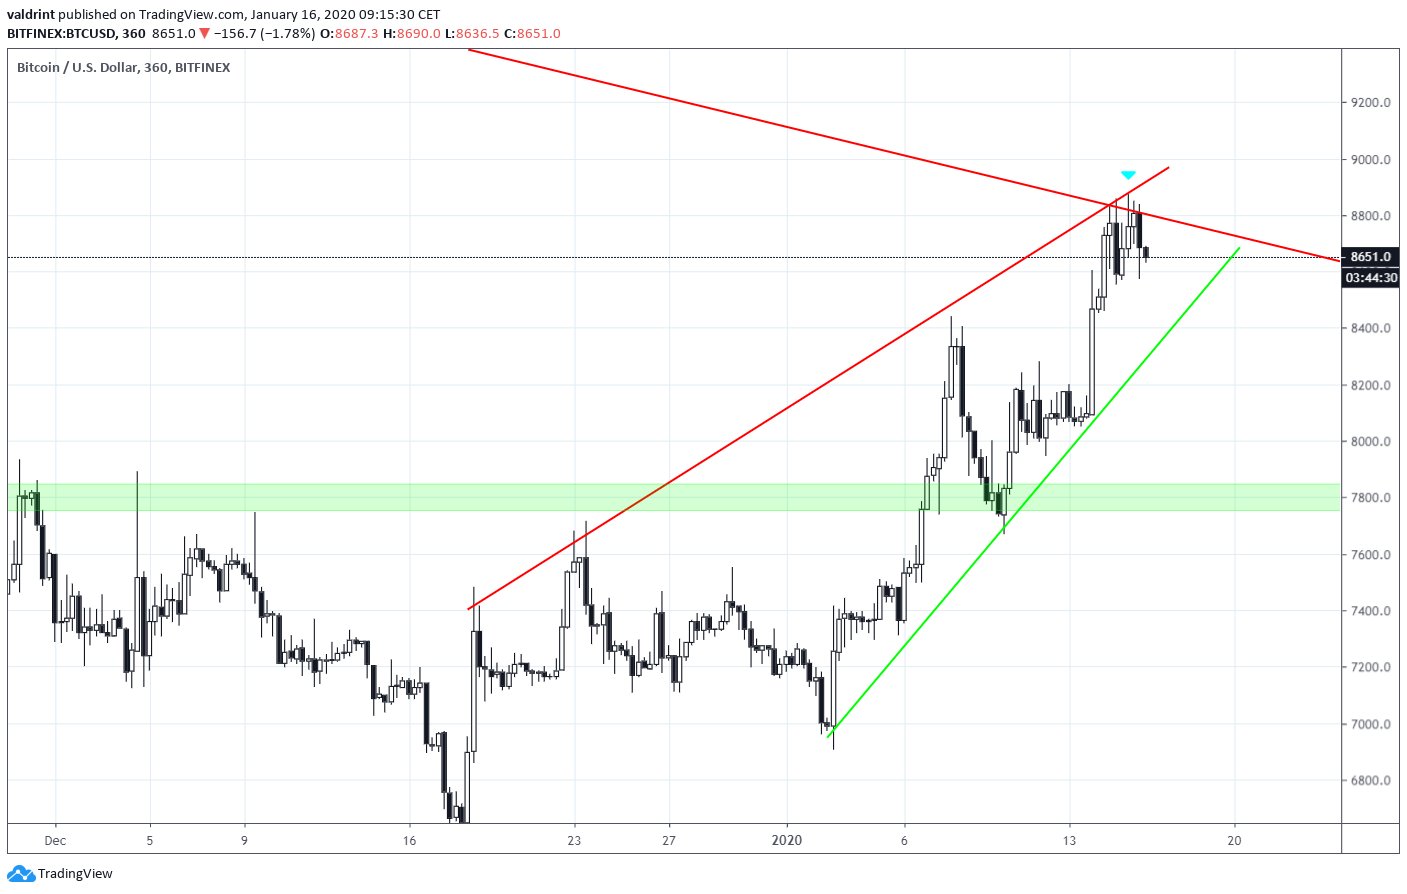
- The Bitcoin price is trading inside of a descending wedge.
- The price has made two unsuccessful attempts at breaking out.
- There is support at $7800.
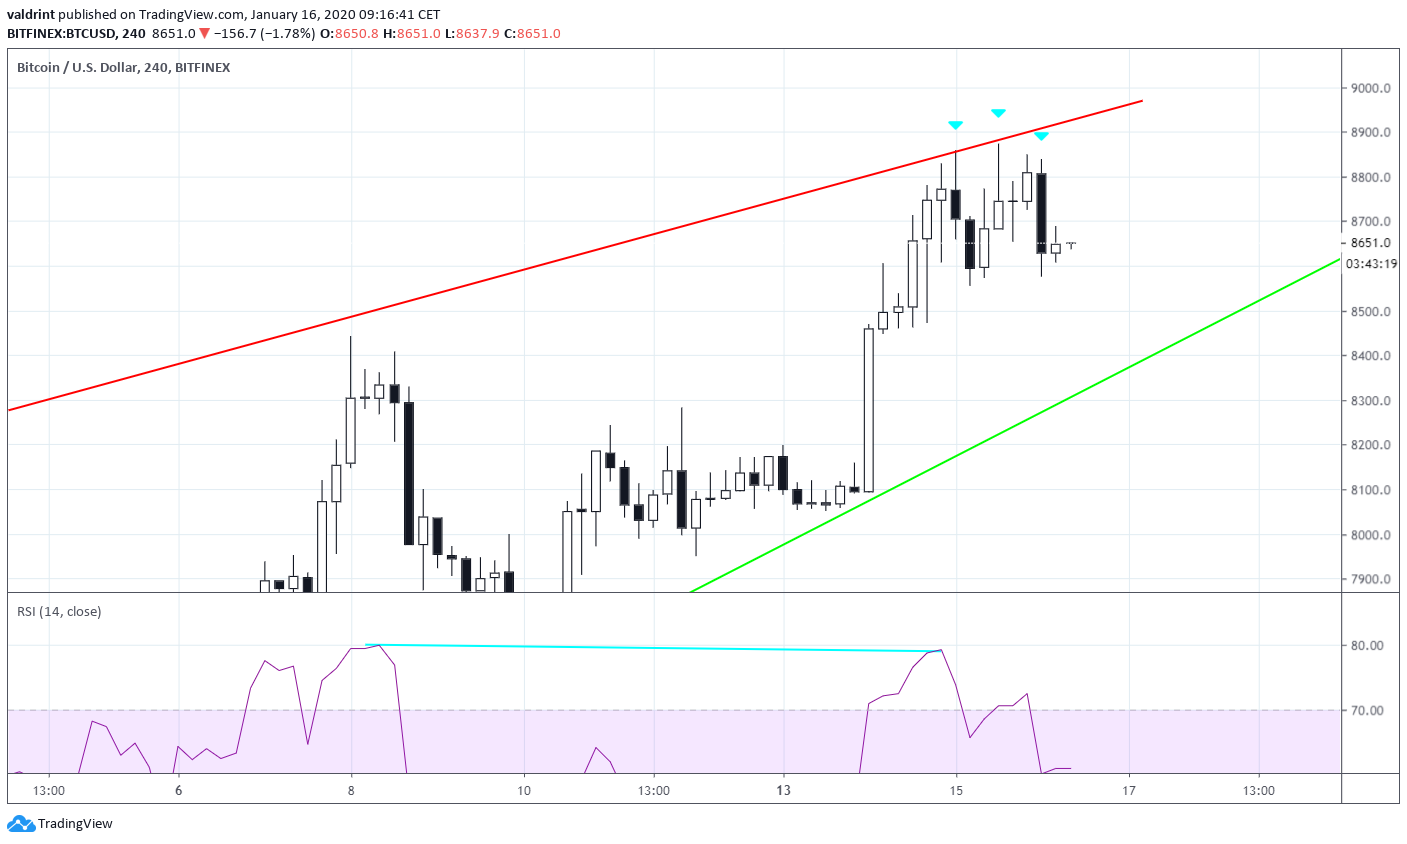
- The RSI has generated bearish divergence.
- Candlestick characteristics are bearish.
Bitcoin in an Ascending Wedge
The Bitcoin price is still trading inside the same descending wedge. It has reached the convergence of the resistance line of the wedge and the descending channel. While it has made some attempts, it has been unsuccessful in breaking out. The strongest support area is found at $7800.
The candlestick characteristics are bearish. The Bitcoin price has created long upper wicks each time it has reached values close to $8900. It created a shooting star (middle), before following it up with a bearish engulfing candlestick.
Combining this with the bearish divergence in the RSI, we can assume that the price will fall towards the support line of the wedge.
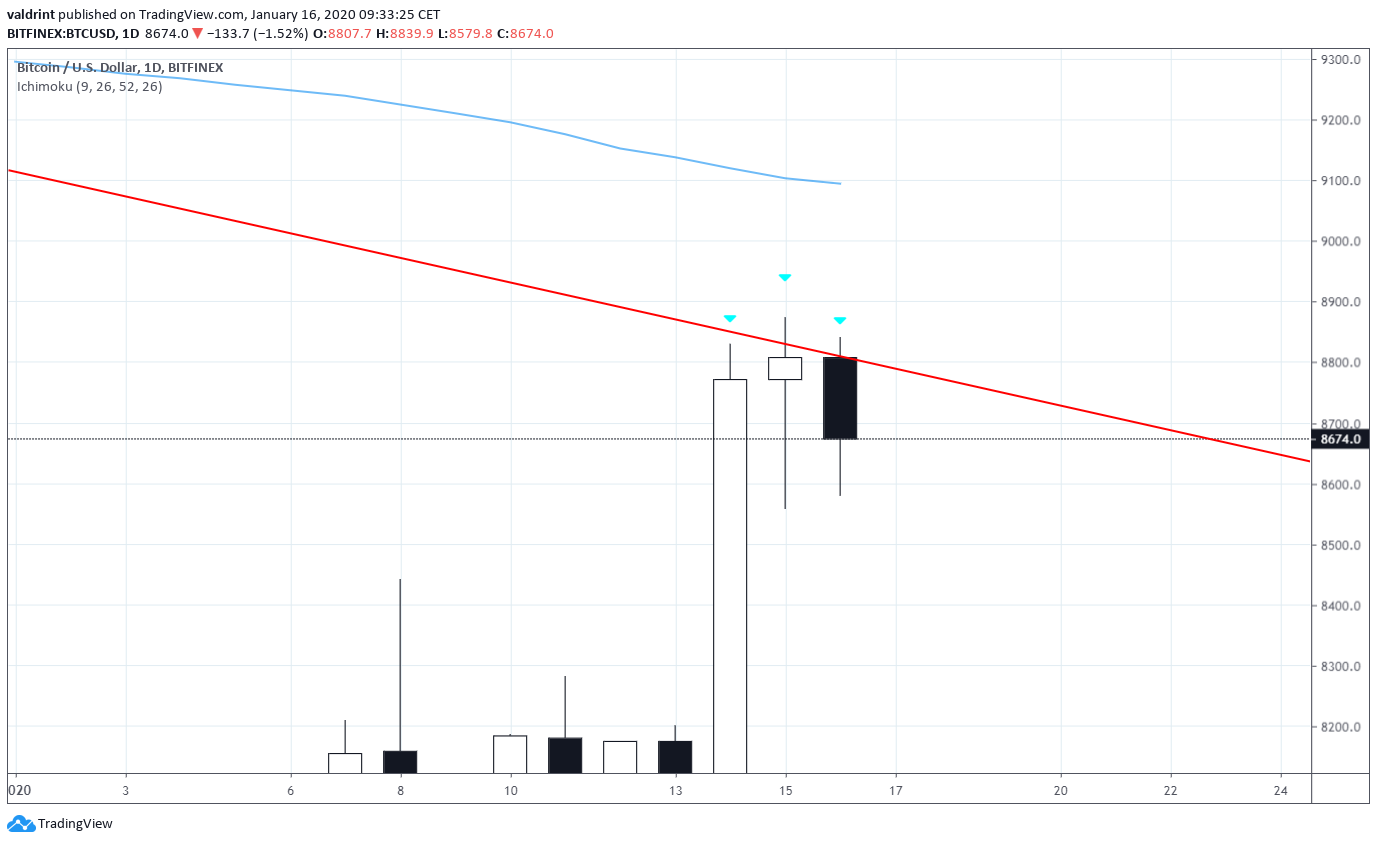
Evening Star
Inside the daily time-frame, it is possible that BTC will create an evening star pattern. This pattern consists of three candlesticks, a bullish engulfing candlestick, followed by one with a short body and long wicks in both directions and finalized with a bearish engulfing candlestick.
If during the day the price decreases to the support line of the wedge or breaks down from it, the pattern will be completed.
Finally, besides the resistance lines, the 200-day moving average (MA) is slightly above the current price.
Long-Term
In the long-term logarithmic chart, the Bitcoin price has bounced at the ascending support line in place since 2011. In addition, this was a bounce at the 0.618 Fib level, making it a very likely place for the long-term bottom, which we believe has already been reached.
A breakout above the current resistance line, which we think will eventually happen, would confirm that the downward trend has ended and the price will continue to move upward. We expect the rate of increase to accelerate after Bitcoin’s block-reward halving (vertical line) which is scheduled to fall on May 2020.
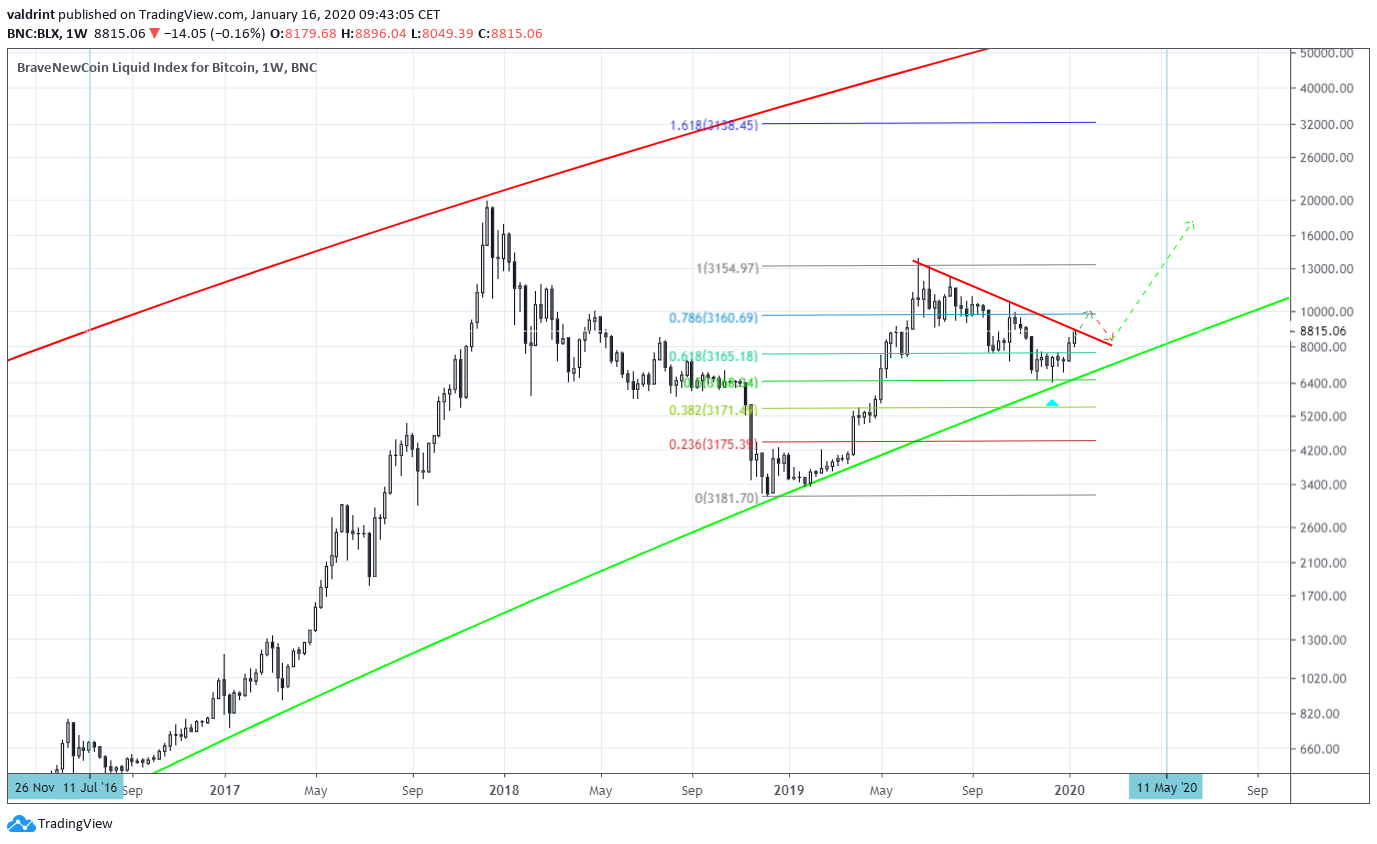
To conclude, the Bitcoin price has reached the resistance line of the long-term descending channel. While we believe the price will fail to break out on the current attempt, it will likely break out afterward, confirming that a new upward trend has begun. The short-term outlook is bearish, while the medium and long-term forecasts remain bullish.
Good luck and happy trading! For our previous analysis, click here.


