


![Bitcoin Analysis for 2020-01-15 [Premium Analysis]](/_mfes/post/_next/image/?url=https%3A%2F%2Fassets.beincrypto.com%2Fimg%2FyeElHeW_jItz1kMOkbB4u8MKoaw%3D%2Fsmart%2Fa78211dccc674645999b6960cd84c361&w=1920&q=75)
Bitcoin Price Highlights
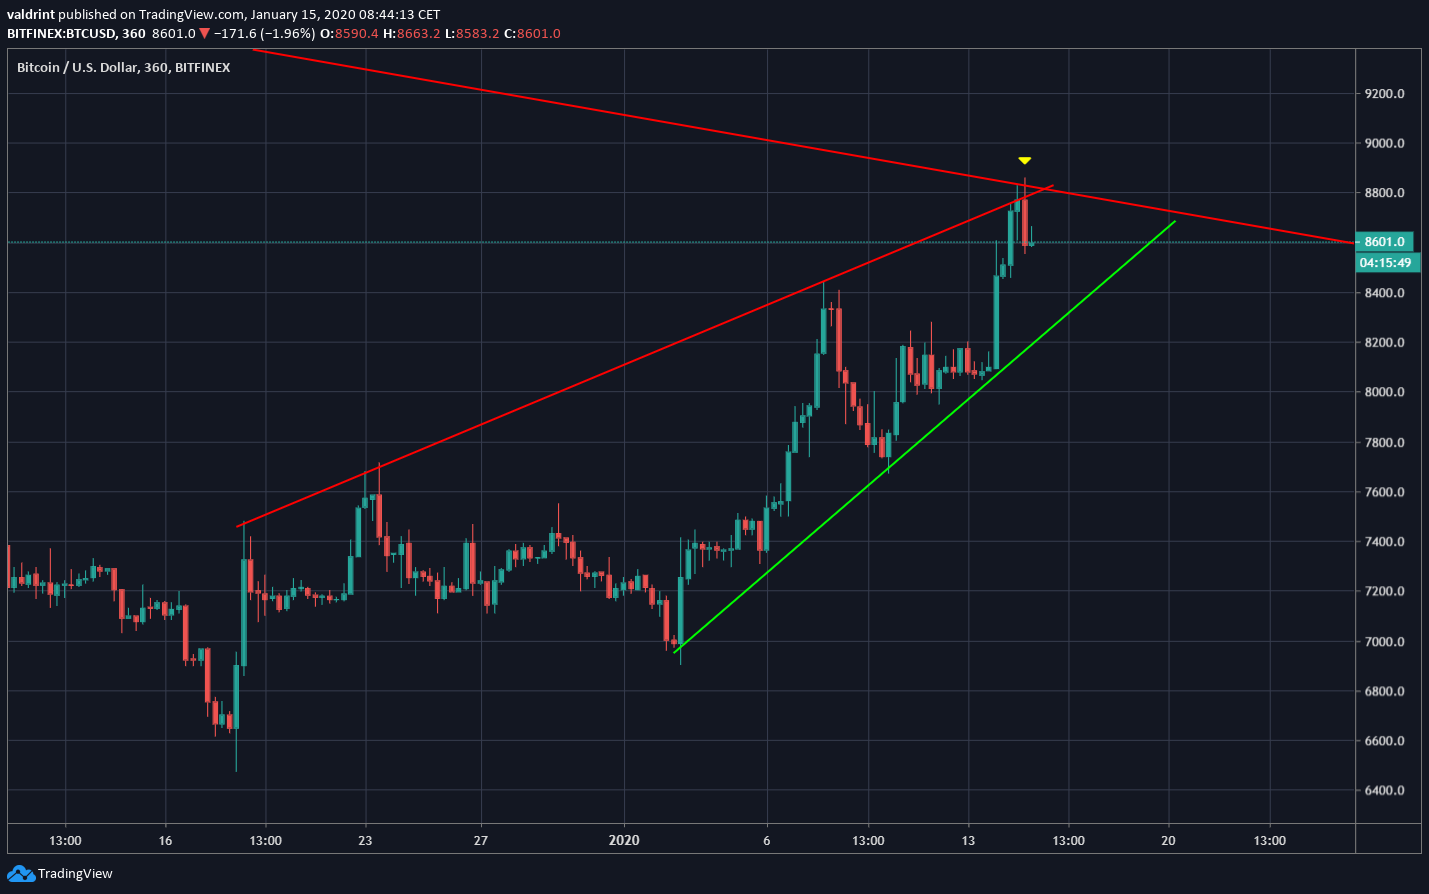
- The Bitcoin price is trading inside an ascending wedge.
- It has reached the resistance line of its descending channel.
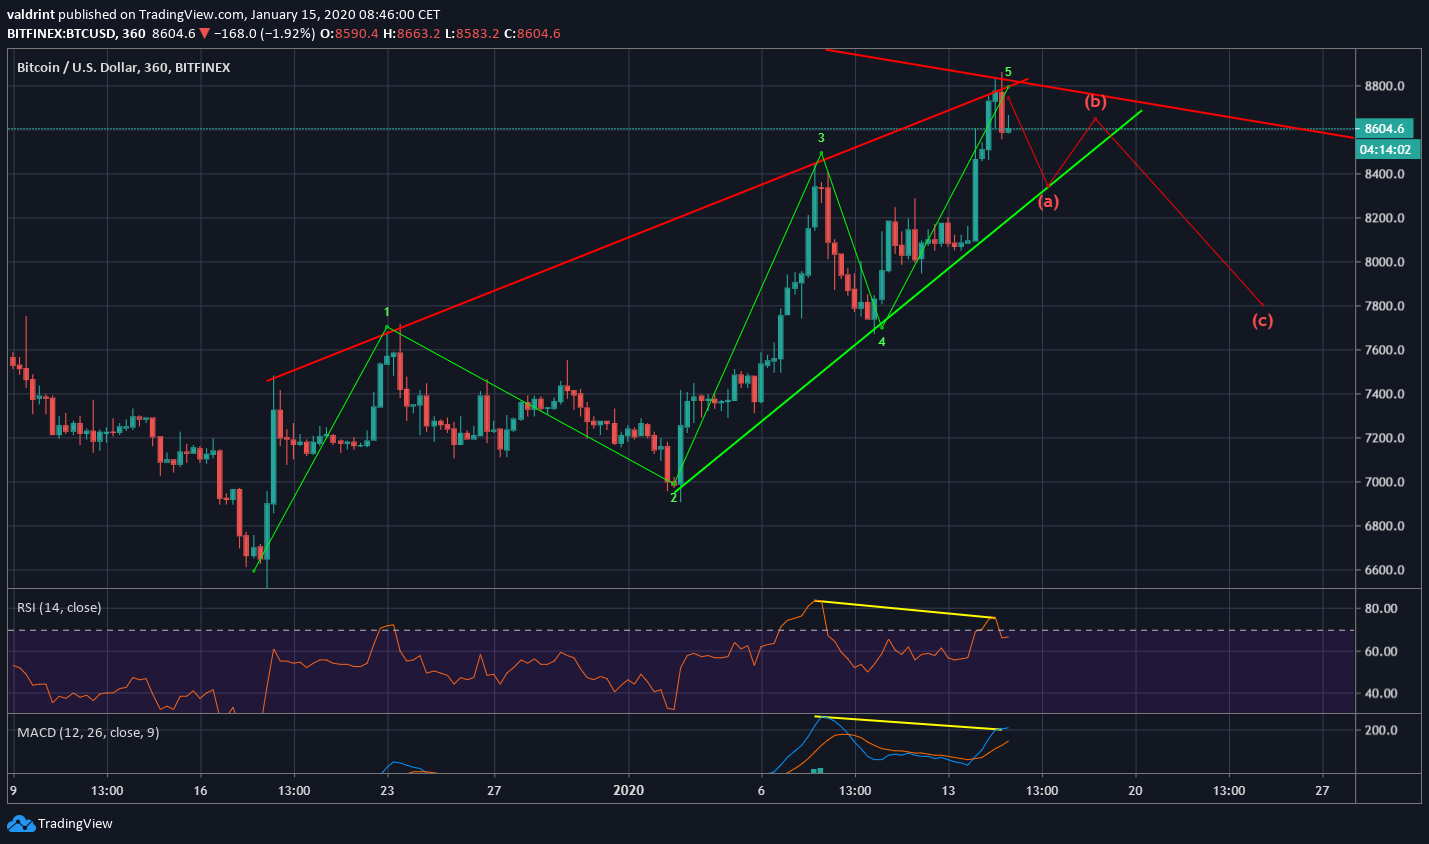
- The price has possibly finished a five-wave Elliott formation.
- There is a bearish divergence in both the RSI and MACD.
- The price has almost reached the 200-day moving average (MA).
Bitcoin’s Ascending Wedge
The Bitcoin price is likely trading inside an ascending wedge, which is considered a bearish pattern. The price has reached the resistance line of the wedge, which also coincides with the resistance of the long-term channel, making it a very likely place for the top of the current movement.
In addition, the price created a large bearish candlestick with an upper wick. But, it has yet to close below the previous bullish candlesticks opening price, which would confirm that the top has been reached.
The price movement closely resembles a five-wave Elliott formation. It seems that the price has just finished the fifth wave. What could follow is an A-B-C correction, with the A wave bouncing on the support line while the C-wave constitutes a breakdown.
This possibility is supported by the strong bearish divergence in both the RSI and the MACD. A likely target for the breakdown would be between $7,600-$7,800.
Moving Averages
The daily chart reveals that the price has just reached the 0.382 fib level of the previous decrease. Additionally, the position of the 200-day MA further strengthens the overhead resistance of the line and makes it unlikely that the price will break out immediately.
However, yesterday’s bullish engulfing candlestick shows that the price has broken out above the previous resistance without any trouble. A breakout above the resistance line and the MA would confirm that the downward trend that began on June 24, 2019, has ended.

To conclude, the Bitcoin price has reached the resistance line of the ongoing downward trend. It seems most likely that the price will not be successful in breaking out this time around, and will retrace before making another attempt. The short-term outlook is bearish, while the medium and long-term forecasts remain bullish.
Good luck and happy trading! For our previous analysis, click here.


