


![Bitcoin Analysis for 2019-12-23 [Premium Analysis]](/_mfes/post/_next/image/?url=https%3A%2F%2Fassets.beincrypto.com%2Fimg%2FKxFyx11EyGI3o2a_wZhtwknHCrc%3D%2Fsmart%2F5234ad5c956f481a919bc6fb79f08a1b&w=1920&q=75)
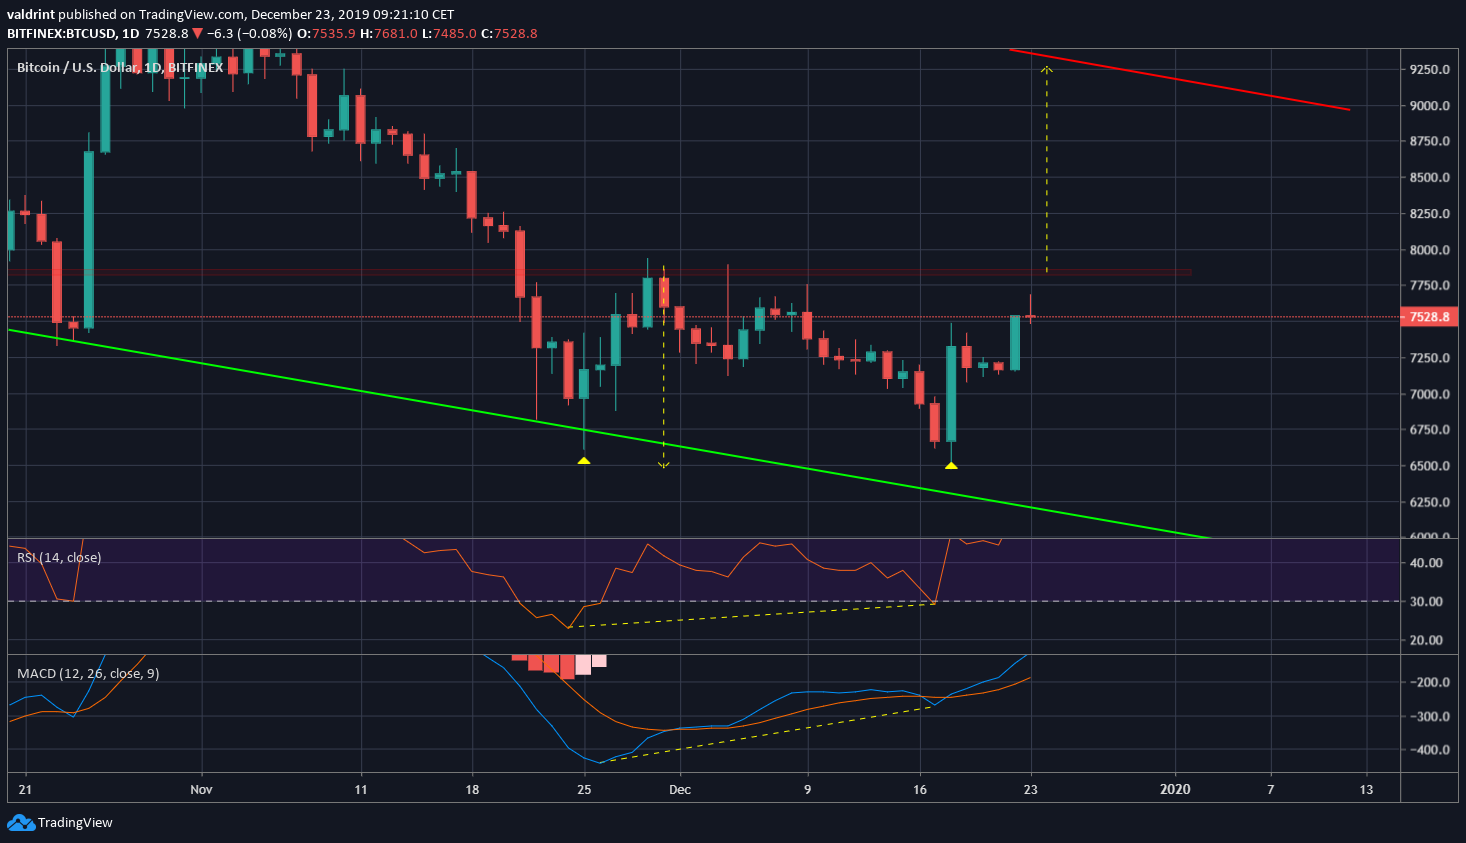
The Bitcoin price has made a double bottom and has broken out above a descending resistance line. Based on the height of the double bottom, if the price breaks out above the current resistance area, it could reach $9000 within two weeks.
Bitcoin Price Highlights
- The Bitcoin price has broken out above a descending resistance line.
- It has possibly made a double bottom.
- The weekly outlook is turning bullish.
- There is resistance until $7800.
Descending Resistance Line
The Bitcoin price has been following a descending resistance line since November 20. On December 22, the price broke out above this resistance. The breakout transpired with a small amount of volume, reducing its significance.

Since November 20, we can outline five minor resistance and support areas. Support areas are found at:
- $6650
- $6900
- $7200
Resistance areas are found at:
- $7500
- $7800

Double Bottom
The Bitcoin price has made a double bottom at $6500 on November 25 and December 18. This is considered a bullish pattern. It was combined with a bullish divergence in both the RSI & the MACD.
If the price were to break out and move upward the entire height of the pattern, it would reach a high slightly above $9000, at the resistance line of the channel.
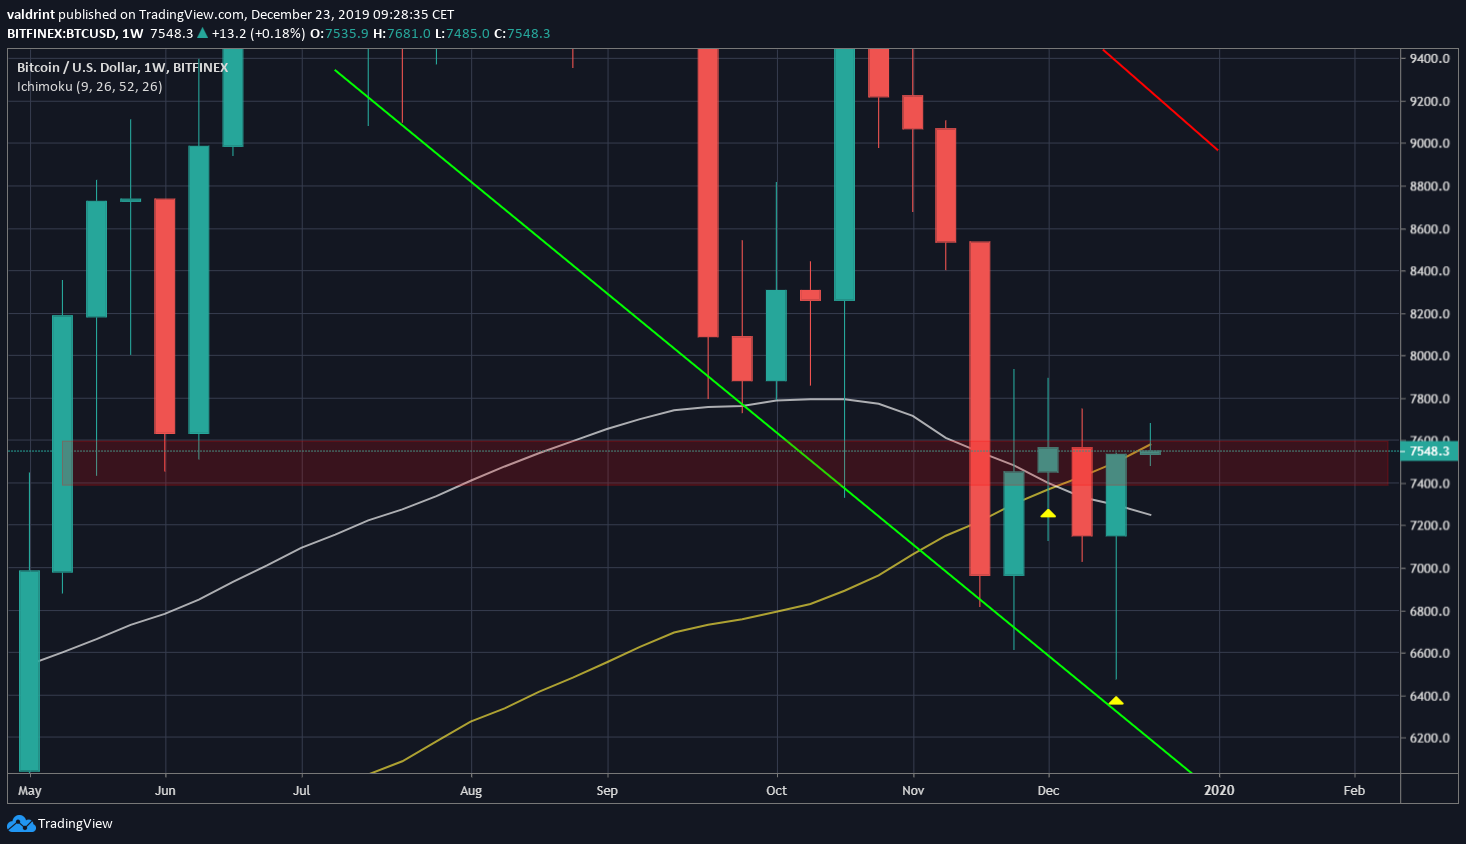
Weekly Outlook
The weekly outlook has begun to turn bullish. Last week, the Bitcoin price created a bullish hammer with a very long lower wick, a sign of buying pressure.
Also, it has moved above the 100- and possibly the 50-week moving averages (MA) — which have previously made a bullish cross.
It is currently attempting to move above the previous breakdown area at $7600. If the price reaches a close above it, it would be an indication that the previous move was a false breakdown and Bitcoin will continue moving upward.
To conclude, the Bitcoin price has made a double bottom and is moving upward. The movement was supported by bullish divergence in momentum indicators. If the price moves the entire height of the pattern, it will reach the descending resistance line of the channel.
Good luck and happy trading! For our previous analysis, click here.


