


![Bitcoin Analysis for 2019-12-20 [Premium Analysis]](/_mfes/post/_next/image/?url=https%3A%2F%2Fassets.beincrypto.com%2Fimg%2FF_xQb6MjV6973VlAdI5Ag7XZ6Kg%3D%2Fsmart%2F2ea8b93115c84fe4a89905fe3bba35d8&w=1920&q=75)
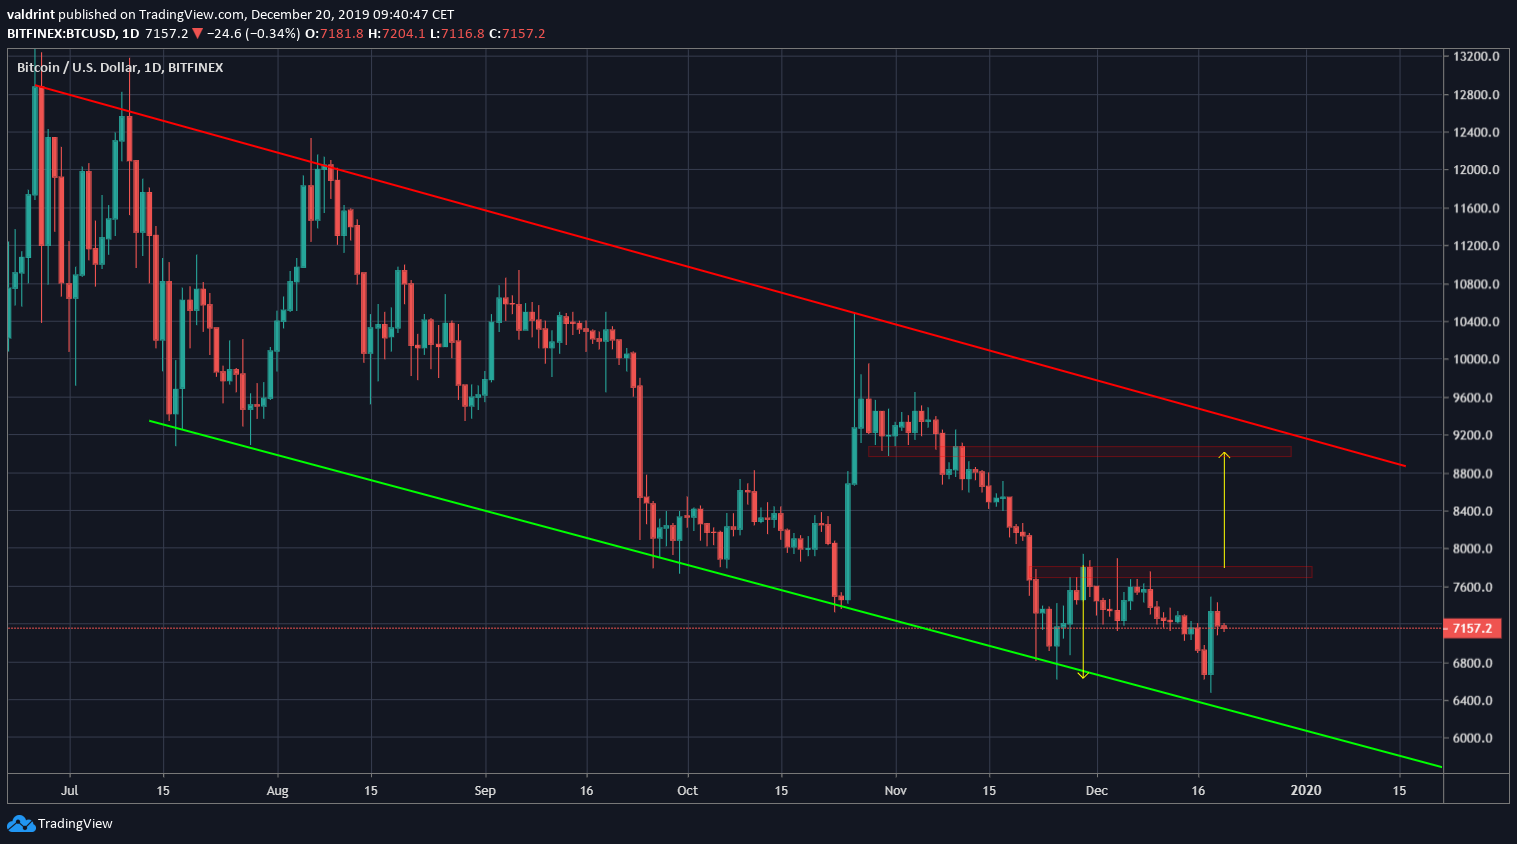
The Bitcoin price broke out from a long-term descending wedge and is following a short-term descending resistance line. A breakout from this short-term resistance line is expected. The price should eventually reach $7700-$7800.
Bitcoin Price Highlights
- The Bitcoin price has failed to break out above a descending resistance line.
- It broke out from a longer-term descending wedge.
- The price made a double bottom at $6500.
- There is resistance between $7700-$7800 and $9000.
Descending Resistance Line
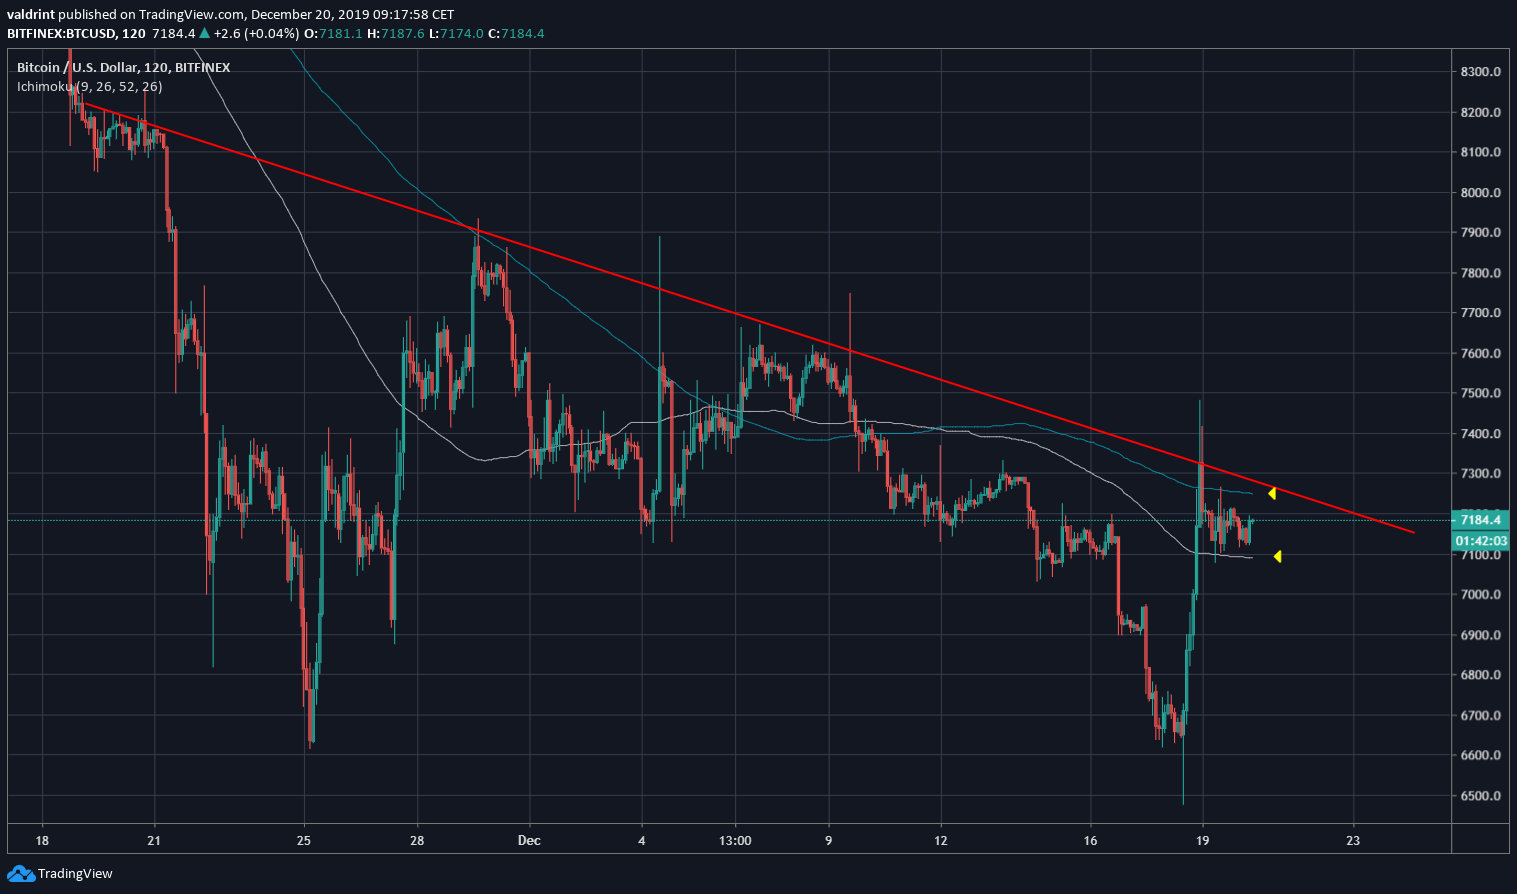
The Bitcoin price is following a descending resistance line that has been in place since November 21. The line has been validated several times. While the December 18 upward move caused the price to briefly move above this line, the price failed to reach a close above it and has decreased below.
Also, the Bitcoin price has possibly made a double bottom near $6500 combined with the prices on November 25. It is trading between the 200- and 400-hour moving averages (MA). A breakdown/breakout above them would likely indicate a continued rapid move in that direction.
Previous Bitcoin Breakout
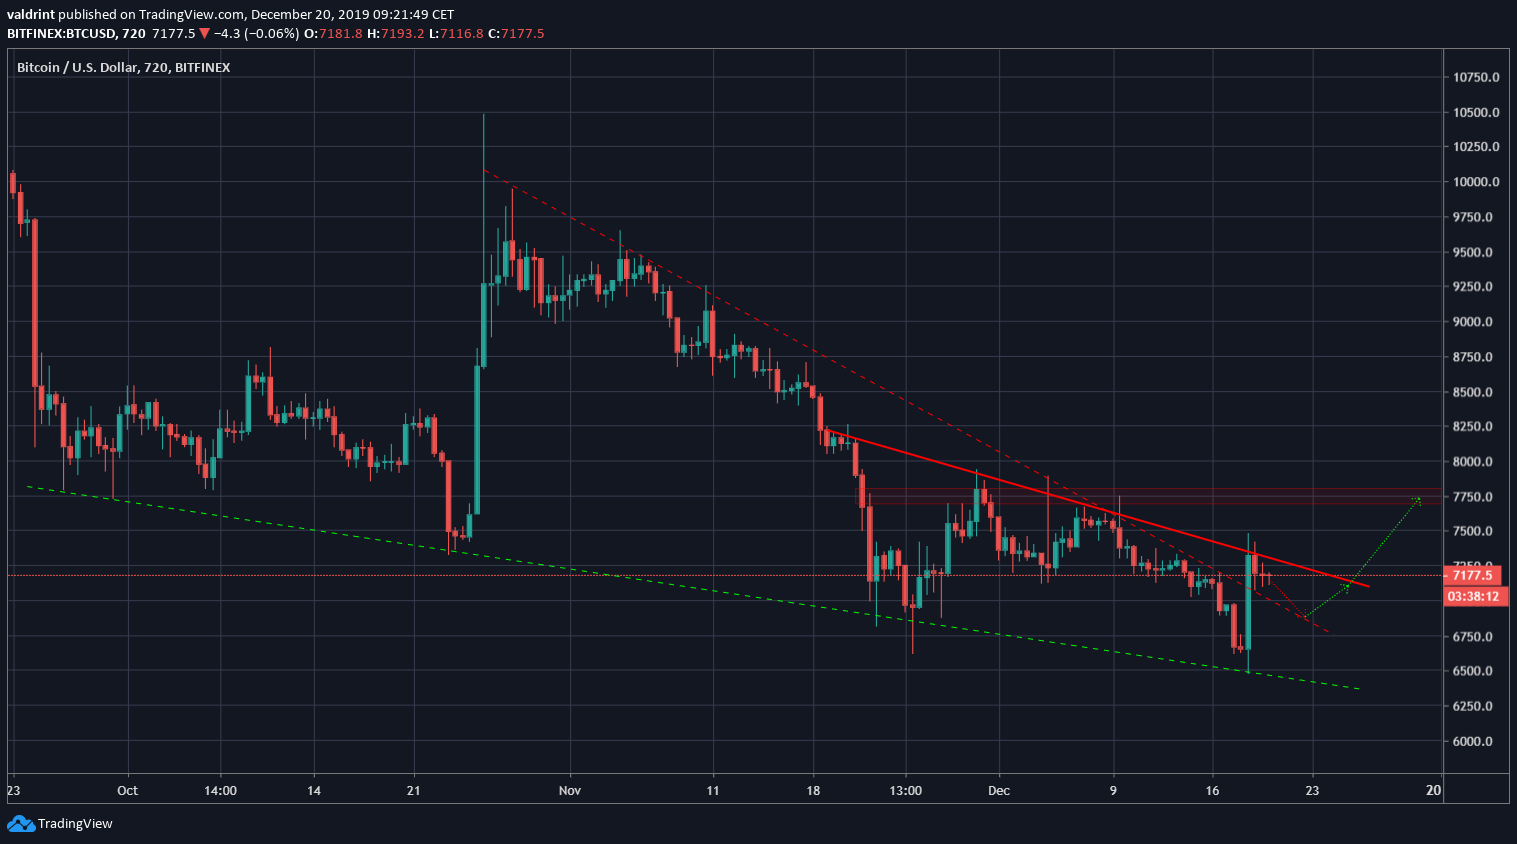
In addition, the Bitcoin price had been trading inside a longer-term descending wedge. The bullish engulfing candlestick of December 18 caused the price to break out above this line.
Currently, the price is validating the descending resistance line as support. It is possible that the price decreases once more to validate it before moving upward and breaking out from the short-term descending resistance line.
The main resistance area is found between $7700-$7800.
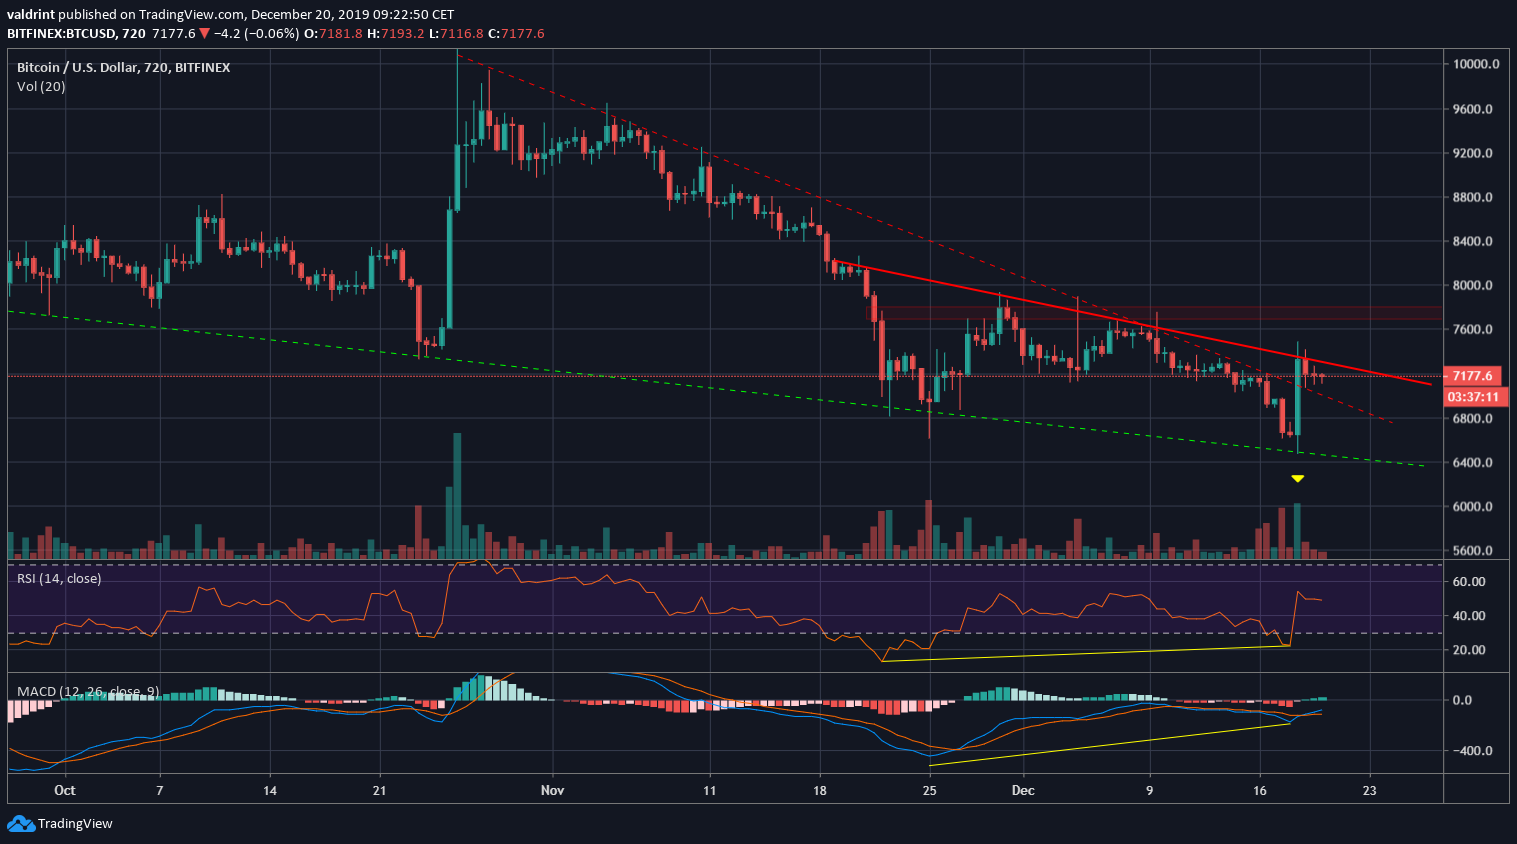
Technical indicators point to and upward movement for two reasons.
First, the wedge breakout transpired with significant volume, albeit not as high as that during October 25-26.
Second, both the RSI & the MACD generated bullish divergence during the aforementioned double bottom. The breakout transpired soon afterward, validating the creation of the pattern.
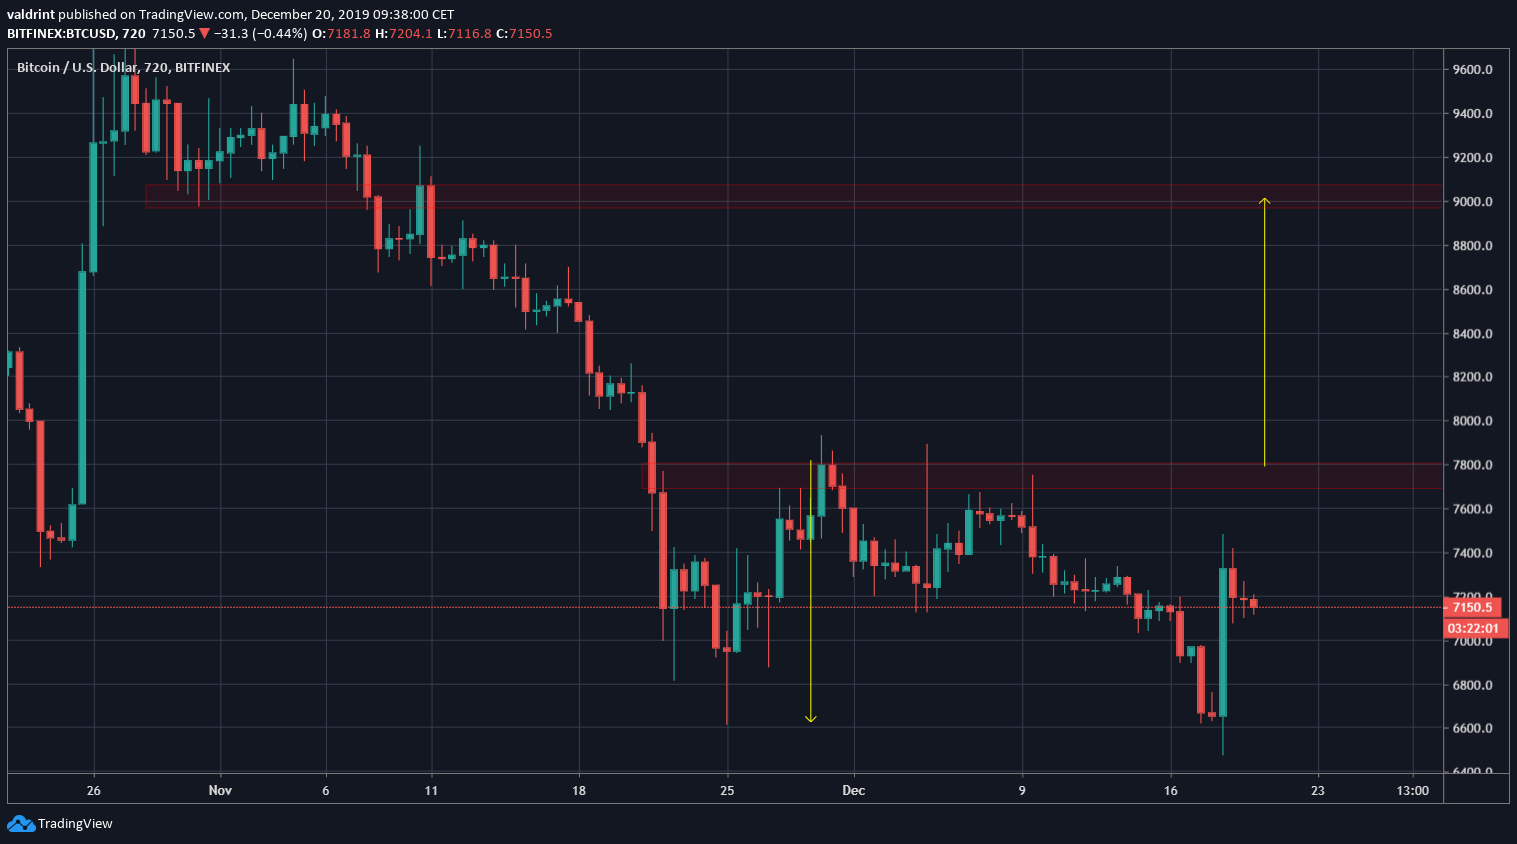
Double Bottom
Looking at the possibility of a double bottom, if the Bitcoin price moves the entire height of the pattern, it would reach $9000, which is the next resistance area. The price would have to move above $7700-$7800 with a strong volume to confirm the movement.
In the context of the five-month descending channel, this possible breakout would take the price to the resistance line of the channel.
While it is possible that the Bitcoin price makes a lower low and invalidates the double bottom, this is definitely a scenario to keep an eye on.
To conclude, the Bitcoin price has made a double bottom and broken out from a descending wedge. If it succeeds in the double bottom pattern with an upward move, it could reach highs close to $9000. If it were to occur, this movement would take 1-2 weeks to transpire.
Good luck and happy trading! For our previous analysis, click here.


