


![Bitcoin Analysis for 2019-12-02 [Premium]](/_mfes/post/_next/image/?url=https%3A%2F%2Fassets.beincrypto.com%2Fimg%2F7QzMSbaG_igsrRzTREIUxmpYXRo%3D%2Fsmart%2F0a77036cc32940329a140016dc836675&w=1920&q=75)
The Bitcoin price failed to move above a significant long-term resistance area. The long-term charts support a sustained decrease. In the short-term, however, a breakout from the current pattern seems likely.
Bitcoin Price Highlights
- The Bitcoin price has reached a bearish weekly close.
- There is support all the way down to $7000.
- The daily RSI & MACD have generated bullish divergence.
- The price is trading inside a short-term descending wedge.
Bitcoin’s Bearish Close
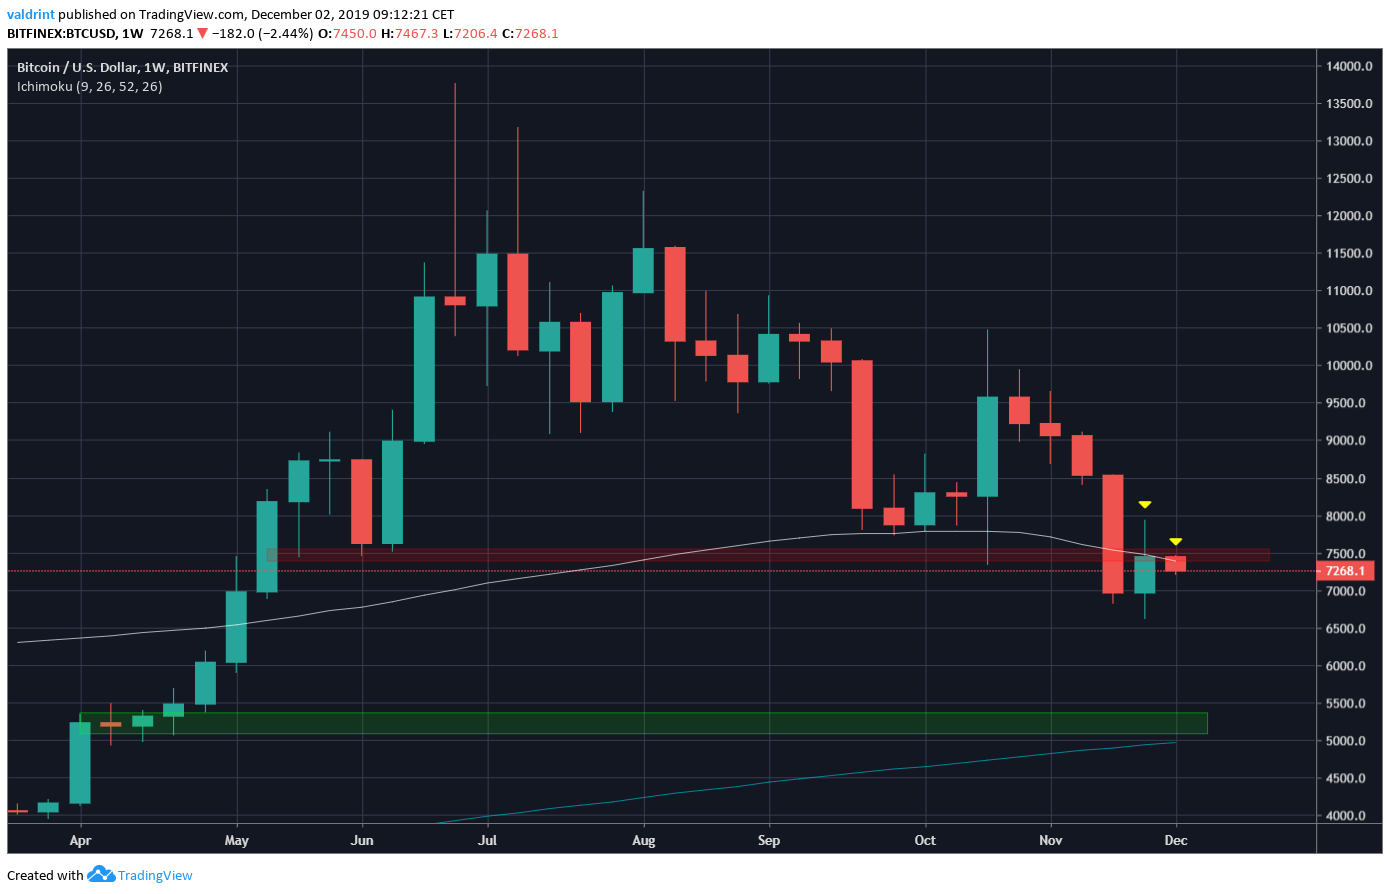
Looking at the weekly chart, we can see that BTC has reached a very bearish close. While it traded above the previous resistance area, it failed to reach a close and again fell below. Additionally, it is facing close resistance from the 100-week moving average (MA).
At first glance, this setup supports a continued price decrease, possibly towards the low $5000s. This support area is strengthened by the 200-week MA.
Descending Channel
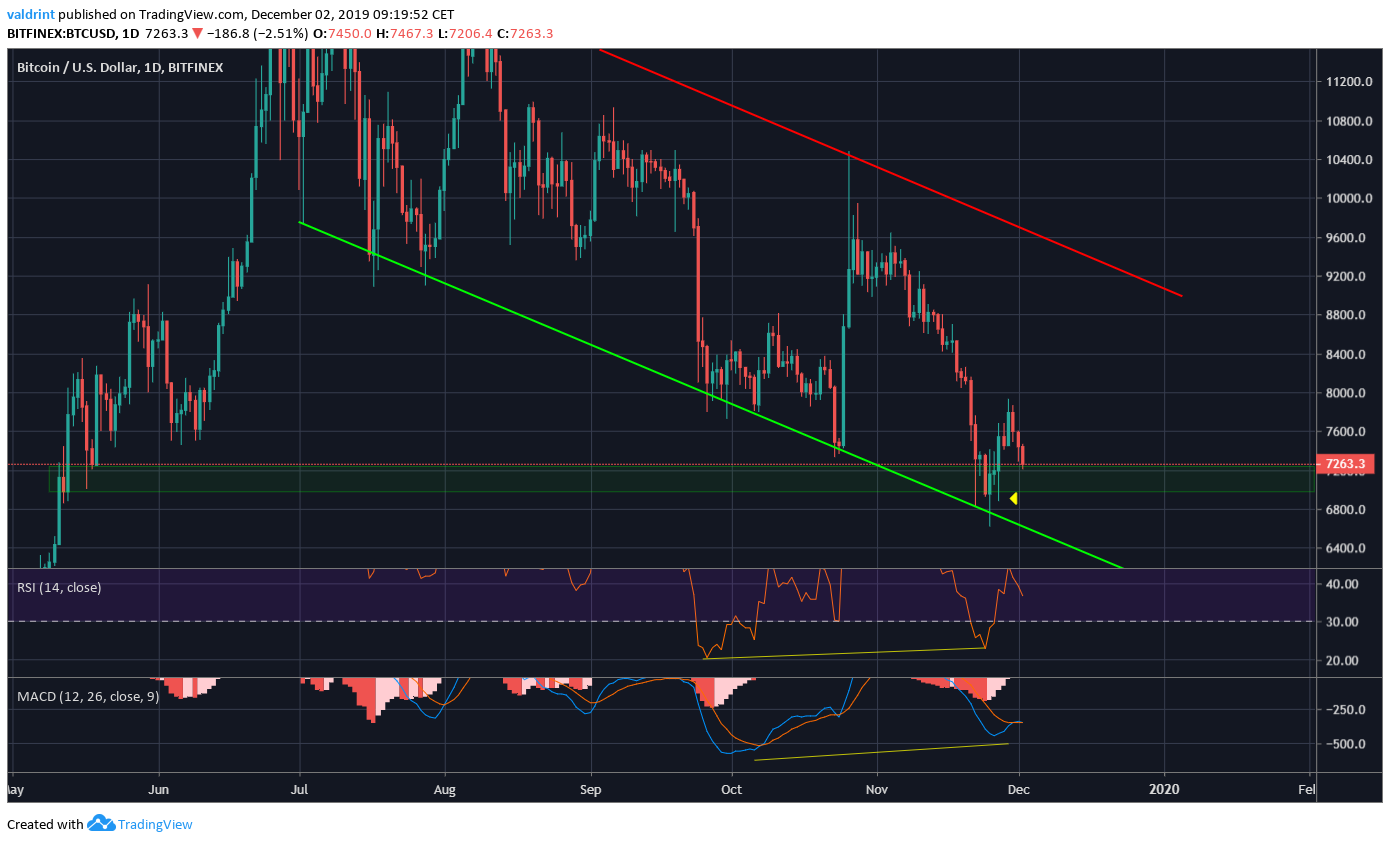
The daily chart shows the descending channel the Bitcoin price has been trading in since late June There is very strong support at $7000, especially evident by the long lower wick of November 27.
There is very strong bullish divergence visible in both the RSI and the MACD.
Therefore, unlike the weekly chart, the daily suggest that the price will likely bounce at this support area instead of making a lower low at the support line.
Short-Term Movement
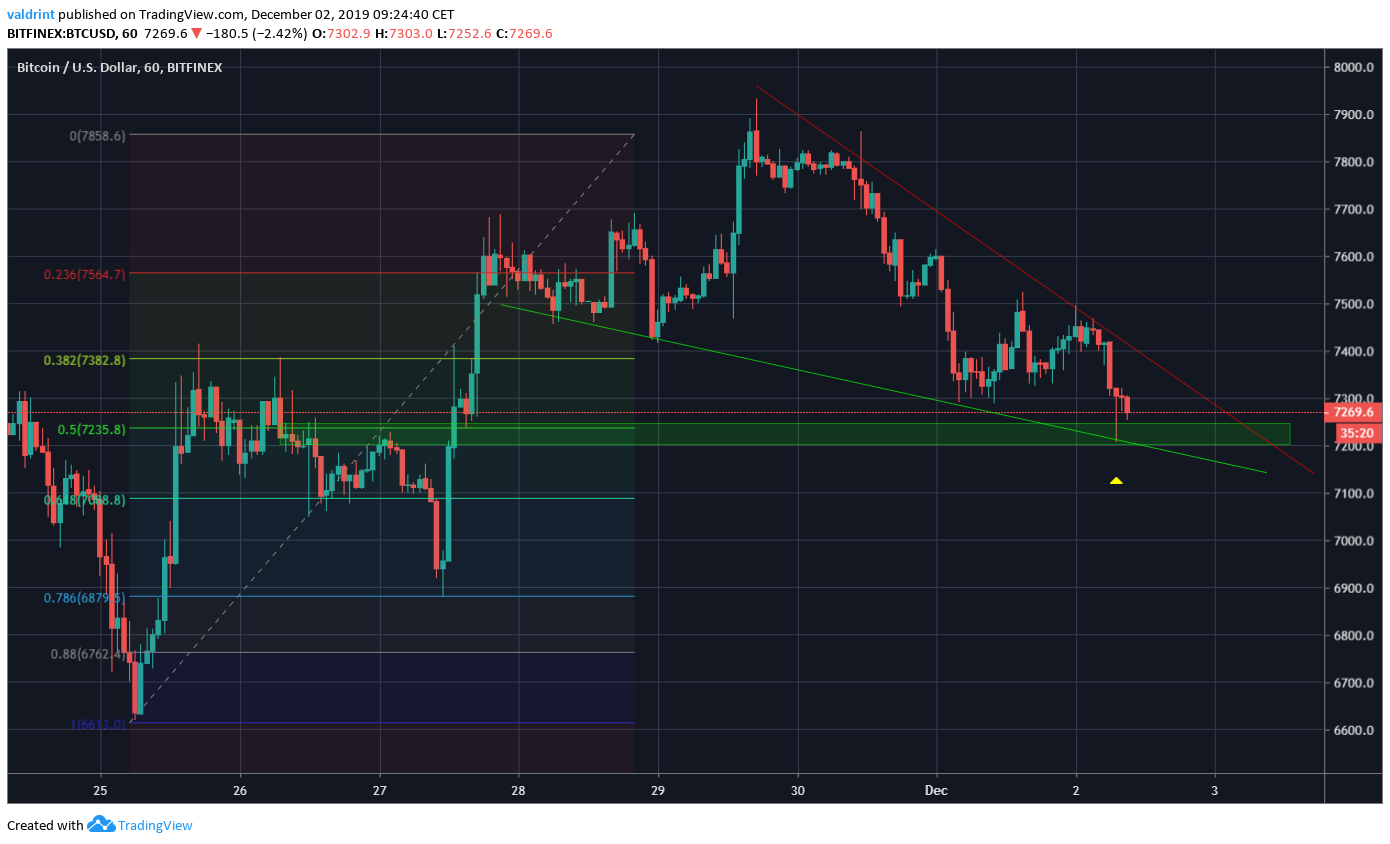
The hourly chart shows that the Bitcoin price is trading inside a descending wedge. Also, it has reached a strong support area at $7200, both previous support and the 0.5 Fib level.
The Bitcoin price also created a long lower wick and a hammer candlestick once it reached the support line. This suggests that the price will break out from the wedge instead of reaching prices near $7000.
To conclude, BTC seems likely to break out from the current short-term pattern and possibly initiate a relief rally. However, the weekly chart looks quite bearish — indicating that a move below $7000 will eventually occur.
For our previous analysis, click here.
Disclaimer: This article is not trading advice and should not be construed as such. Always consult a trained financial professional before investing in cryptocurrencies, as the market is particularly volatile.


