


![Bitcoin Analysis for 2019-11-29 [Premium]](/_mfes/post/_next/image/?url=https%3A%2F%2Fassets.beincrypto.com%2Fimg%2FVHYzUMJzdfx2cCZ34vUcFWZ9Guk%3D%2Fsmart%2Fd09cc92c3a4f45339dd870fe06963435&w=1920&q=75)
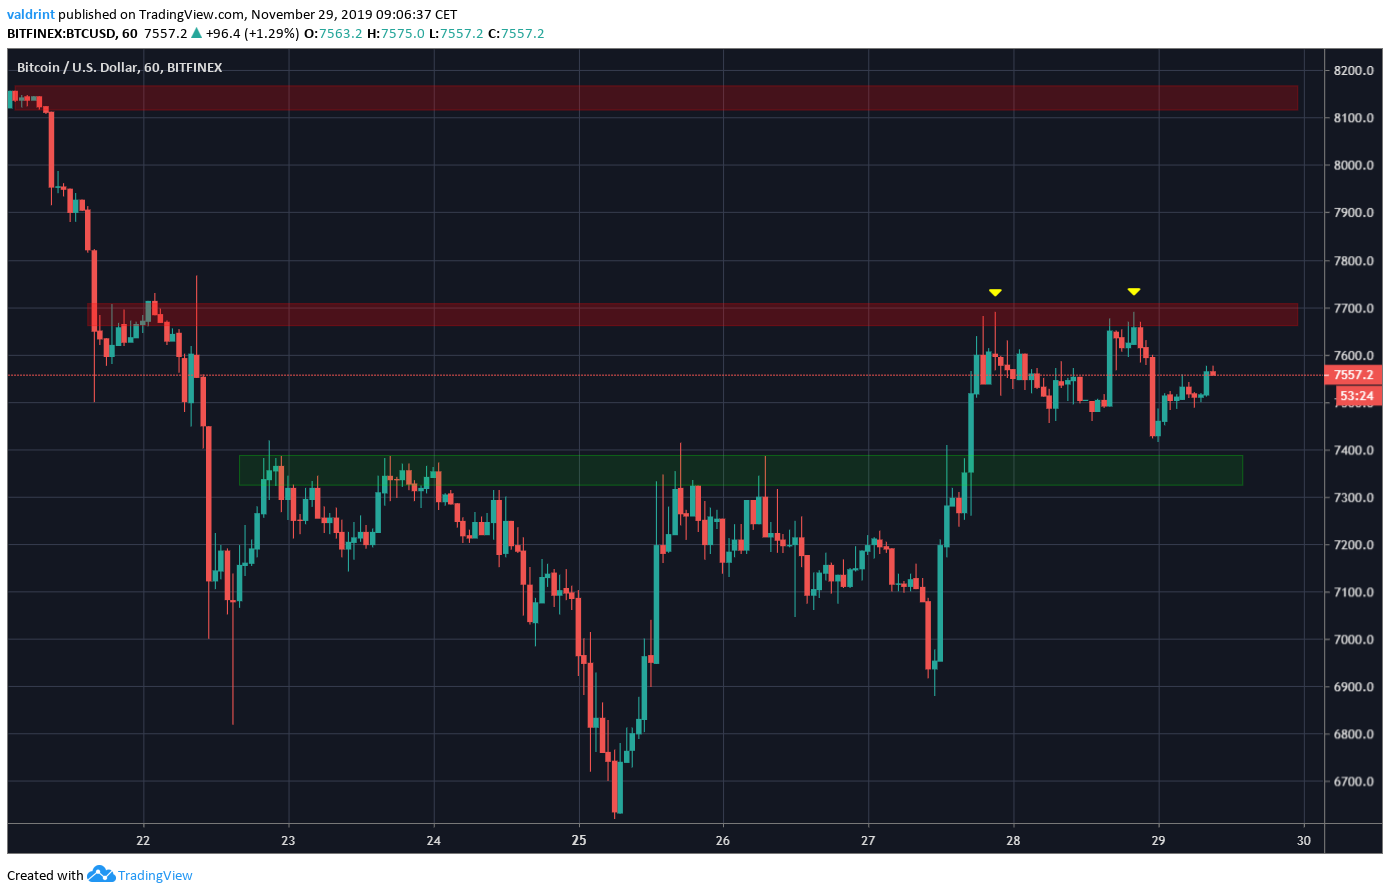
The Bitcoin price created a double top and decreased towards the breakout level. It retested the breakout level and has possibly flipped it as support. At the current time, it is in the process of making another attempt at moving above the resistance area.
Bitcoin Price Highlights
- The Bitcoin price created a double top combined with bearish divergence.
- It retested the level of the breakout.
- There is resistance at $7700 and $8150.
- There is support at $7400.
Bitcoin Price Breakout
After the breakout, the Bitcoin price made two attempts at moving above $7700. Both attempts were unsuccessful and the price decreased following the second one. It created a bearish engulfing candlestick and began to decrease. It retested the level of the breakout near $7400 and began to increase. This is a common movement after breakouts.
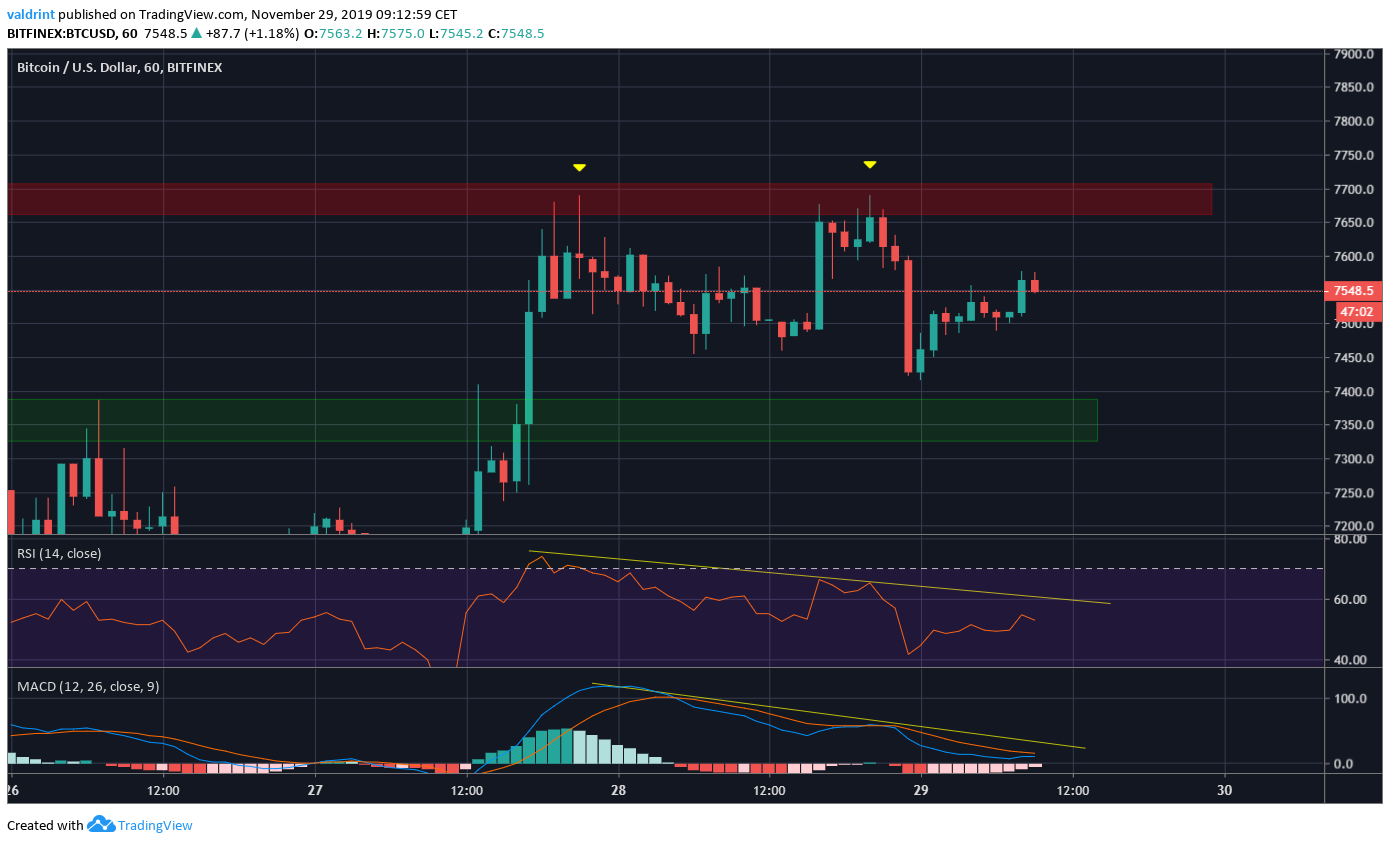
The double top was combined with a bearish divergence in both the RSI and the MACD. The trend-line of the divergence is still intact. As long as that remains the case, we would expect the Bitcoin price to fail to move above the resistance area — possibly making a triple top. A break of the trend-line could indicate a breakout above the resistance area.
However, the three current bullish candles have been easily contained inside the body of the bearish engulfing candlestick prior.
Daily Time-Frame
Looking at the daily time-frame, we can see the selling pressure at the $7700 resistance area by the long upper wicks. However, that coincided with the 10-day moving average (MA), which the Bitcoin price is using as support. A price close above these wicks would likely take us to the second resistance area at $8150.
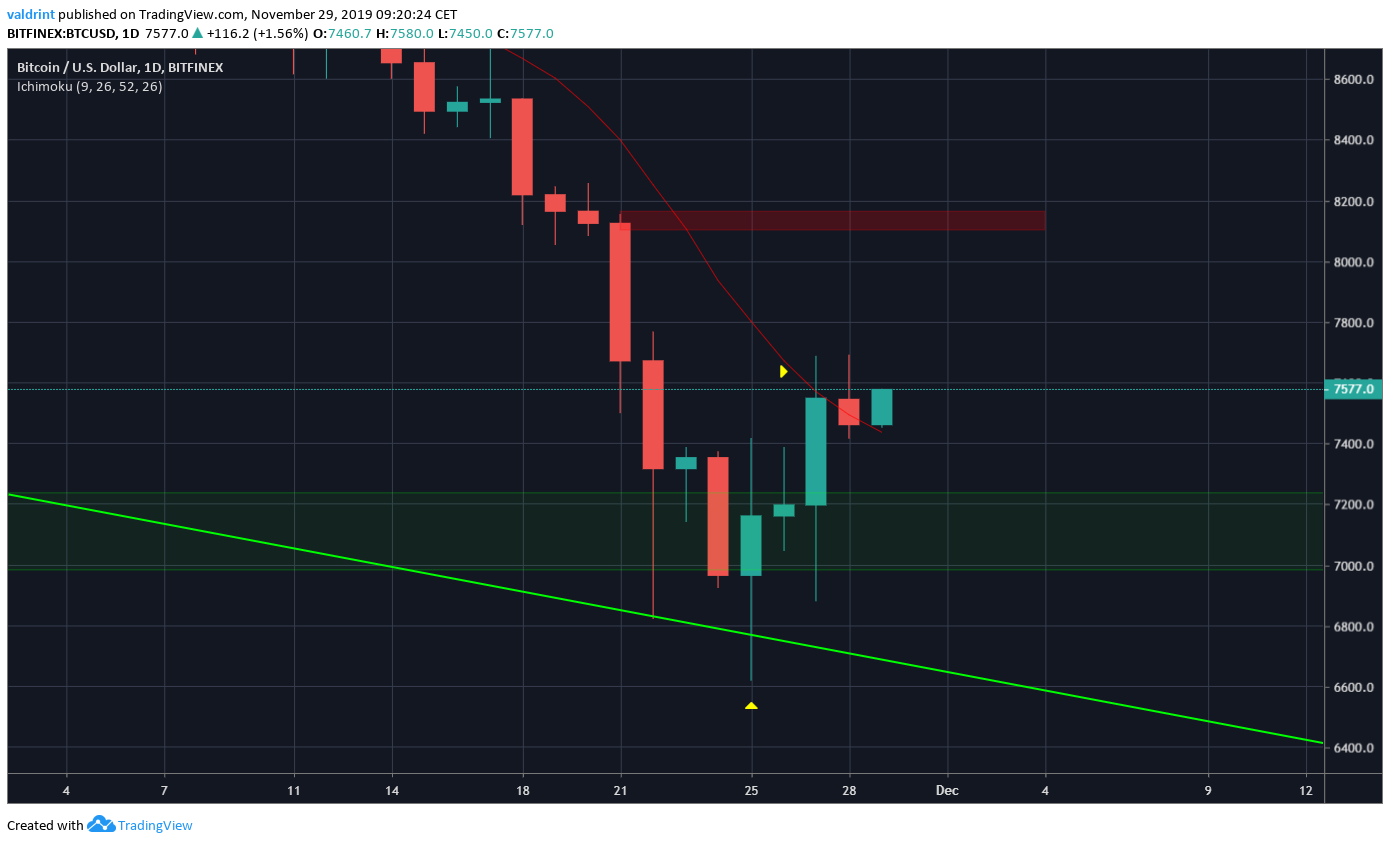
To conclude, the Bitcoin price retested the breakout level and began to move upwards. It looks likely to break out and move towards the second resistance area at $8150.
For our previous analysis, click here.
Disclaimer: This article is not trading advice and should not be construed as such. Always consult a trained financial professional before investing in cryptocurrencies, as the market is particularly volatile.


