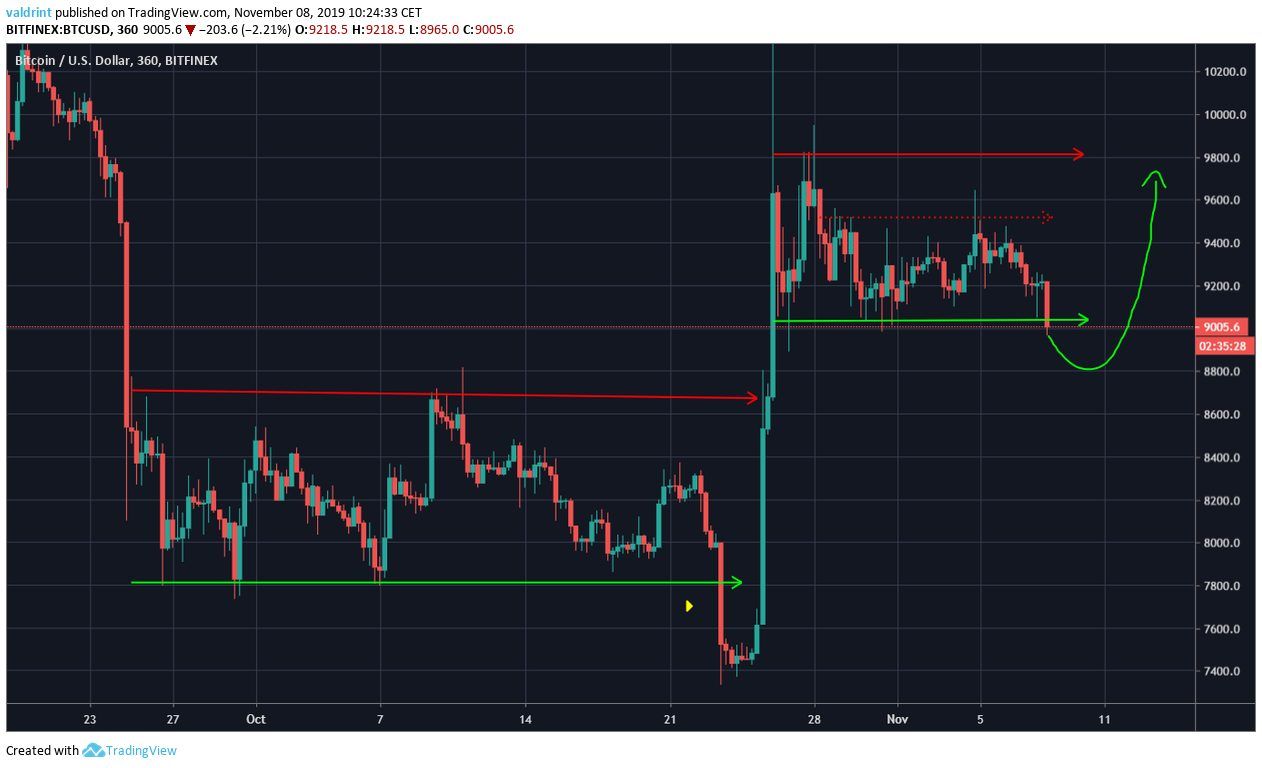
The Bitcoin price is trading inside a horizontal channel with resistance and support at $9,800 and $9,000 respectively. If the current price decrease holds, it will have major bearish implications based on the daily time-frame and the channel breakdown. BeInCrypto’s current market outlook is neutral, slightly leaning on bearish.
Bitcoin Price Highlights
- Bitcoin broke down from an ascending triangle.
- It is trading inside a horizontal channel.
- Bitcoin has fallen below its 200-day moving average.
- It is in the process of breaking down from the channel.
Previous Movement
Bitcoin broke down from the ascending triangle it had been trading in since Oct 31. Following this, it validated the previous support line. Currently, it has created a double bottom characterized by long lower wicks at $9,050, both signs of buying pressure.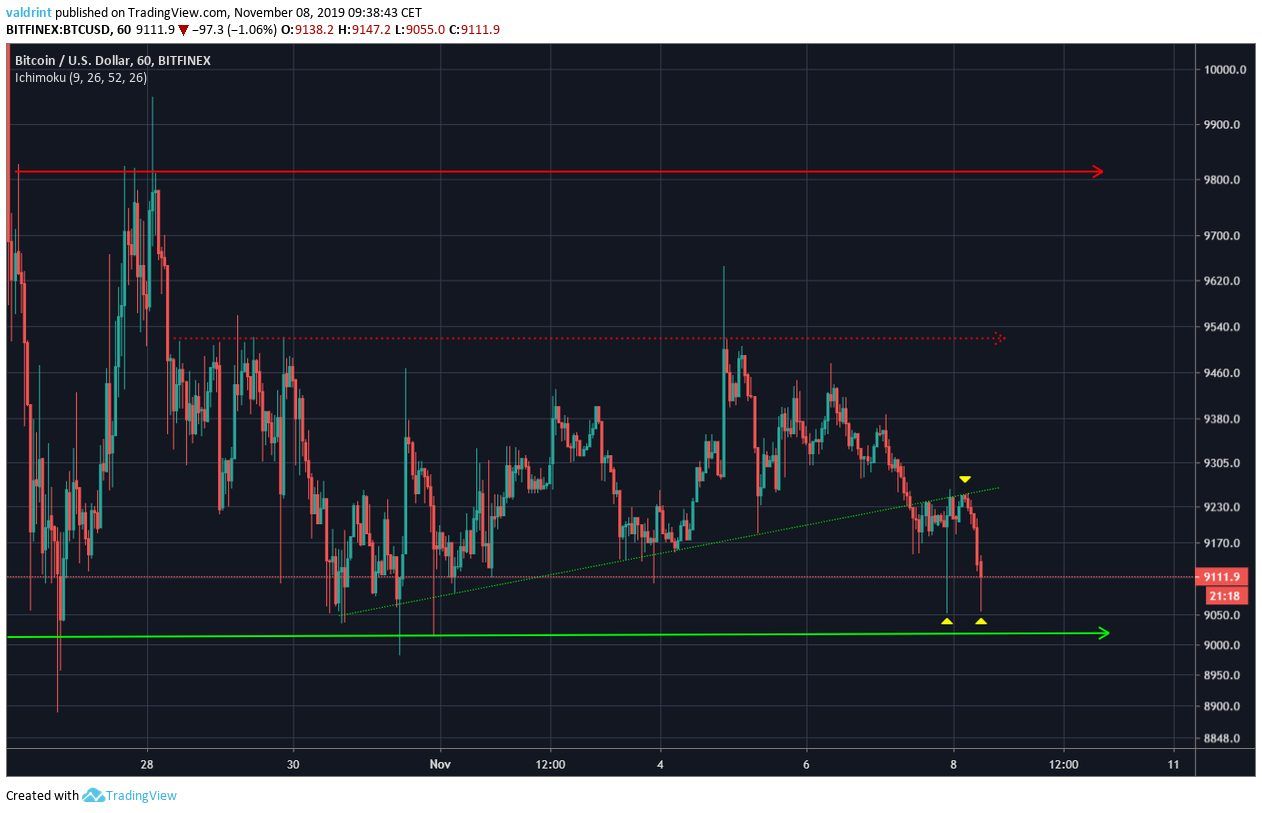
Daily Chart
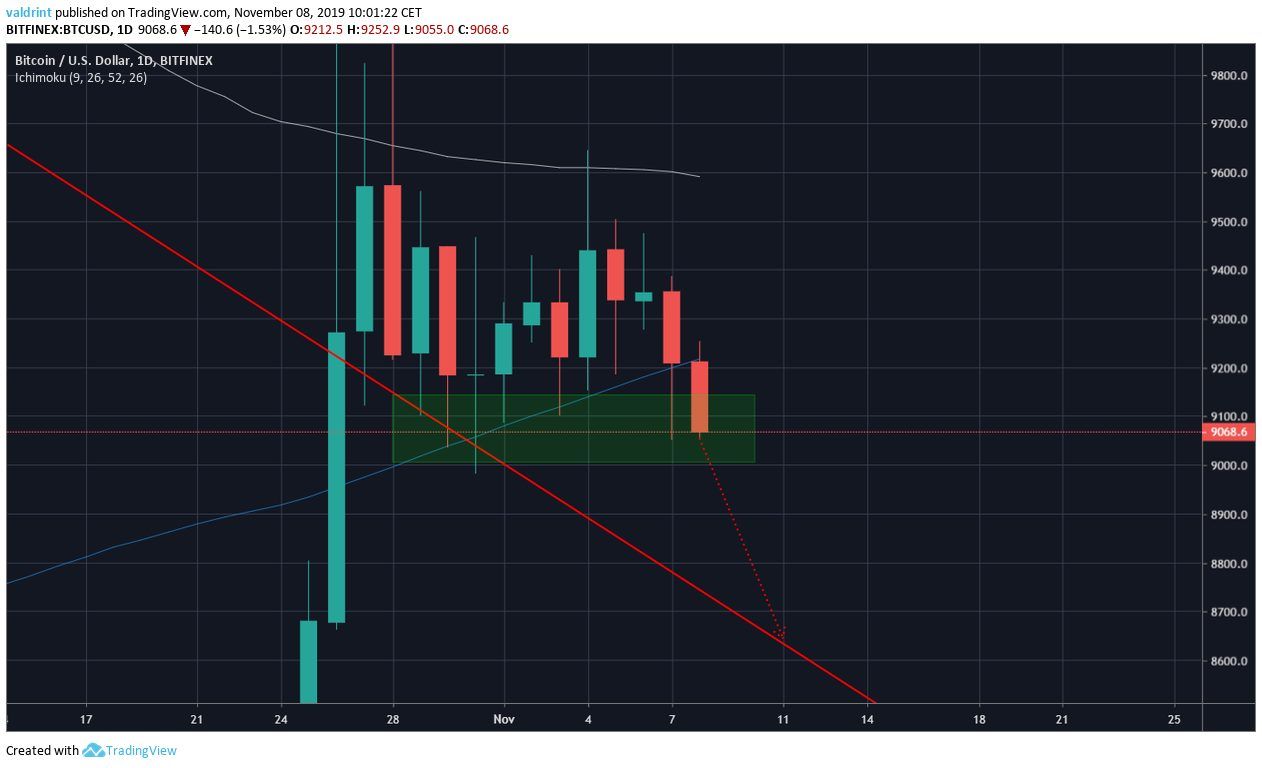
Looking at the daily chart, we can see that BTC has finally decreased below its 200-day moving average (MA). However, the price has yet to close below it, and there are more than 12 hours until the candle’s close. Since the price is currently in a major support area, we could definitely see the creation of another lower wick if the price gains strength and initiates an upward move.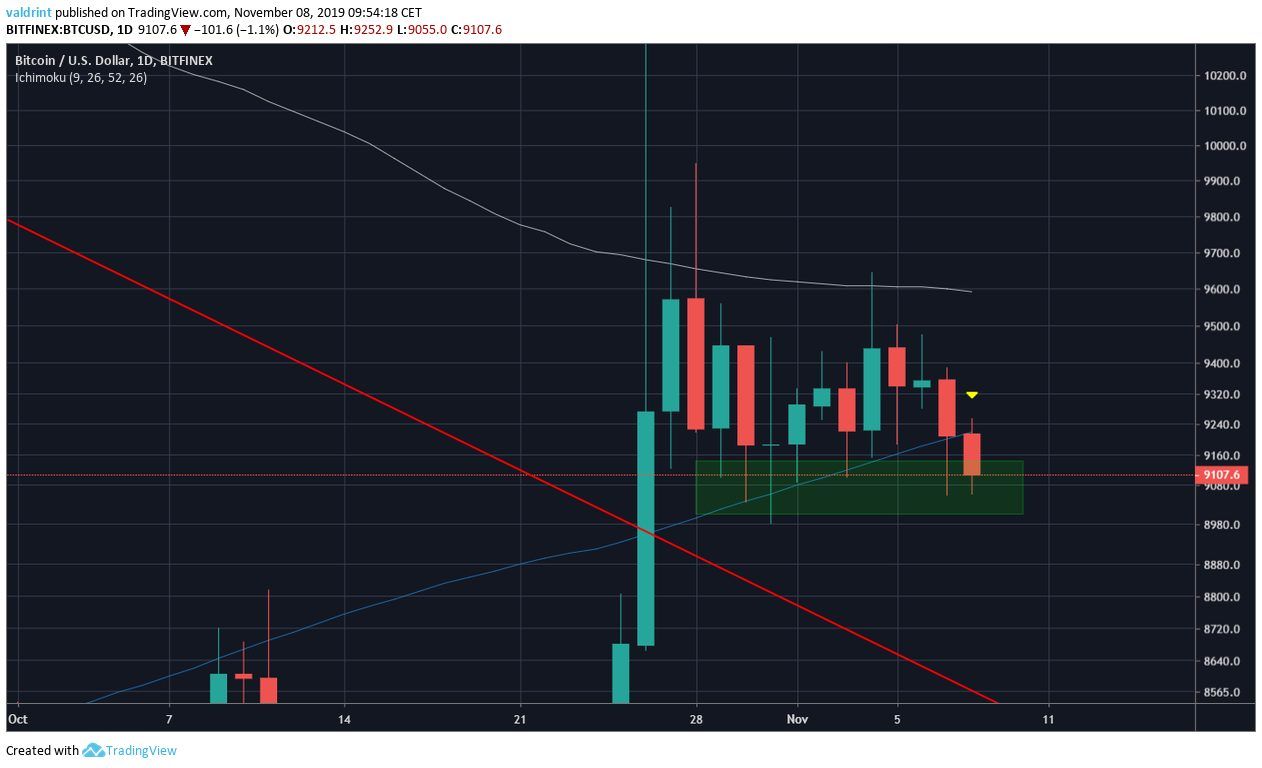 On the other hand, the bearish scenario would have us decreasing all the way to the previous resistance line at $8,700 in order to validate it, before beginning an upward move.
Horizontal Channel
Looking at the horizontal channel, we can see that the price has breached the support with a wick and is in the process of breaking down. However, it still has not done so, barely holding on to the support line.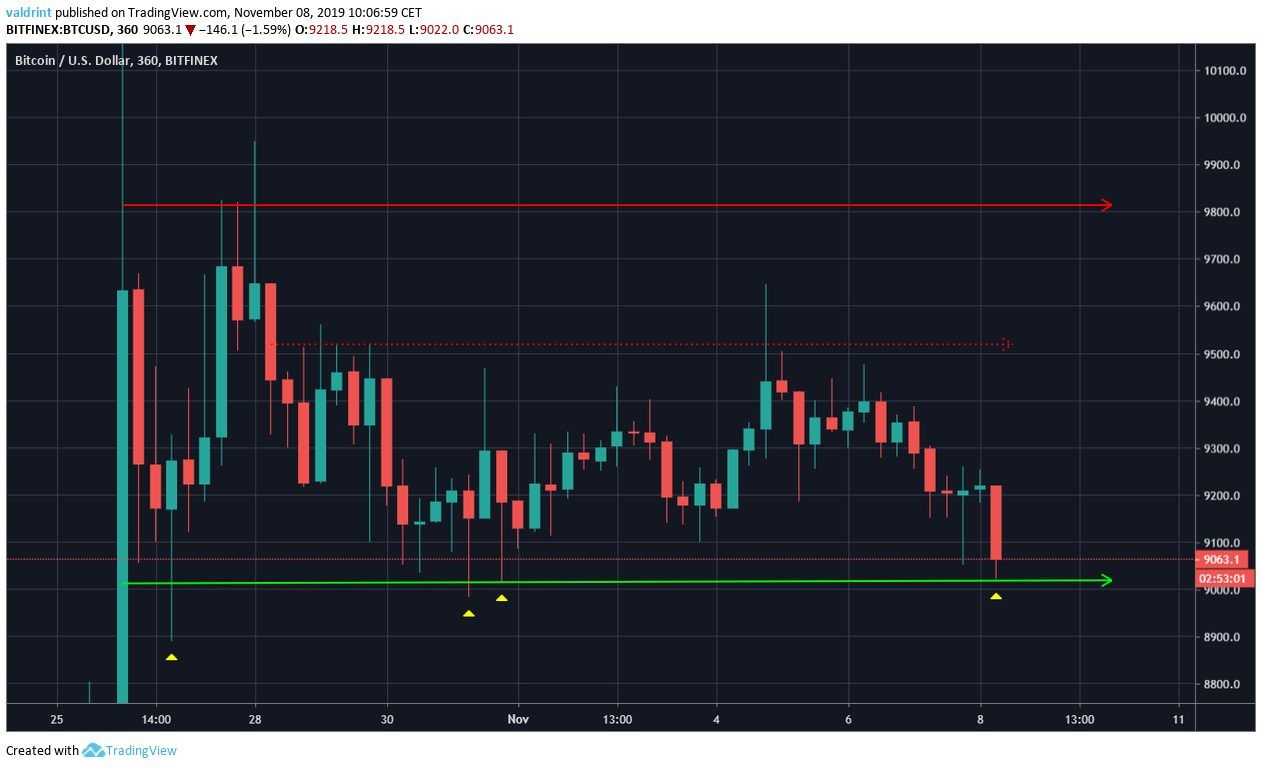 As for future movement, Bitcoin could see a fake breakdown taking place followed by an upward movement towards the resistance line.
This would fall in line with the hypothesis laid out in the daily time-frame in which the price validates the resistance line before moving upward. In this case, it would make a low around $8,700-$8,800.
 Good luck and happy trading! For yesterday’s analysis click here.
Disclaimer: This article is not trading advice and should not be construed as such. Always consult a trained financial professional before investing in cryptocurrencies, as the market is particularly volatile.
Did you know you can trade sign-up to trade Bitcoin and many leading altcoins with a multiplier of up to 100x on a safe and secure exchange with the lowest fees — with only an email address? Well, now you do! Click here to get started on StormGain!
Top crypto platforms in the US
Disclaimer
In line with the Trust Project guidelines, this price analysis article is for informational purposes only and should not be considered financial or investment advice. BeInCrypto is committed to accurate, unbiased reporting, but market conditions are subject to change without notice. Always conduct your own research and consult with a professional before making any financial decisions. Please note that our Terms and Conditions, Privacy Policy, and Disclaimers have been updated.

Valdrin Tahiri
Valdrin discovered cryptocurrencies while he was getting his MSc in Financial Markets from the Barcelona School of Economics. Shortly after graduating, he began writing for several different cryptocurrency related websites as a freelancer before eventually taking on the role of BeInCrypto's Senior Analyst.
(I do not have a discord and will not contact you first there. Beware of scammers)
READ FULL BIO
Sponsored
Sponsored

![Bitcoin Analysis for 2019-11-08 [Premium]](https://beincrypto.com/wp-content/uploads/2019/07/bic_AL_BTC_future.jpg.optimal.jpg)