


![Bitcoin Analysis for 2019-11-04 [Premium]](/_mfes/post/_next/image/?url=https%3A%2F%2Fassets.beincrypto.com%2Fimg%2FfPv3nPFa3e_kjW8gnPHxa7yX4h4%3D%2Fsmart%2F2334a6cb8a5745b1b40a917d17e1cc3f&w=1920&q=75)
After breaking out from a descending wedge on Oct 26, the price of Bitcoin has decreased to touch a previous resistance line. It is trading inside a short-term horizontal channel and an ascending triangle. The bullish divergence in the RSI inside a bullish pattern makes it likely that it will break out from the triangle and head towards the resistance line at $9800.
Bitcoin Price Highlights
- Bitcoin is trading between several important moving averages (MA).
- It is trading inside a horizontal channel.
- There is a short-term ascending triangle inside the channel.
- Short-term bullish divergence has developed in the RSI.
- Resistance/support is found at $9800/$9000.
Weekly Outlook
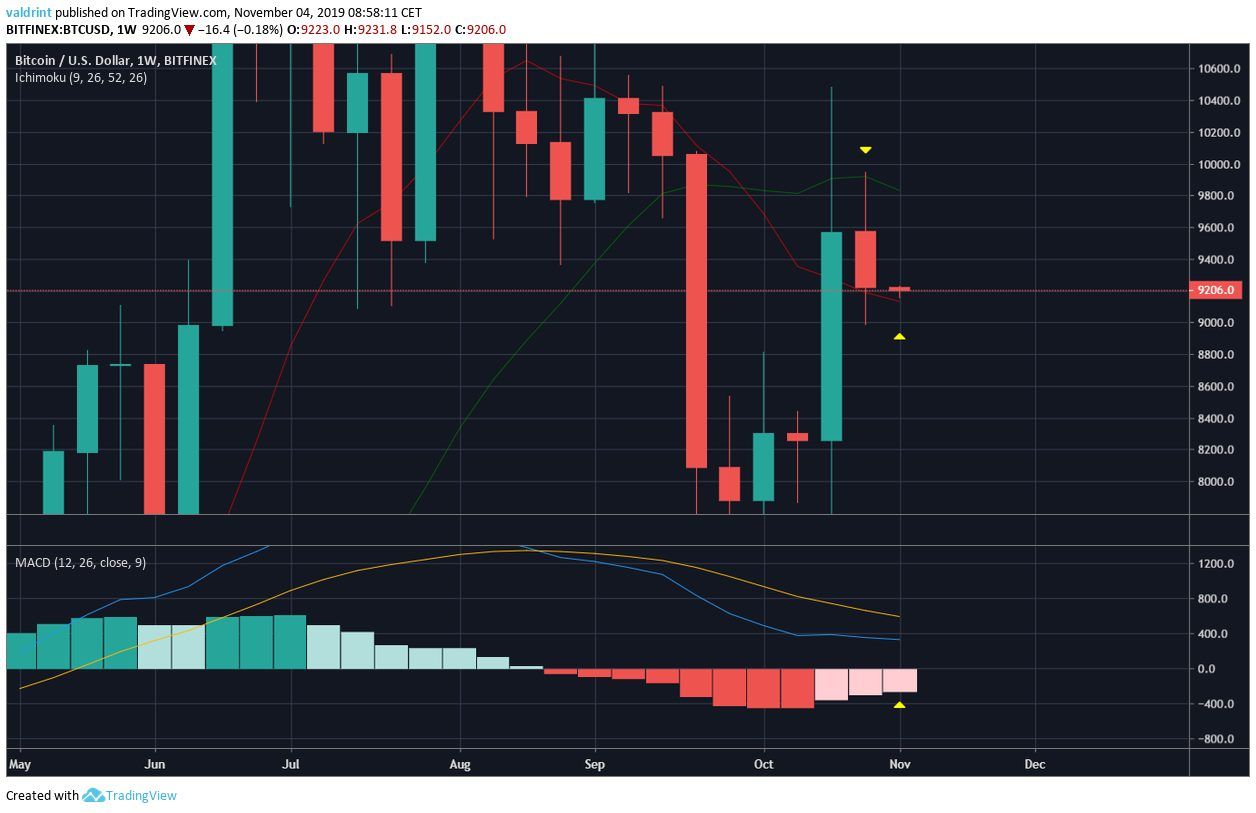
The Bitcoin price created a small bearish weekly candle completely contained within the body of the prior weeks bullish candle.
This is more a characteristic of a retracement than a reversal.
Also, while it has met resistance at the 20-week moving average (MA), it has found support above 10-week MA.
Other important indicators considered, the MACD seems to be turning upward and has lost most of its negative momentum. A bullish cross, however, has yet to occur.
Daily Outlook
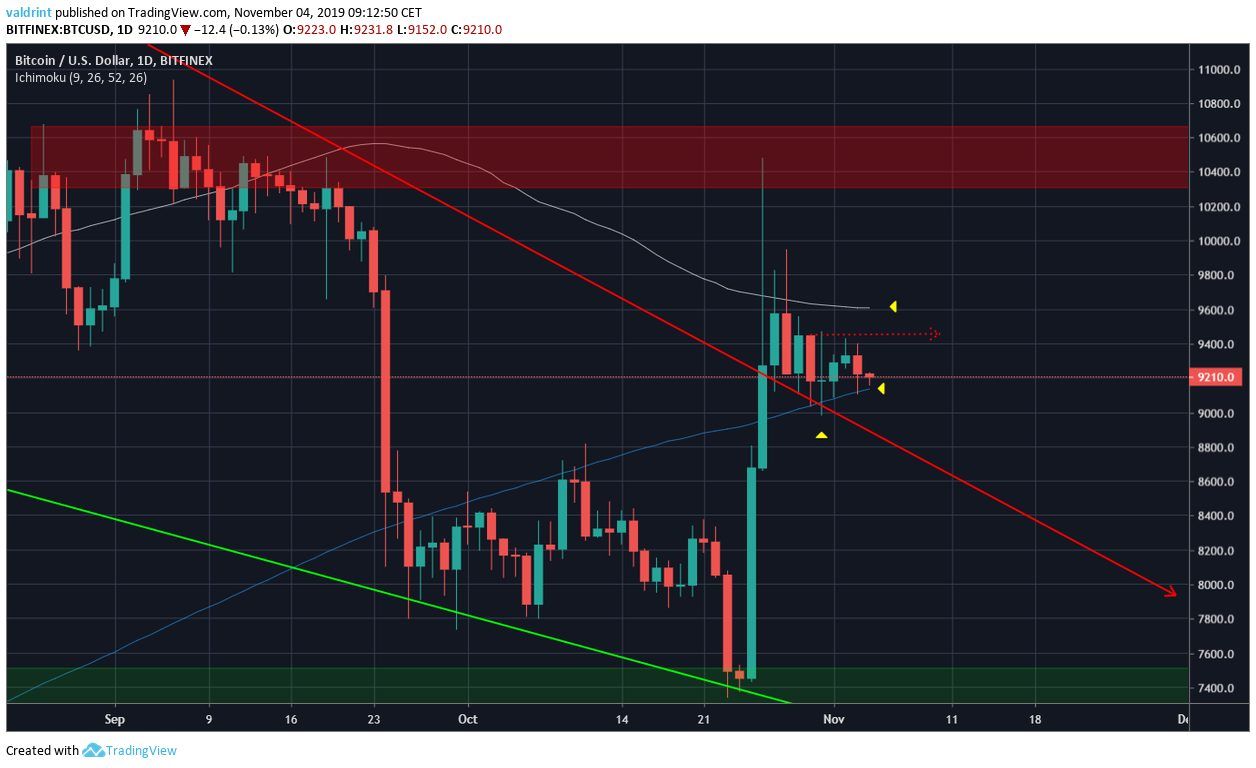
Looking at the daily time-frame, the price has been moving upward slowly after touching the previous resistance line on Oct 31.
The price created a bullish Doji and began to move upward, until the bearish candle yesterday.
Similar to the weekly time-frame, the price is trading between the 100- and 200-day MAs. Both these MAs are tightening, so a decisive move above or below one of them should eventually occur.
Horizontal Channel
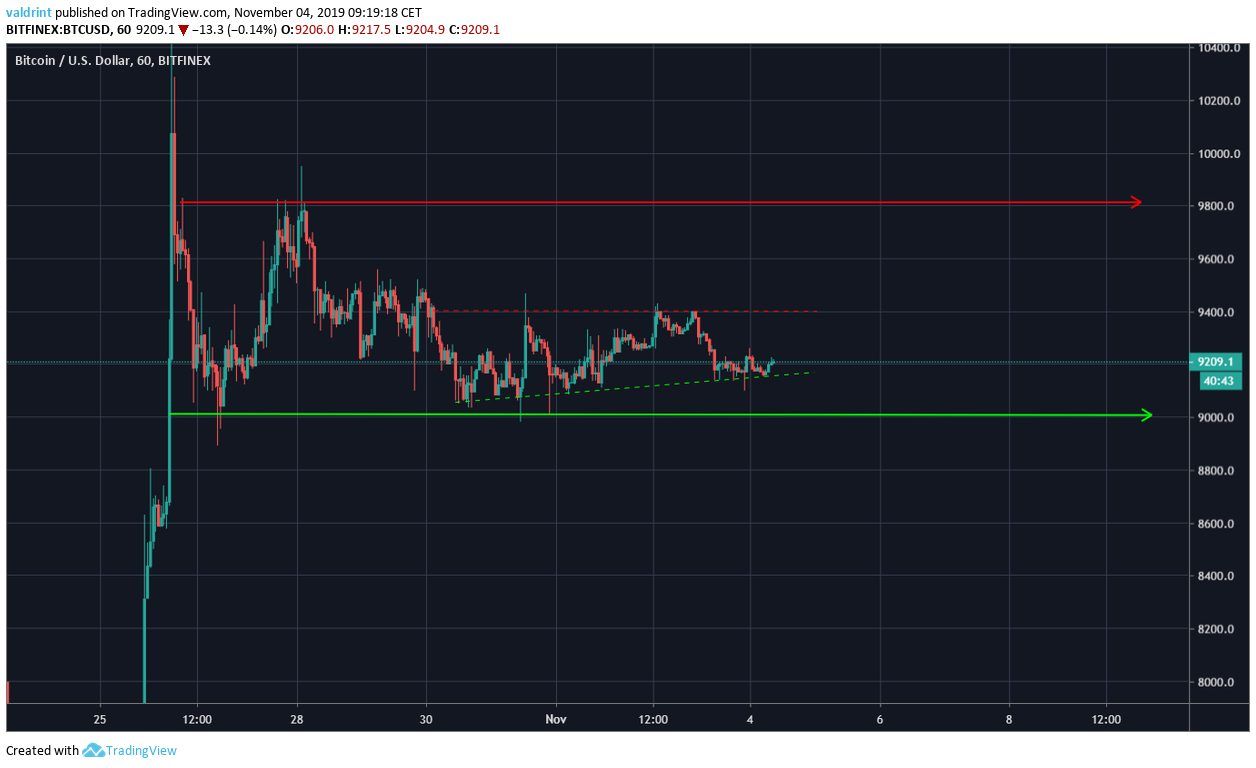
In the short-term, the price has been trading inside a horizontal channel since Oct 25.
The resistance and support lines are at $9,800 and $9,000 respectively.
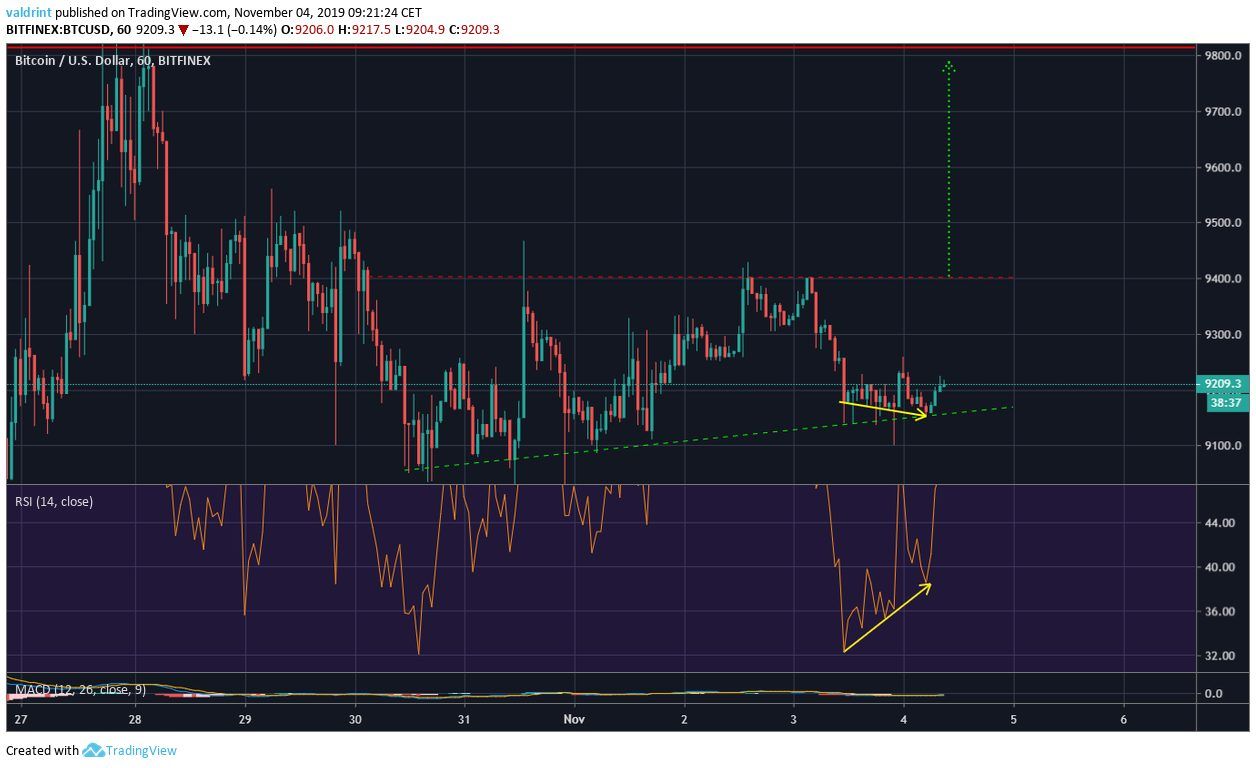
Inside it, it seems as if the price has created a bullish ascending triangle.
Additionally, there is bullish divergence developing in the RSI.
This makes a breakout towards the resistance line more likely.
Good luck and happy trading! For yesterday’s analysis click here.
Disclaimer: This article is not trading advice and should not be construed as such. Always consult a trained financial professional before investing in cryptocurrencies, as the market is particularly volatile.
Did you know you can trade sign-up to trade Bitcoin and many leading altcoins with a multiplier of up to 100x on a safe and secure exchange with the lowest fees — with only an email address? Well, now you do! Click here to get started on StormGain!


