![Bitcoin Analysis for 2020-01-07 [Premium Analysis]](/_mfes/post/_next/image/?url=https%3A%2F%2Fassets.beincrypto.com%2Fimg%2FVHYzUMJzdfx2cCZ34vUcFWZ9Guk%3D%2Fsmart%2Fd09cc92c3a4f45339dd870fe06963435&w=1920&q=75)
Bitcoin Price Highlights
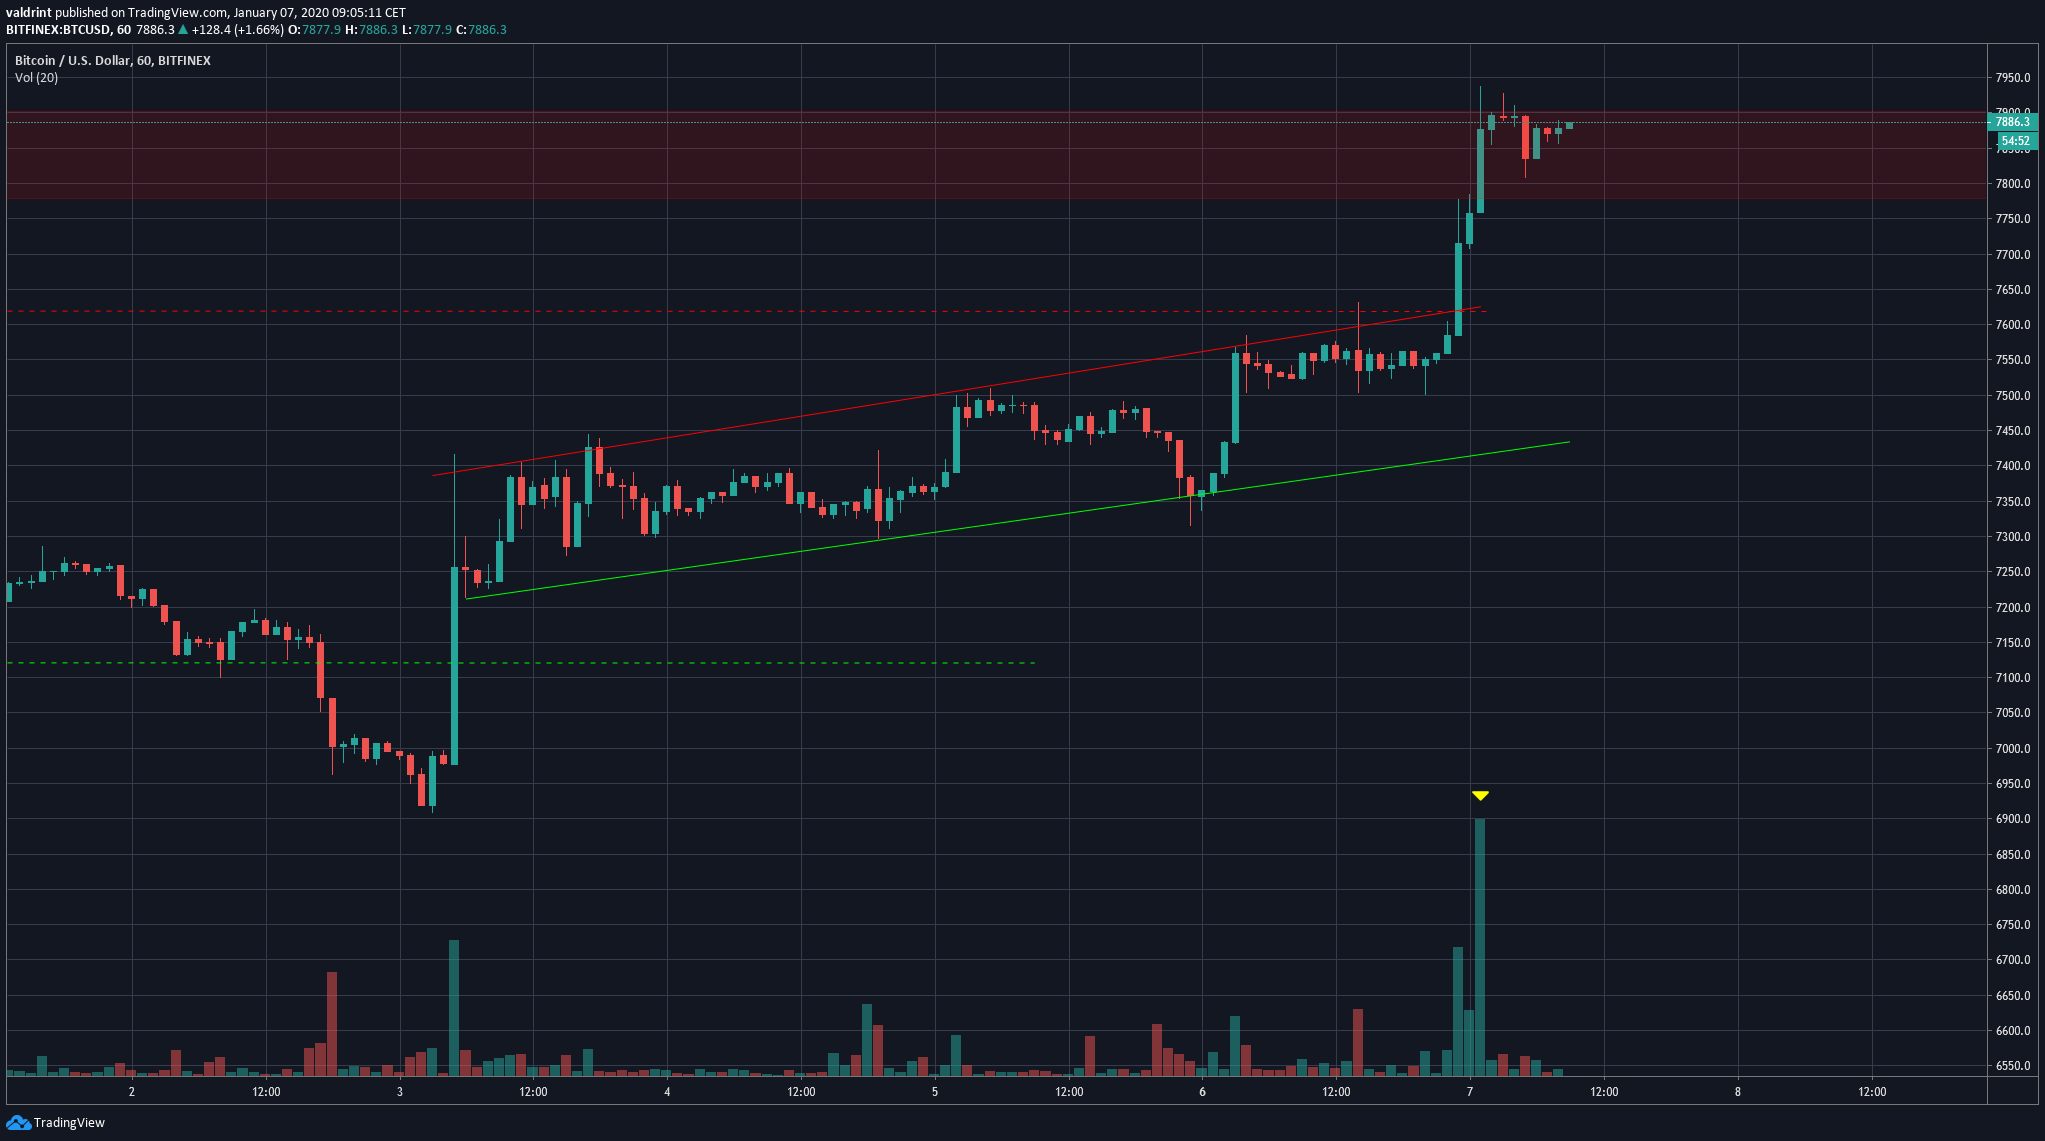
- The Bitcoin price broke out from an ascending channel.
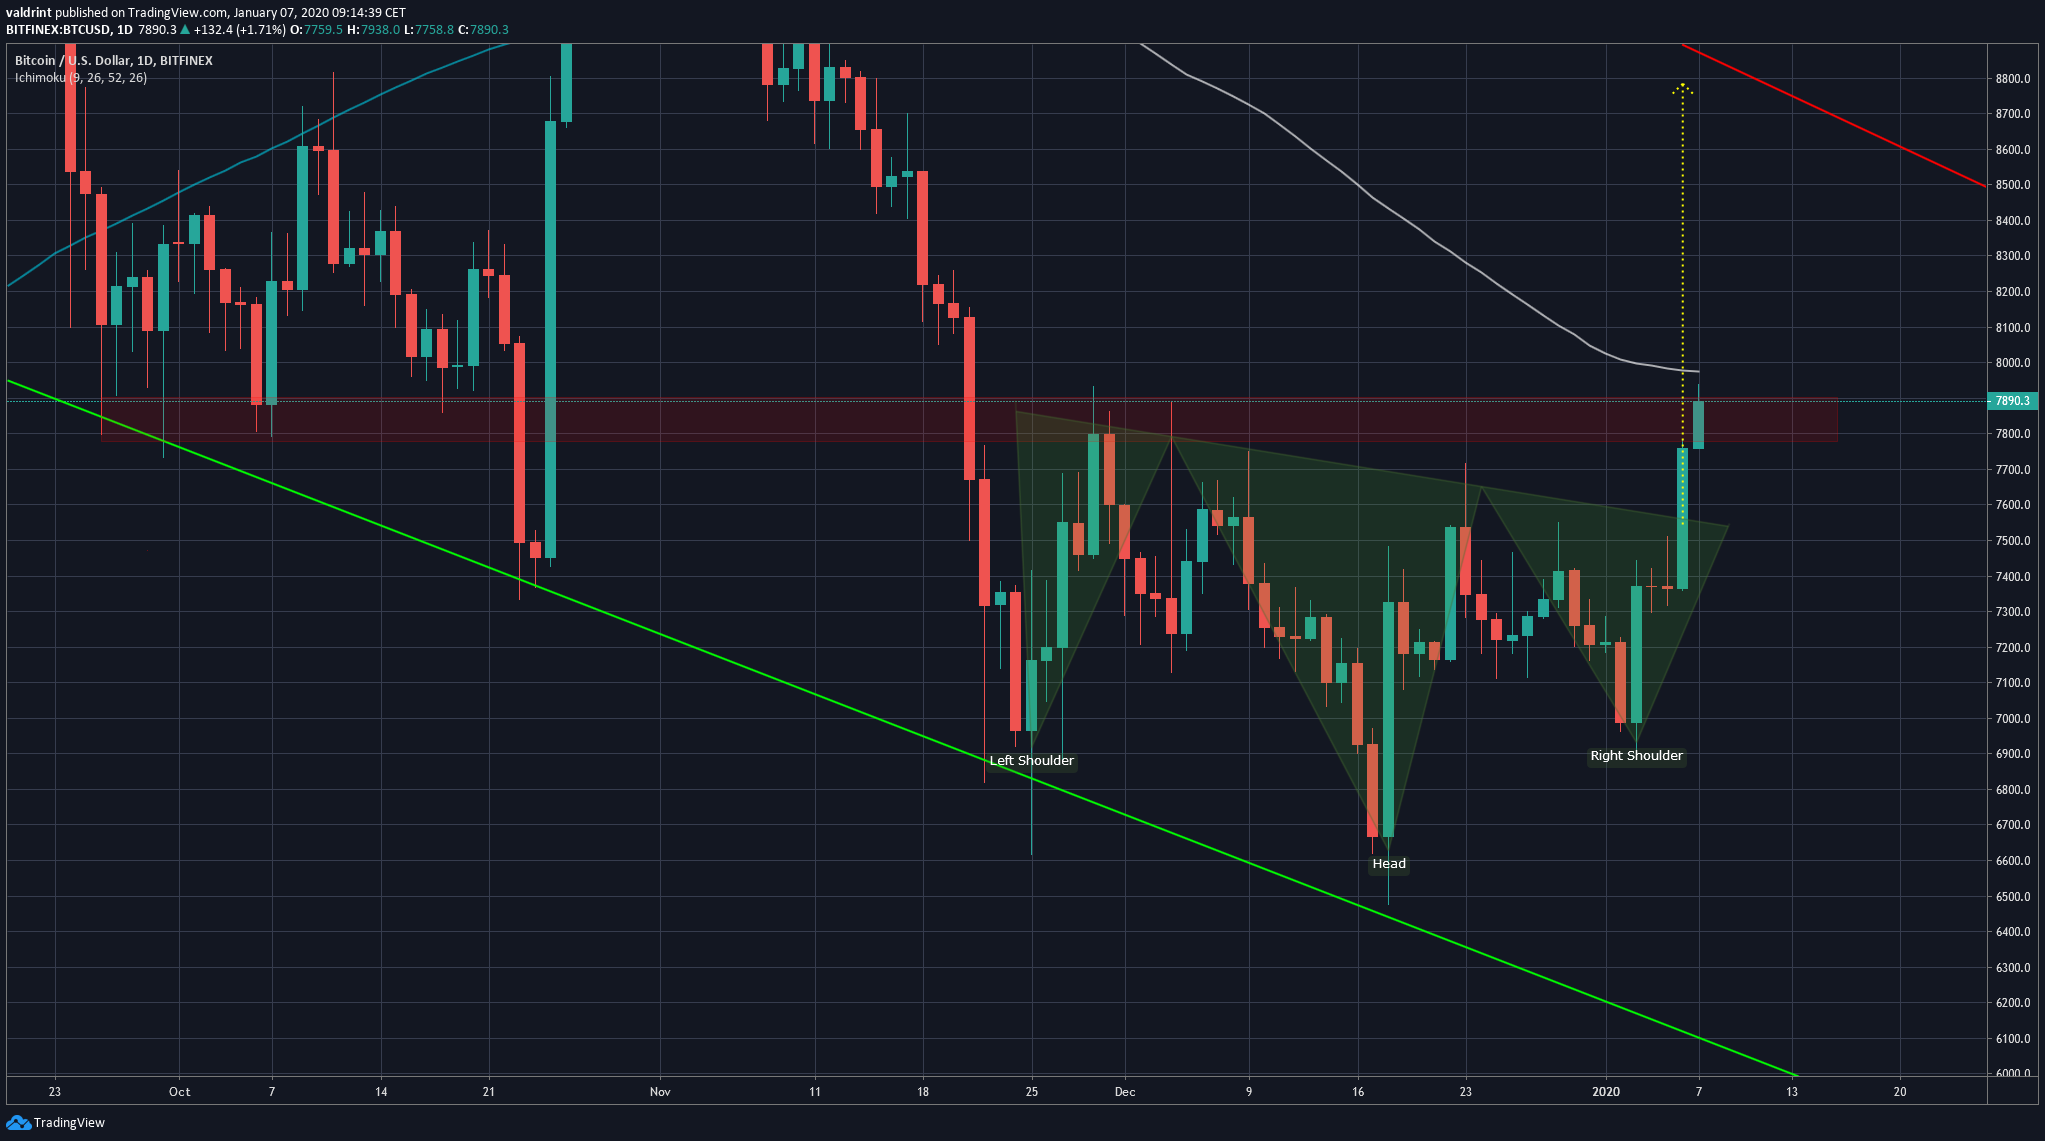
- It also broke out from the inverse head and shoulders pattern.
- It is trading inside a major resistance area near $7800.
- The price is moving above its long-term moving averages.
Bitcoin Breakout
The Bitcoin price broke out from the ascending channel late last night. Volume was extremely significant during the breakout. The price is now trading inside the final resistance area near $7800.
This movement likely constituted a breakout from the longer-term inverse head and shoulder (H&S) pattern. As stated in yesterday’s analysis, a movement the entire height of the pattern would have the price reach $8800.
However, the significance of the current resistance area is strengthened by the presence of the 100-day moving average (MA), above which the price is struggling to break out.
Long-Term Movement
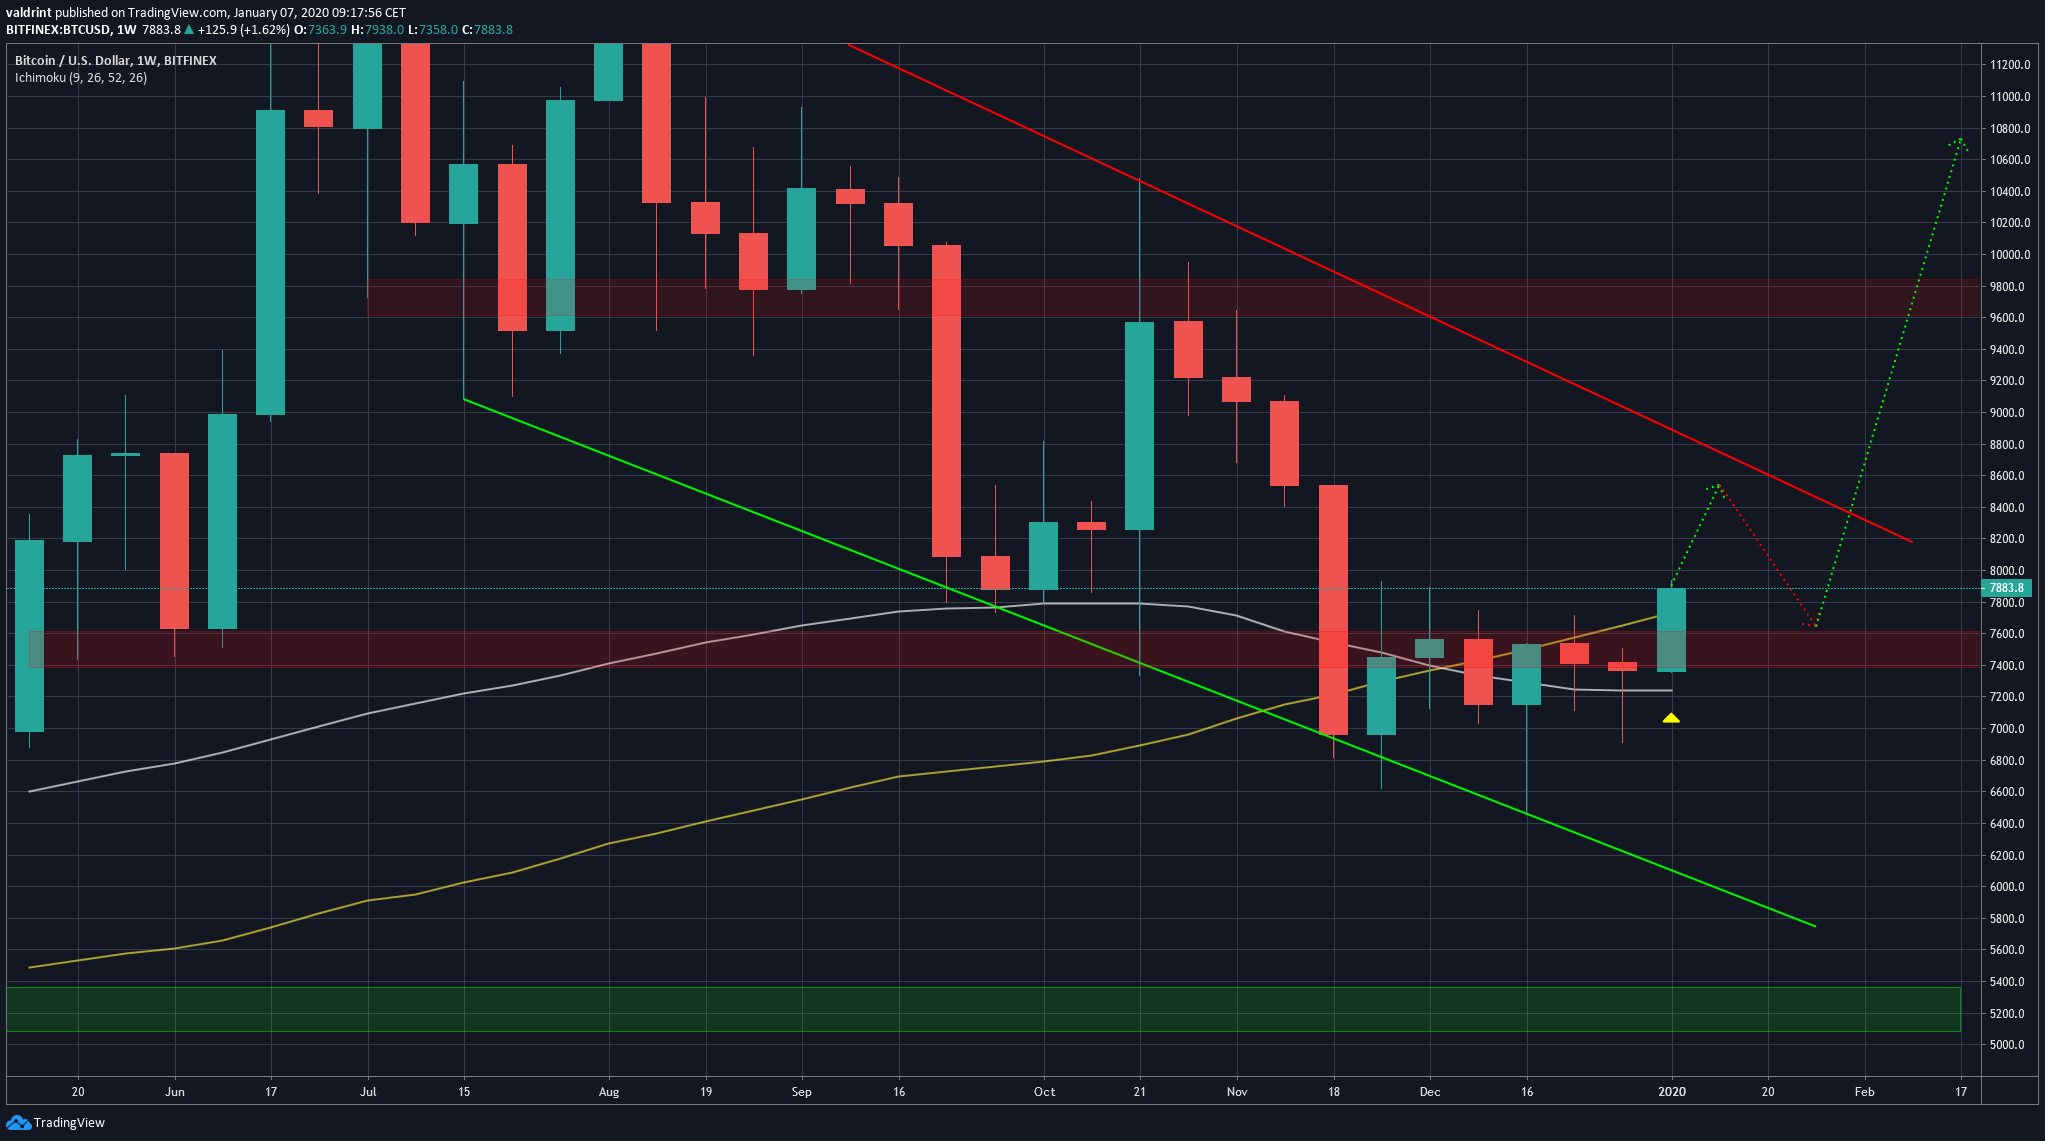
The weekly chart reveals that the Bitcoin price is finally moving above the previous breakdown level and with it the 50- and 100-week MAs.
This movement is instrumental for BTC since it suggests that the long-term bottom could be in. The decrease of November 18-25 could not be sustained and the price is in the process of reclaiming the lost support area.
A rough outline of future movement would a continued upward move to the resistance line of the channel, followed by a retest of the $7600-$7800 area, before a breakout from the descending channel that has been marking the downtrend since June 26.
Future Movement
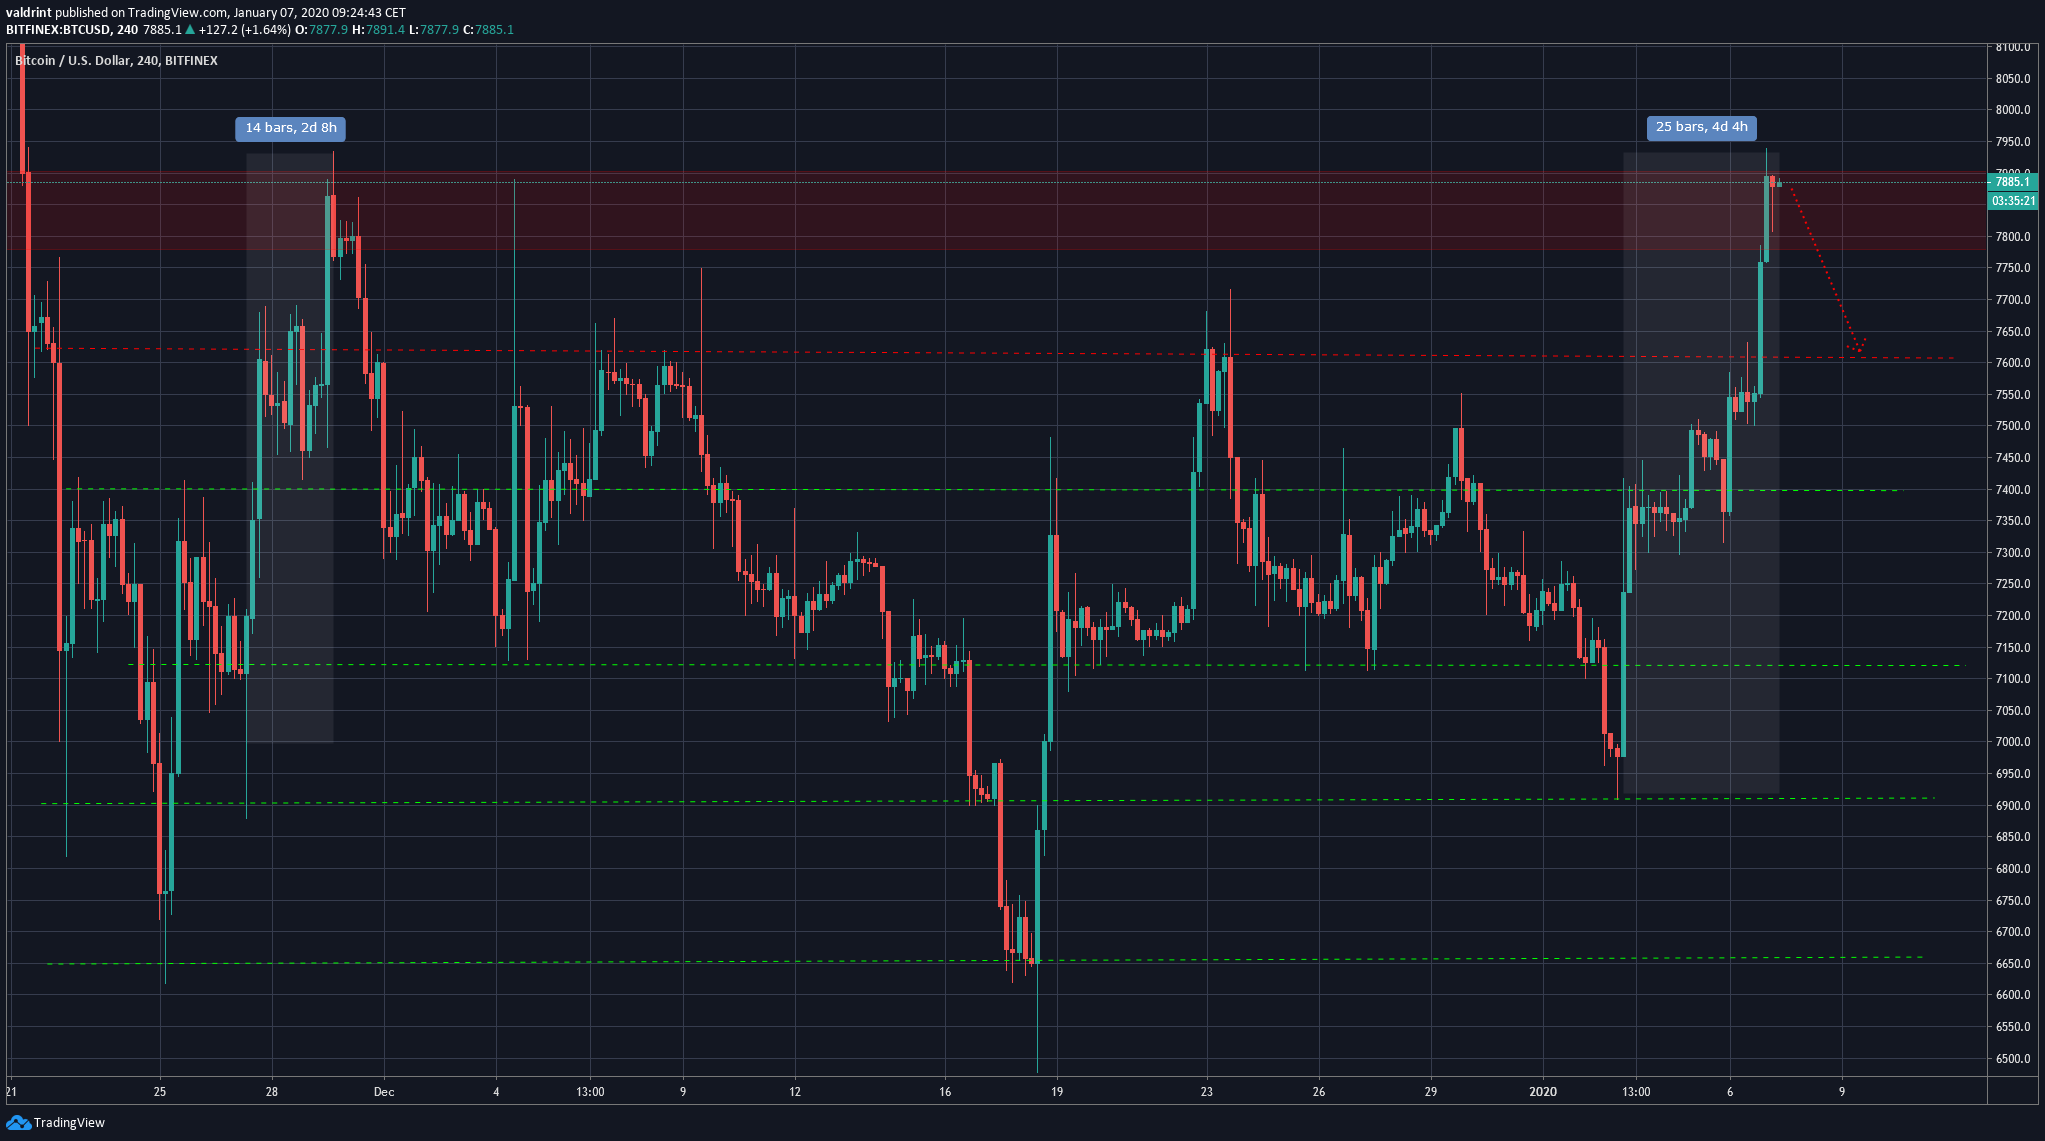
Looking at the entire range, we can see that the Bitcoin price has reached the top of the range. This movement has been very rapid and looks very similar to that at the end of November.
Since the current movement is parabolic and has yet to show any weakness, we are not ruling out a continued price increase that takes us all the way to $8800. However, the most common movement here would be a retest of the $7600 area before the price makes another attempt at breaking out.
To conclude, the Bitcoin price broke out from the long-term inverse head and shoulders pattern and has reached a significant resistance area at $8800. The medium- and long-term outlook is bullish, while the short-term is neutral leaning on bearish.
Good luck and happy trading! For our previous analysis, click here.
