High gains, retail euphoria, and massive rallies haven’t really been on Bitcoin’s plate for the past few months. The BTC price still struggling below the $20,000 mark, but on-chain indicators highlight that recovery from here could be slow and steady.
Bitcoin was stuck in a range between $19,500 and $18,700 last week. It opened this current week at a price of $18,900, but sentiment around Bitcoin and its price developments remained relatively high.
Social indicators sourced from Santiment showed a spike in Bitcoin interest on social platforms over the past weekend. Among the top 100 crypto assets, BTC was hot topic in over 26% of the discussions for the first time since mid-July.
Long-term BTC HODLers remain dormant
The total volume of Bitcoin coin-days destroyed in the last 90-days has, effectively, reached an all-time low. This shows a high number of HODLed coins have been dormant for several months.
Prior to this CDD all-time lows were observed in July 2020, August 2018, October 2016, and June 2015. During the previous ATLs, the BTC price was also in consolidation phases near lower long-term support levels.
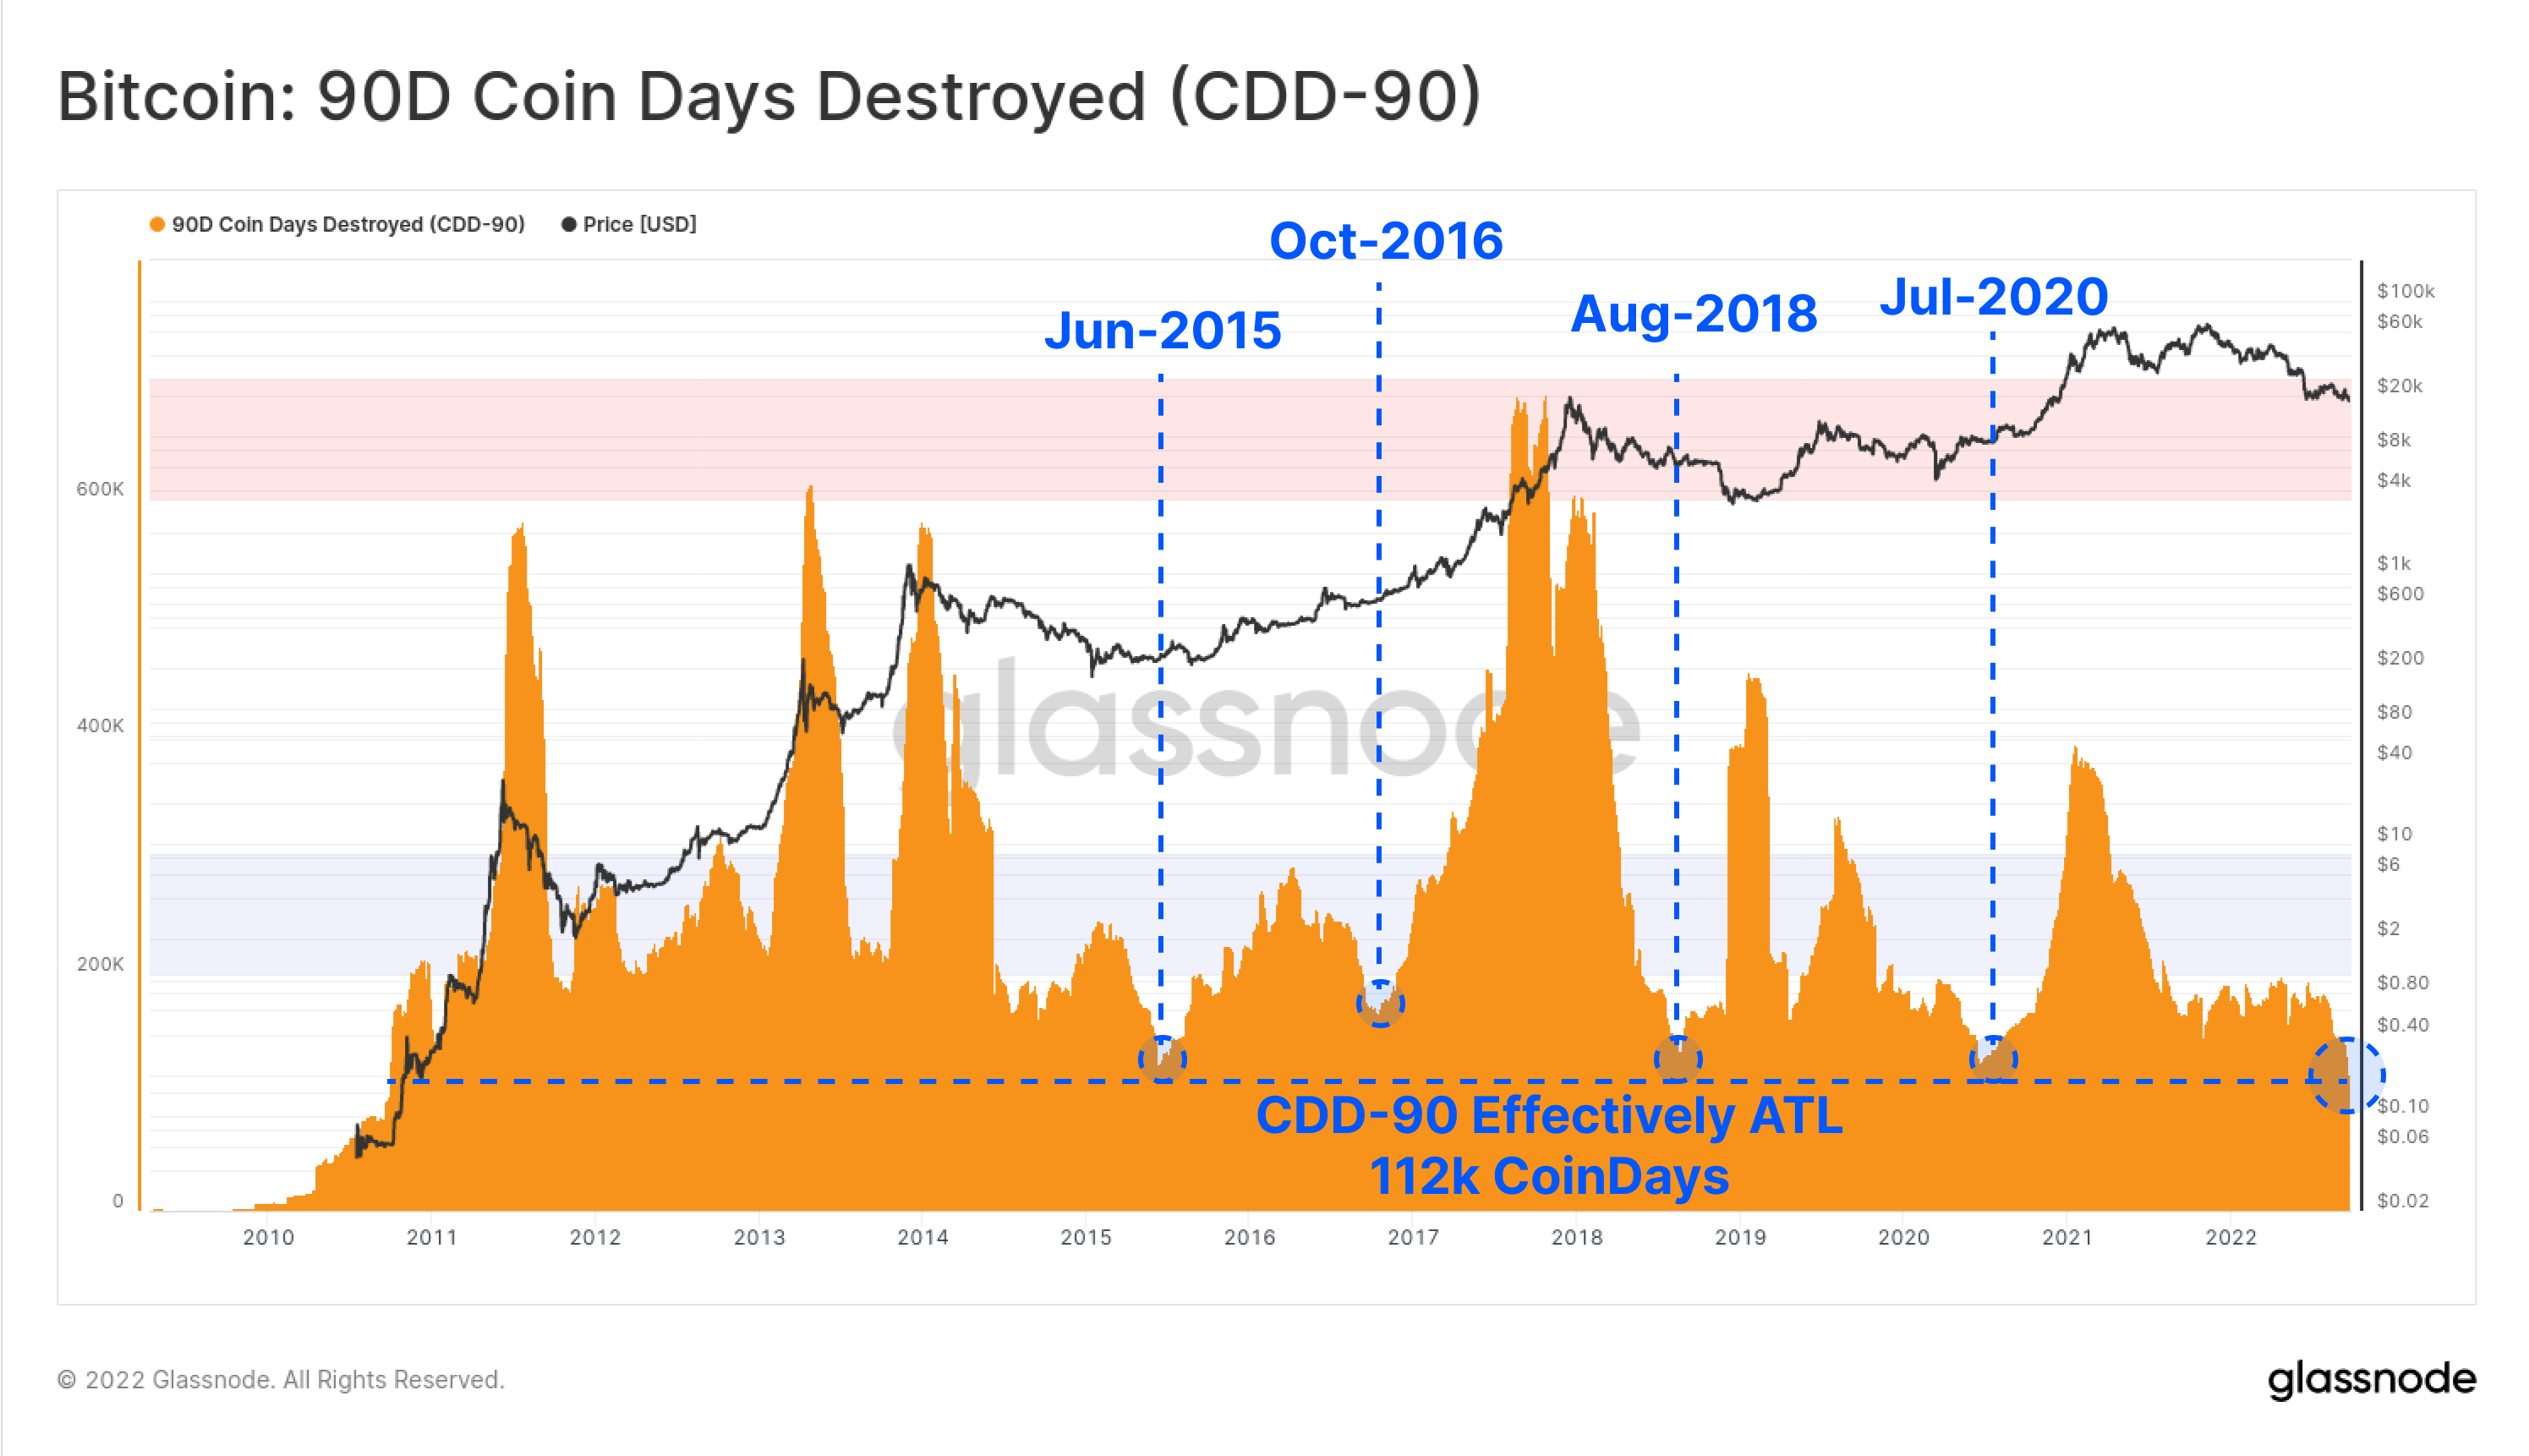
Coin Days Destroyed (CDD) is a measure of economic activity which gives more weight to coins that haven’t been spent for a long time. A low CDD count means that bitcoins that have been held long term are mostly staying untouched.
The high number of dormant coins can mean that conviction in BTC is high. This is also likely due to reduced interest amid a bear market, leading to lower on-chain activity and thus lower indicator values.
Accumulation still continues, but what about whales?
Another interesting trend was that coins older than three months now account for an ATH of 86.3% of all the BTC supply in terms of USD value. Looking at the Realized Cap HODL Waves chart, it’s evident that despite the recent price headwinds, Bitcoin HODLers appeared to be steadfast and unwavering in their conviction.
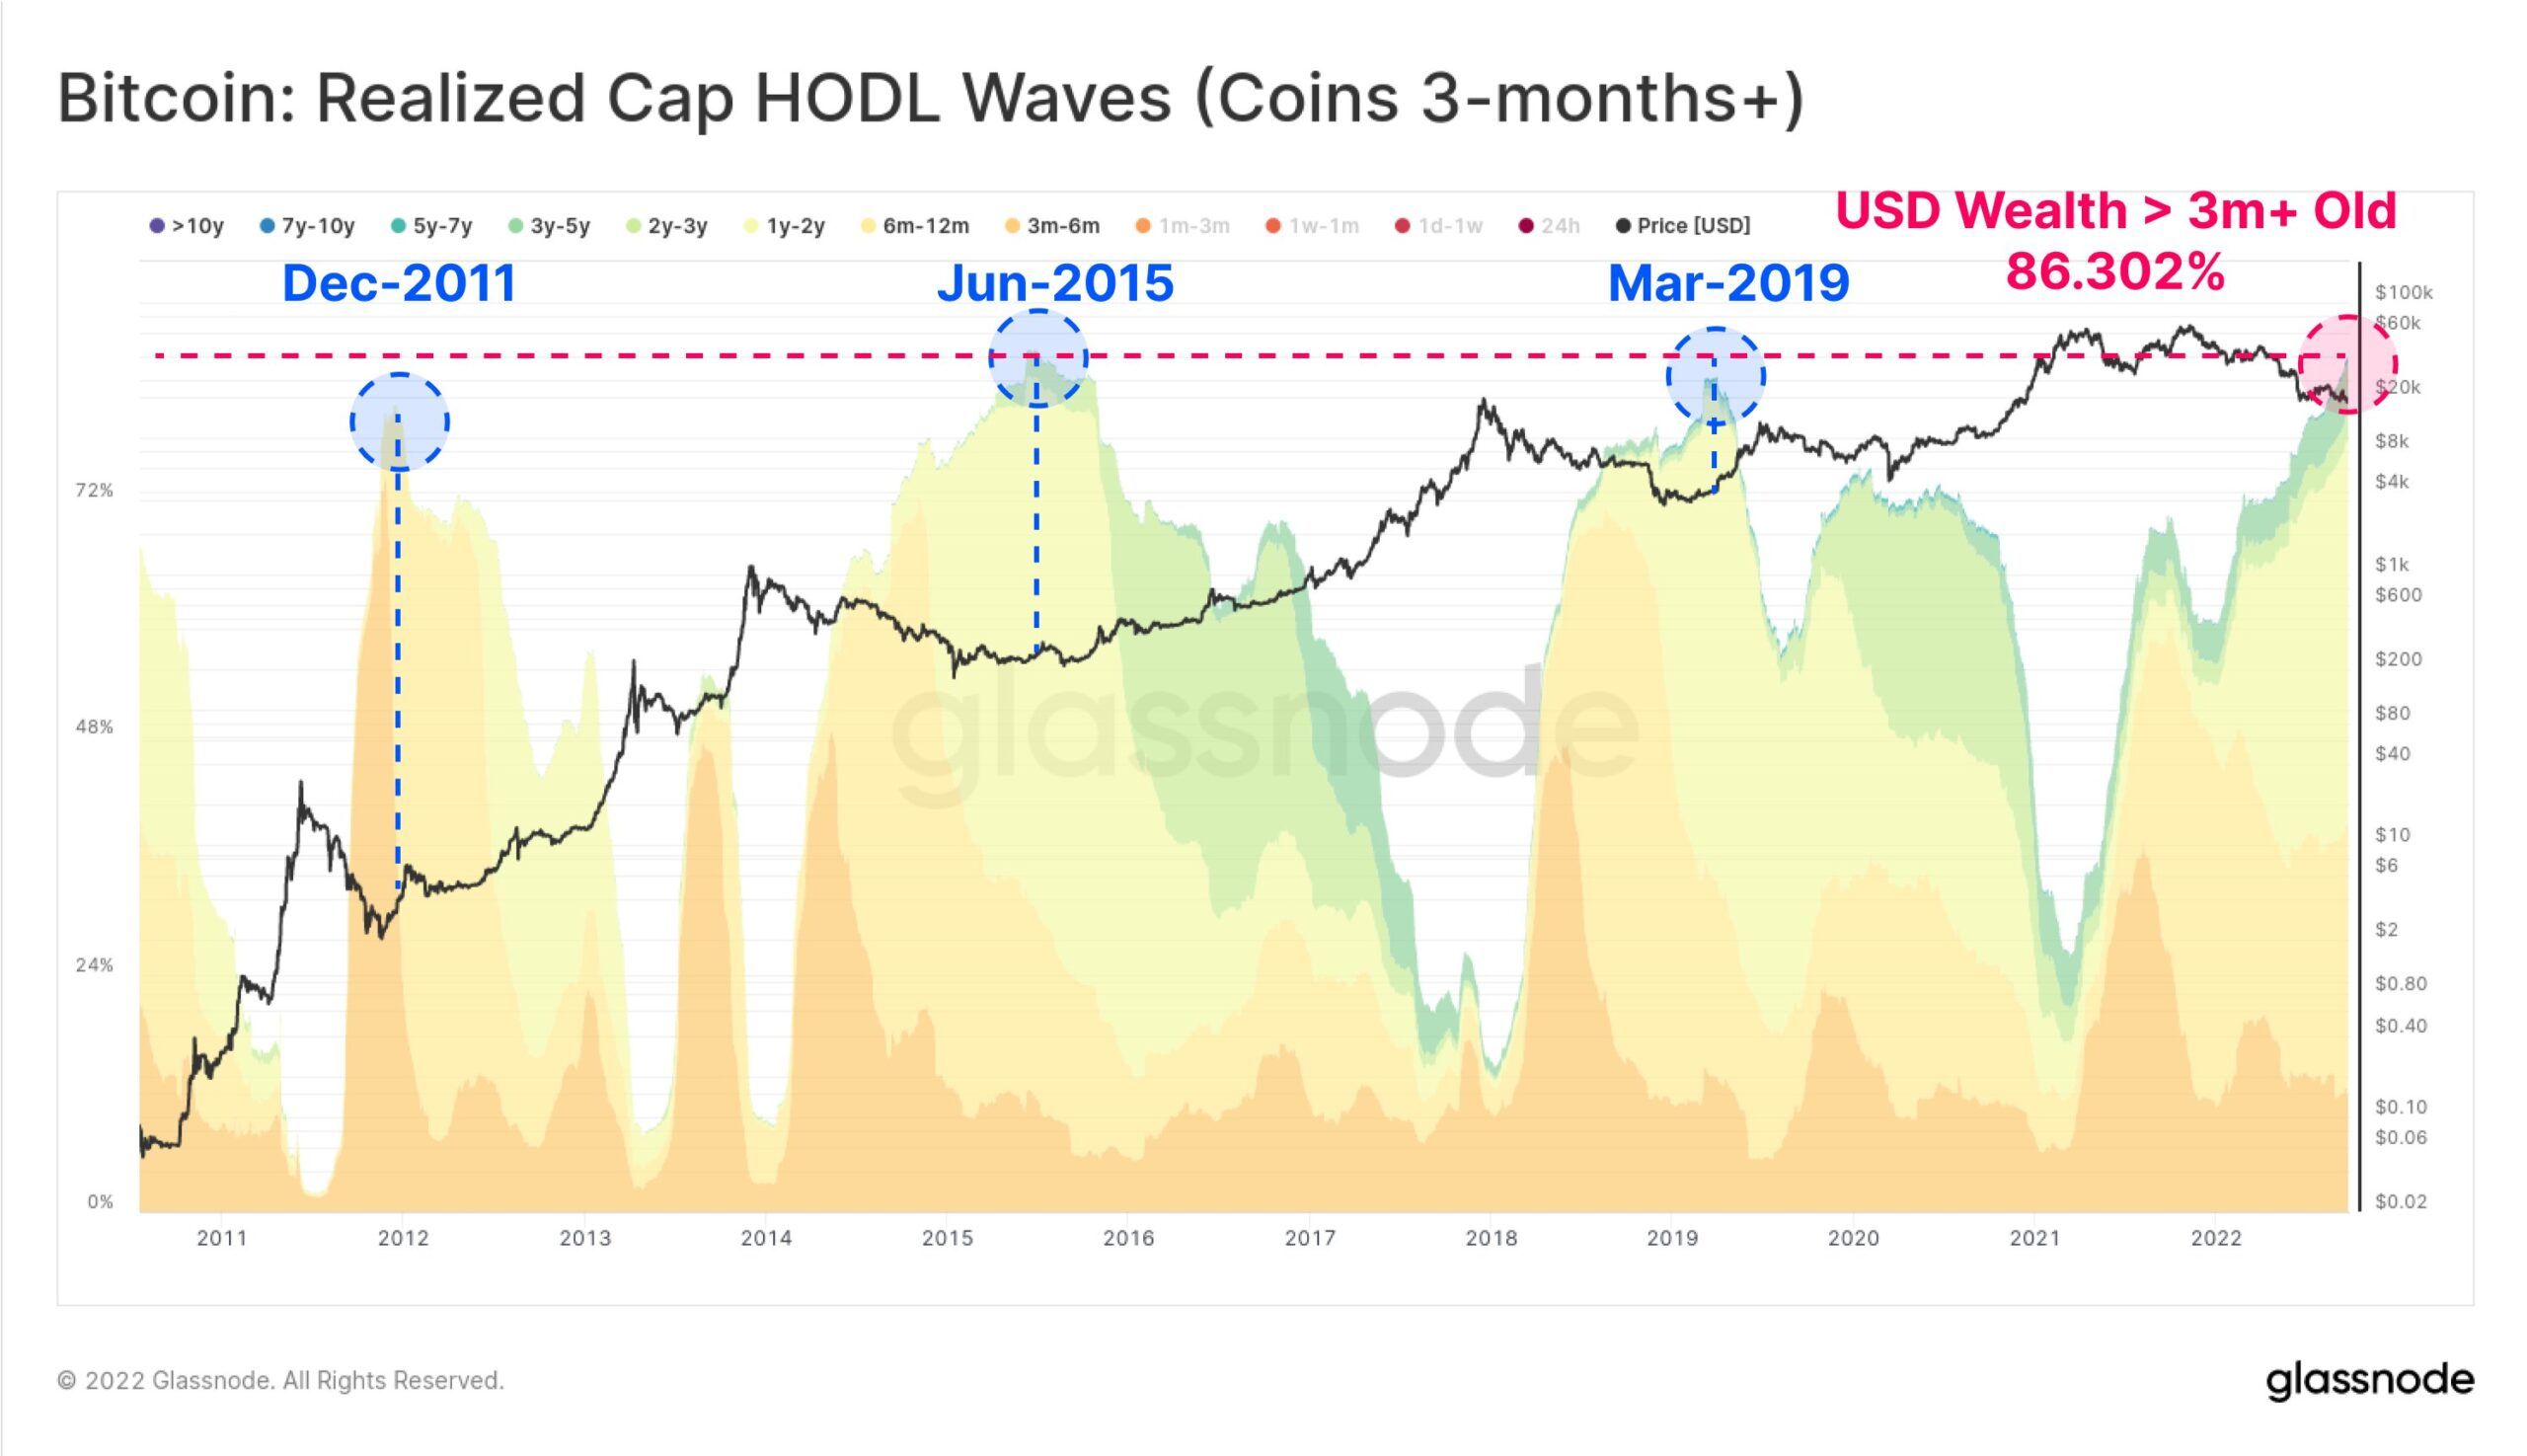
The growing number of older coins highlights how accumulation has been intact at lower prices. Previous ATHs of coins older than three months have coincided with market bottom prices, but consolidation could continue due to other macroeconomic factors.
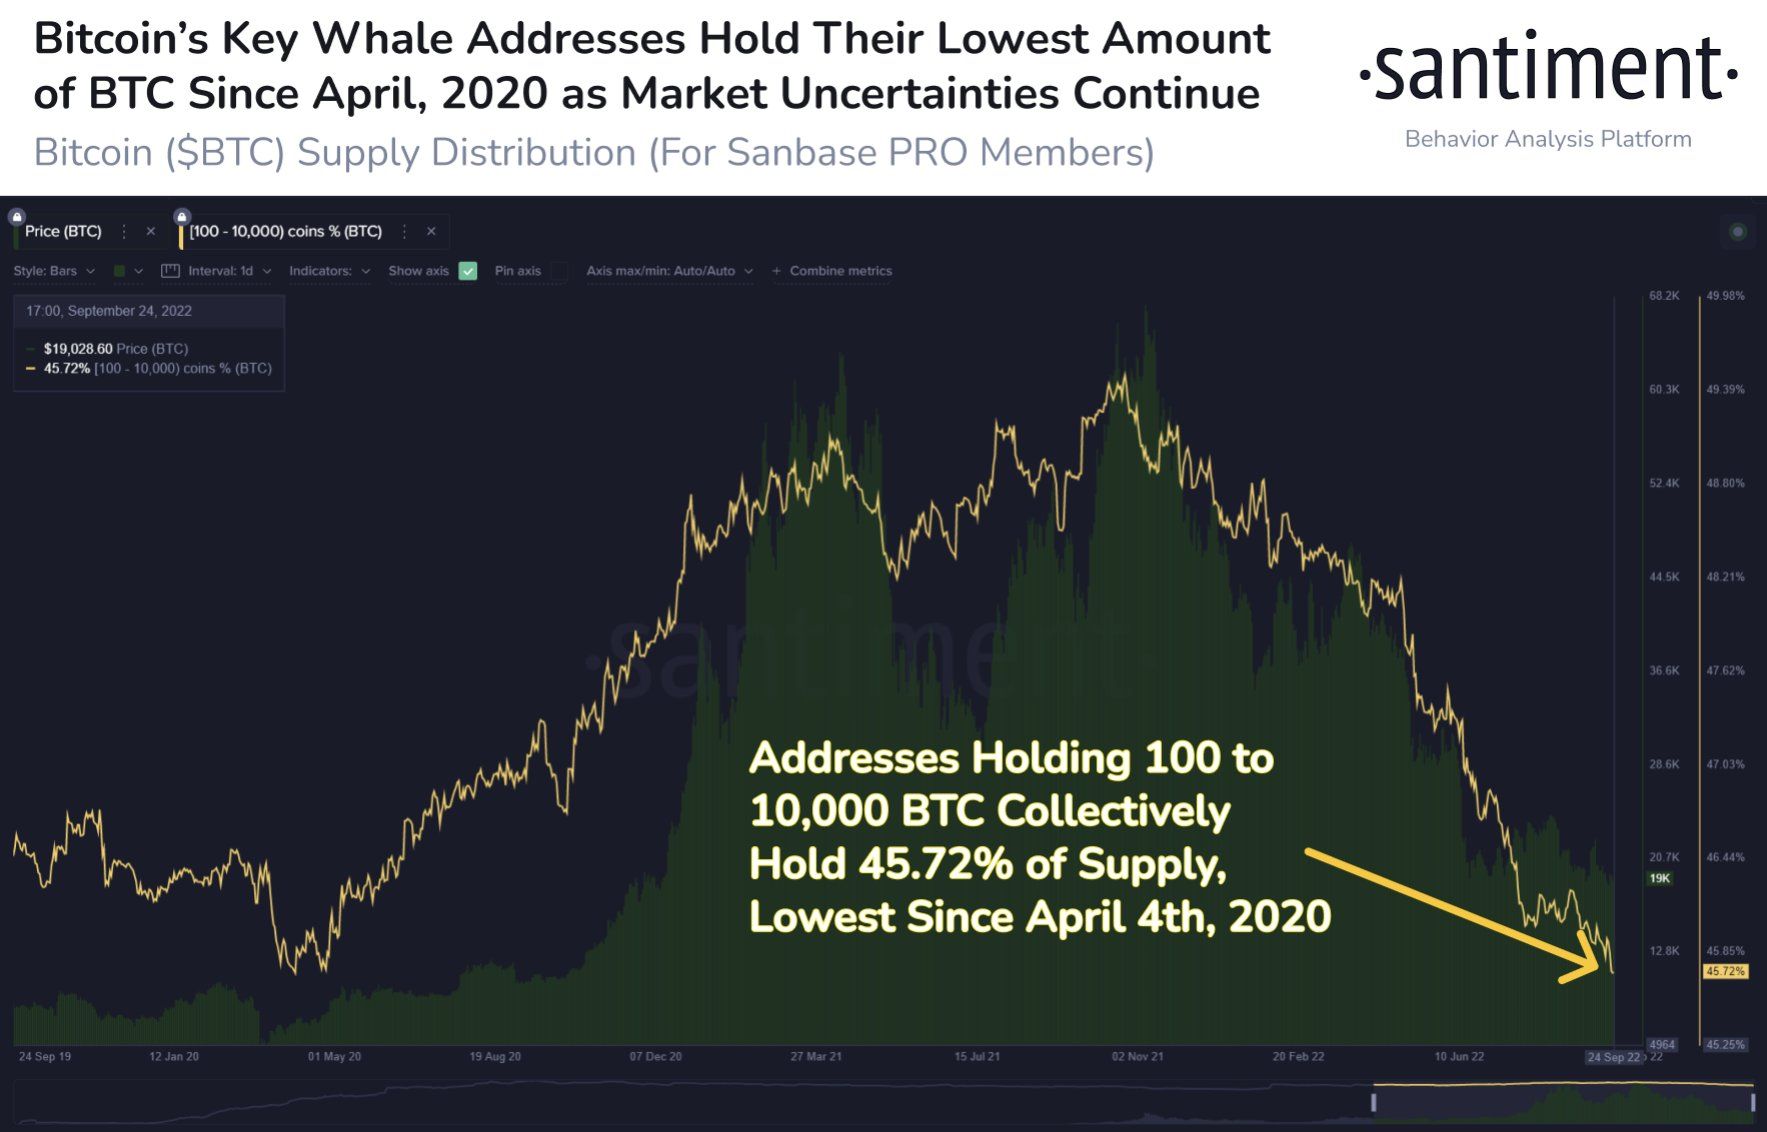
Additionally, a worrying trend was seen in the whale address chart. Notably, the amount of Bitcoins held by whales has been dropping steadily for the past 11 months now.
While long-term holders have continued to accumulate, the supply held by whales (100-10,000 BTC in this case) has reached a 2.5-year low.
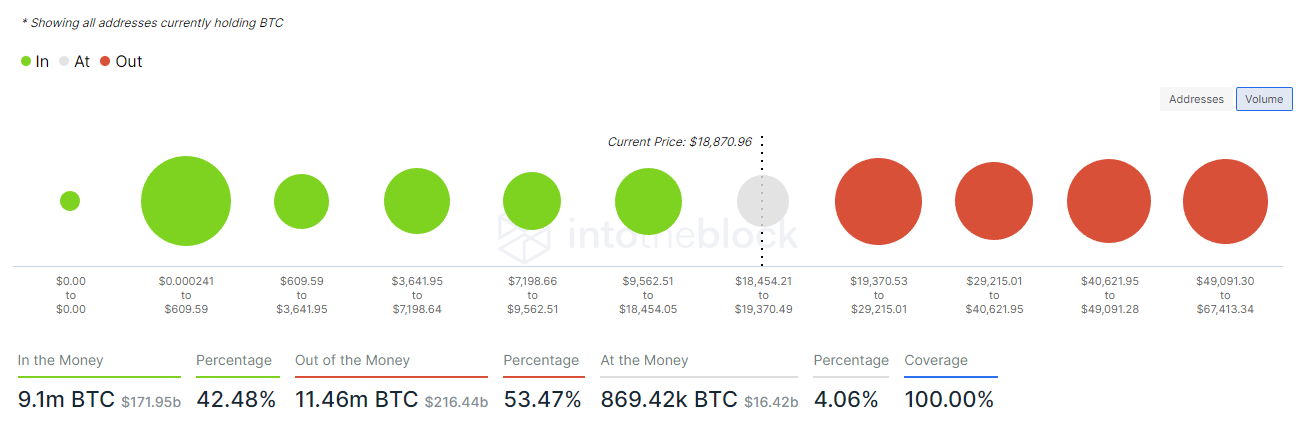
Seemingly, in the short-term, the next crucial barrier for BTC would be at the $19,025 mark where 869,000 BTC is held by over 1.6 million addresses, as per data from IntoTheBlock’s In and Out of Money Indicator.