


On July 2, 2019, the Binance Coin (BNB) price reached a high of 34,484 satoshis. A decrease ensued. On July 10, it made a low of 24,192 satoshis. It has been increasing since. On two separate occasions, July 17 and 22, it reached highs close to 31,000 satoshis.
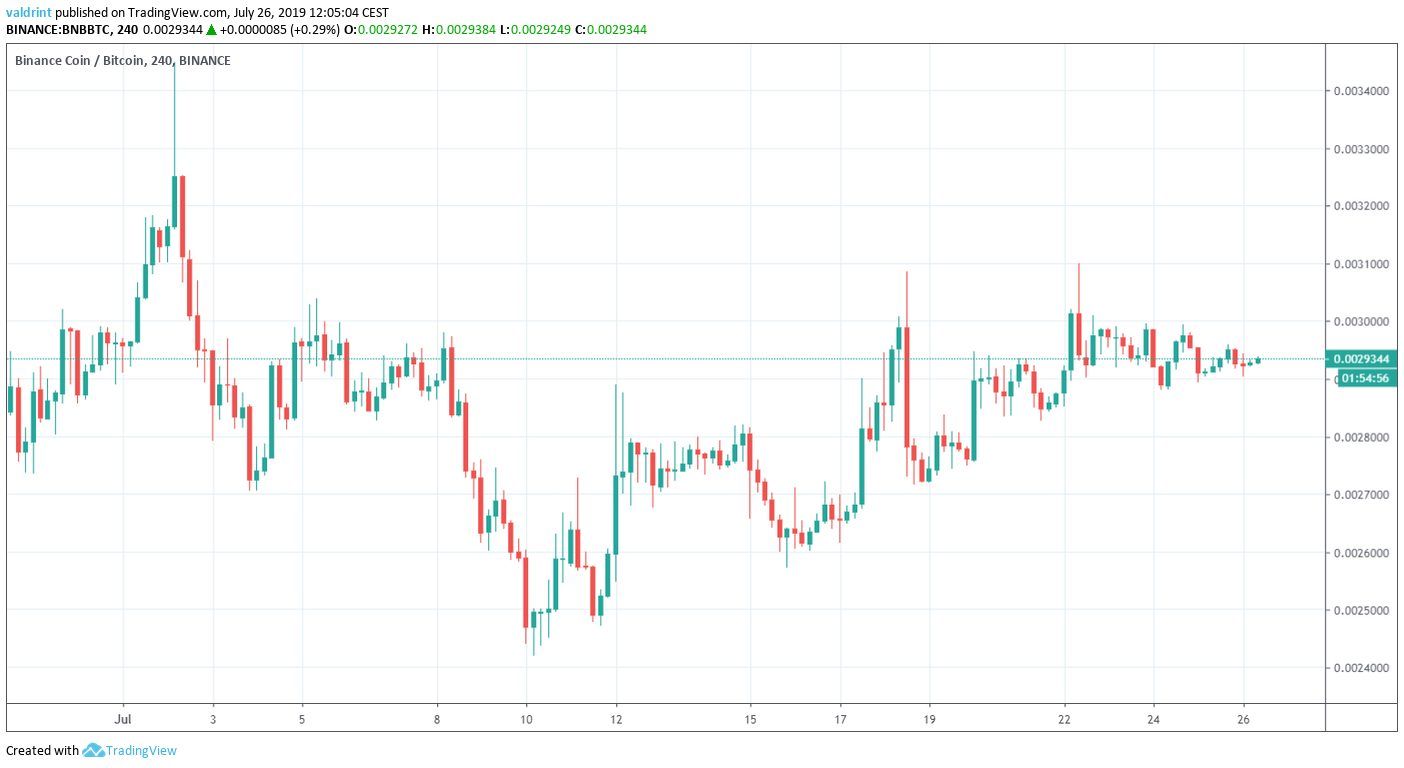
Will the BNB Price continue to increase or will more decreases await? Keep scrolling if you are interested in knowing the answer.
For our previous analysis click here.
If you are interested in trading cryptocurrencies with a multiplier of up to 100x on our new partner exchange with the lowest fees, follow this link to get a free StormGain account!
BNB Price: Trends and Highlights for July 26
- BNB/BTC is trading inside a symmetrical triangle.
- There is support at 26,500 satoshis.
- Daily moving averages are bullish.
- The short-term RSI suggests a price decrease.
- There is resistance at 40,000 satoshis.
Previous & Current Pattern
A look at the daily time-frame shows that the BNB price has been trading inside a descending wedge beginning on May 13.
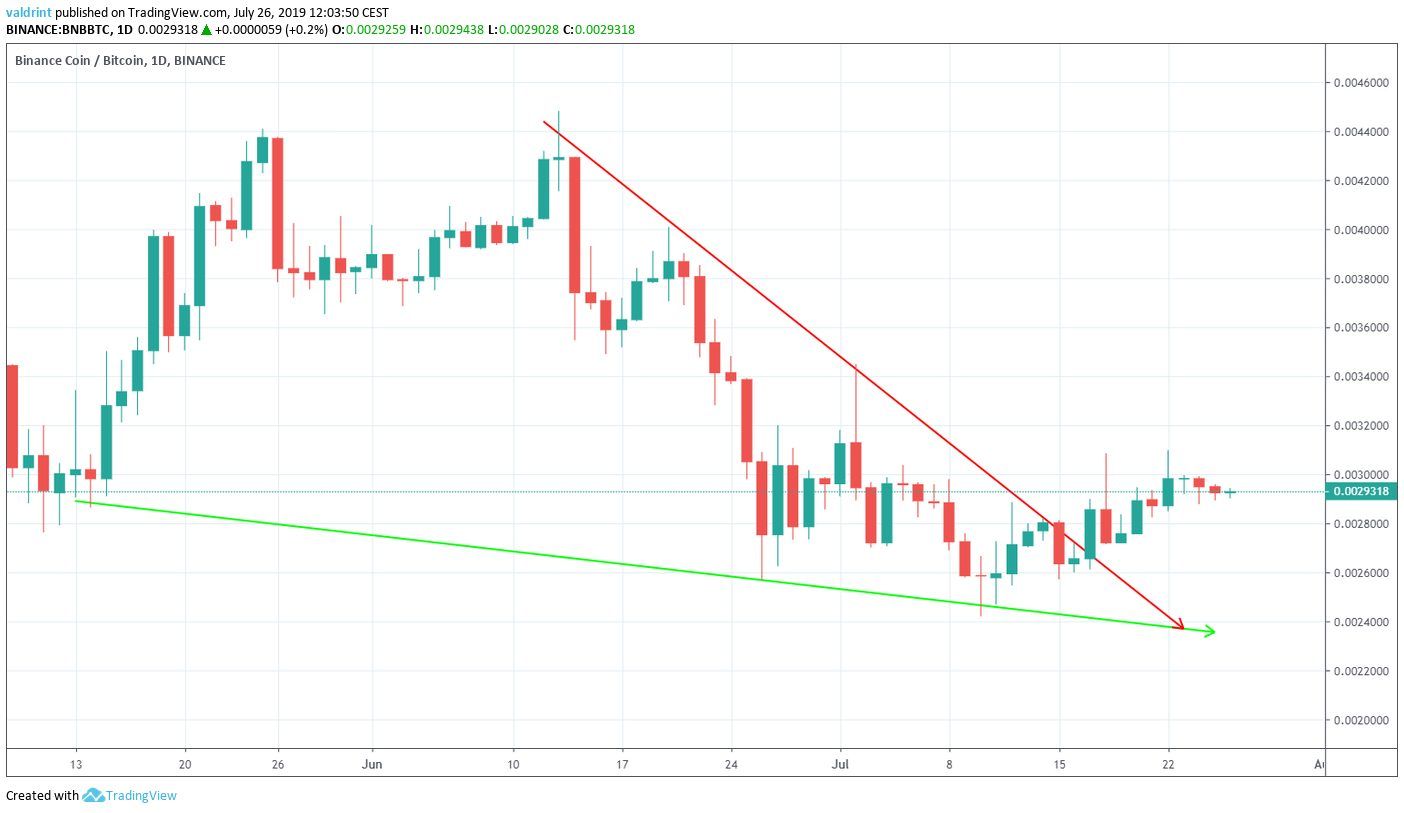
On July 27, the price broke out from this wedge.
Since the breakout, it has been trading inside the symmetrical triangle outlined below.
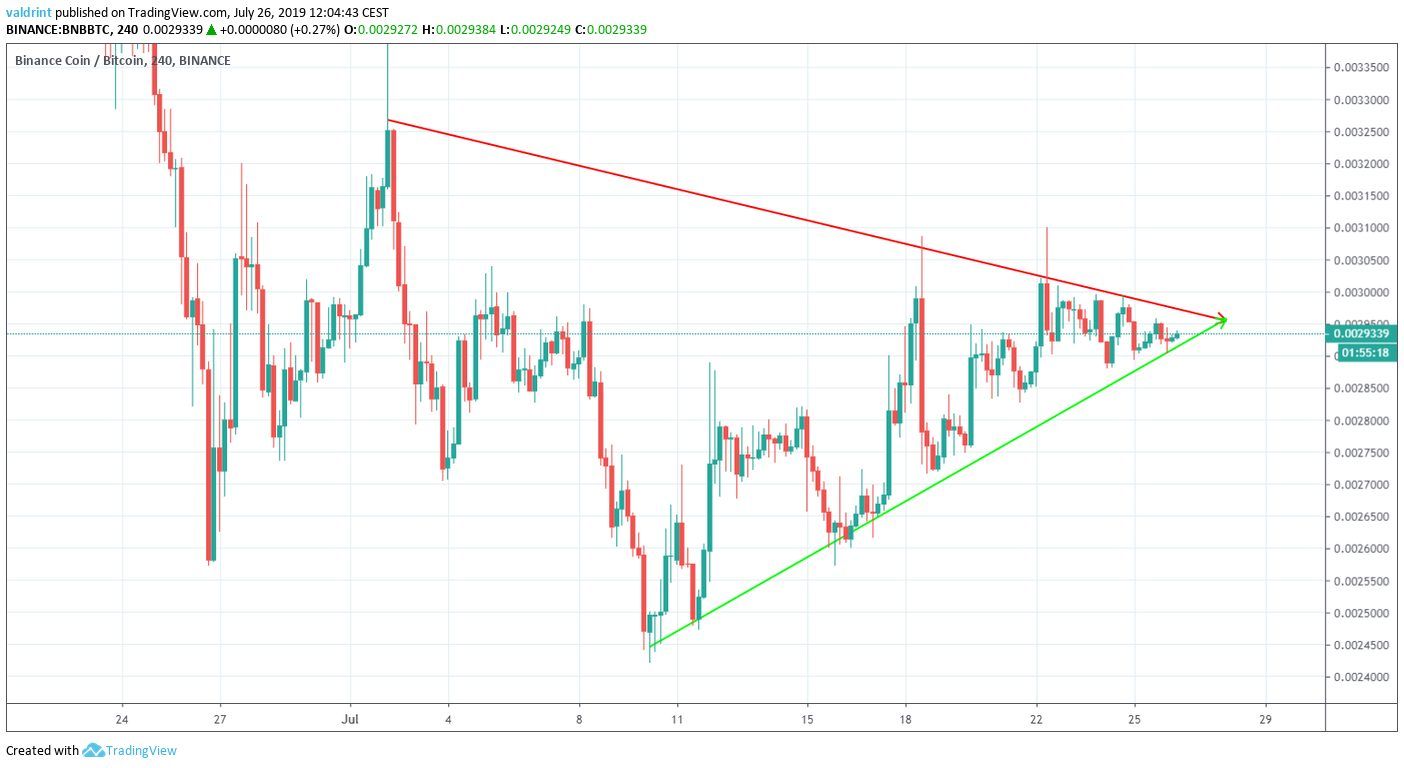
At the time of writing, it was nearing the projected end of the triangle, at which point a decisive move should occur.
Since the symmetrical triangle is considered a neutral pattern, both a breakout and a breakdown are possible.
Let’s take a closer look and see which one is more likely to transpire.
Binance Coin Price Long-Term Support
A look at the daily time-frame shows that the beginning of the triangle coincided with a significant support area.
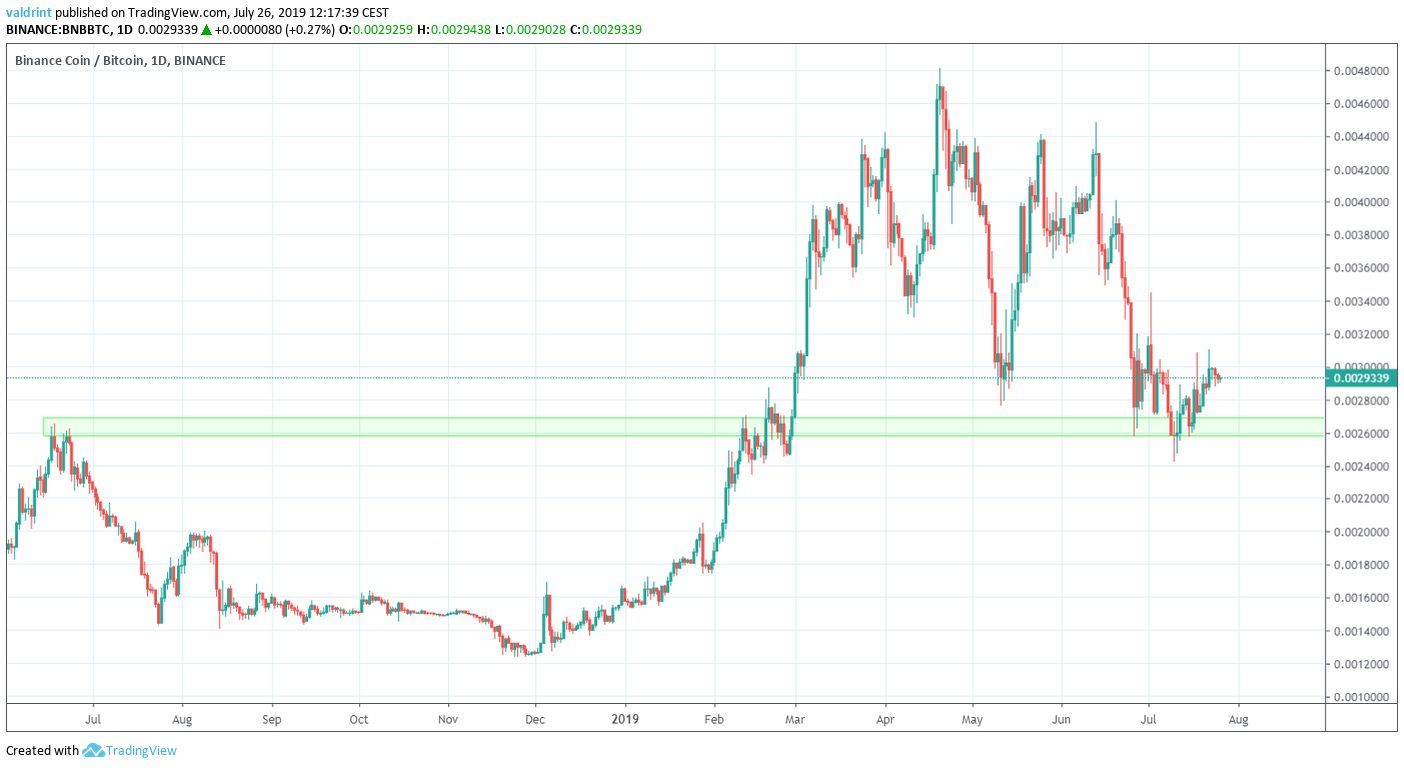
The area is found at 26,500 satoshis.
The fact that the initiation of the triangle occurred in a significant support area gives us our first bullish sign.
The second one is given by the moving averages (MA).
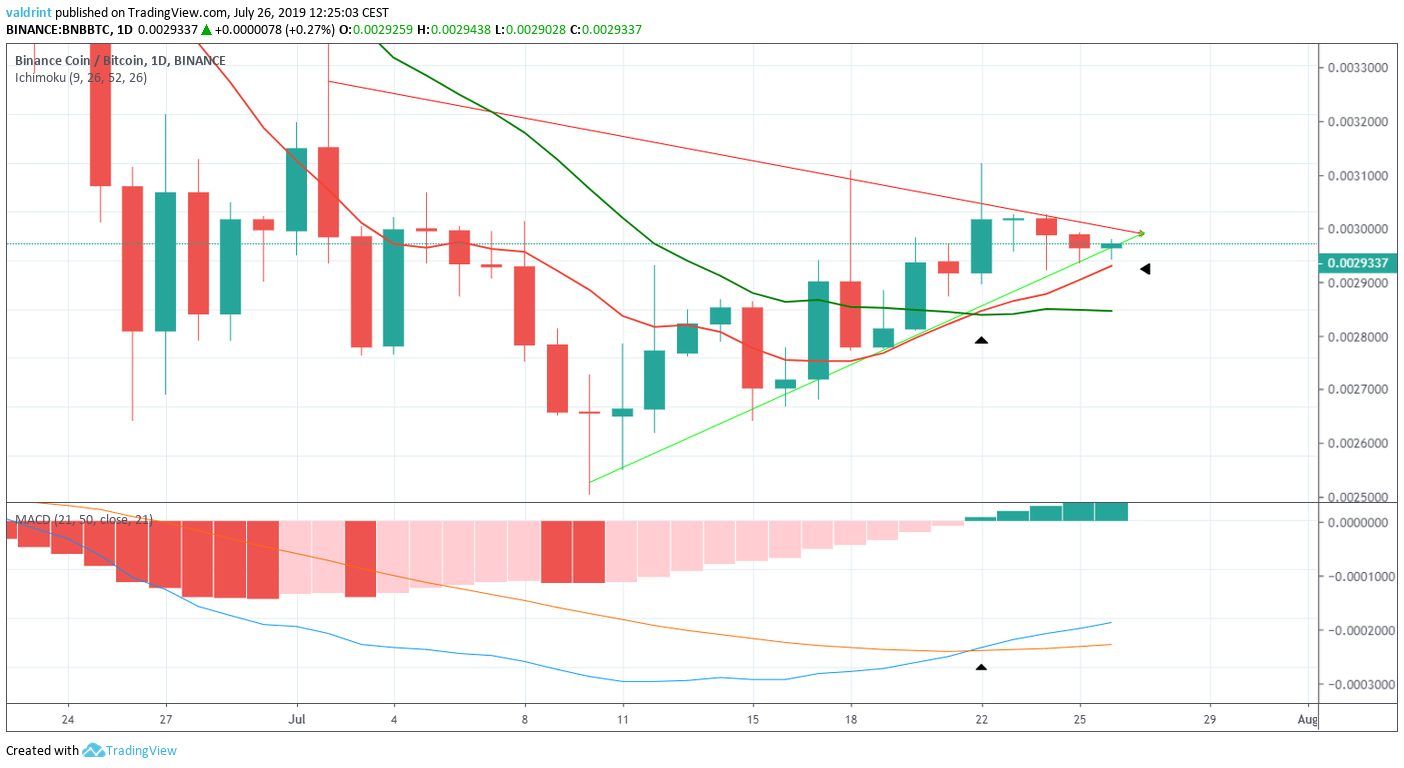
A bullish cross transpired between the 10- and 20-day MAs on July 21.
At the time of writing, the BNB price is trading above both.
Its significance is strengthened since the MACD also made a bullish cross the same day.
So, it is likely that the price will break out of the triangle.
However, this breakout might not occur immediately.
The short-term RSI suggests that a price decrease is likely.
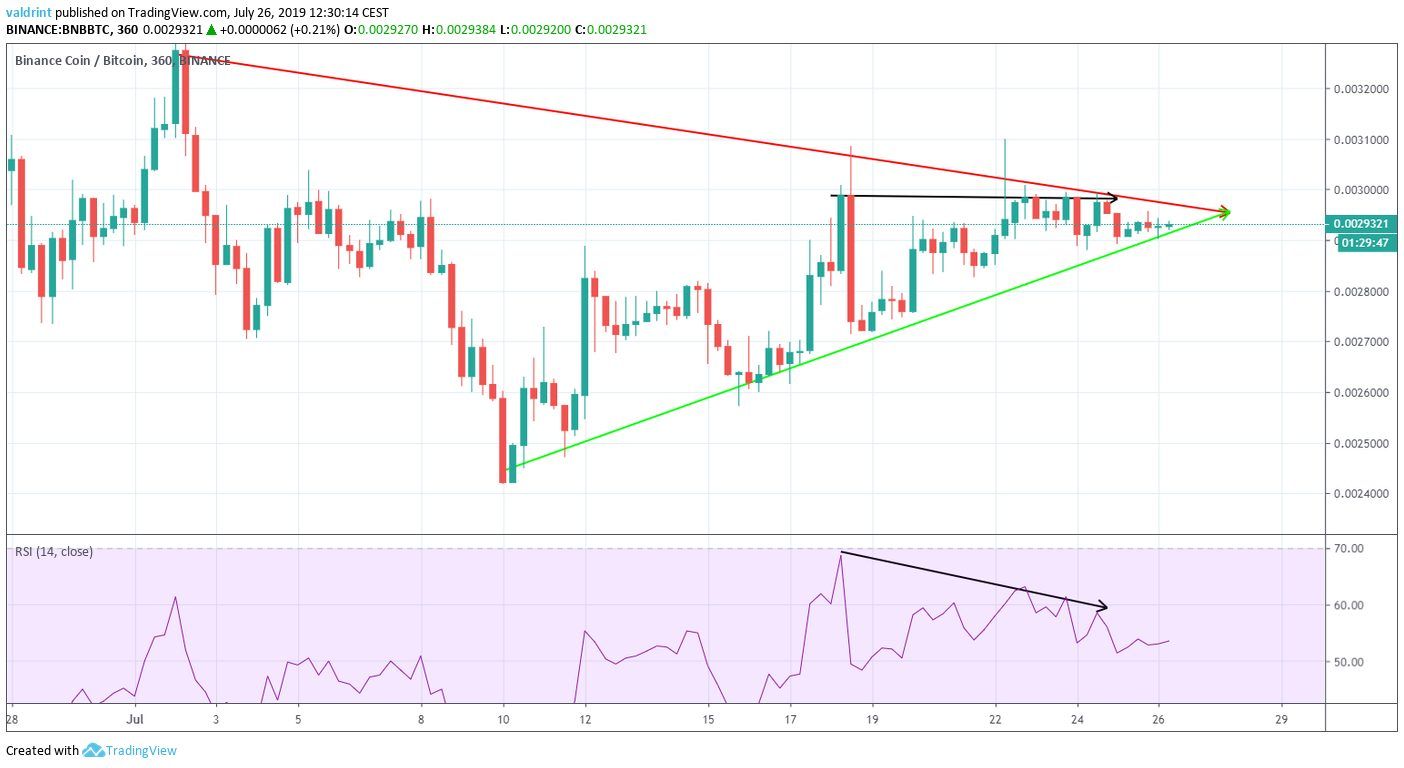
Since July 17, when the price first reached a high of 30,000 satoshis, the RSI has been generating bearish divergence.
Since a decrease has yet to occur, we believe that the price will do so in the short-term, before eventually breaking out.
Reversal Areas
If the Binance Coin price breaks out, one area that can provide a reversal is outlined below.
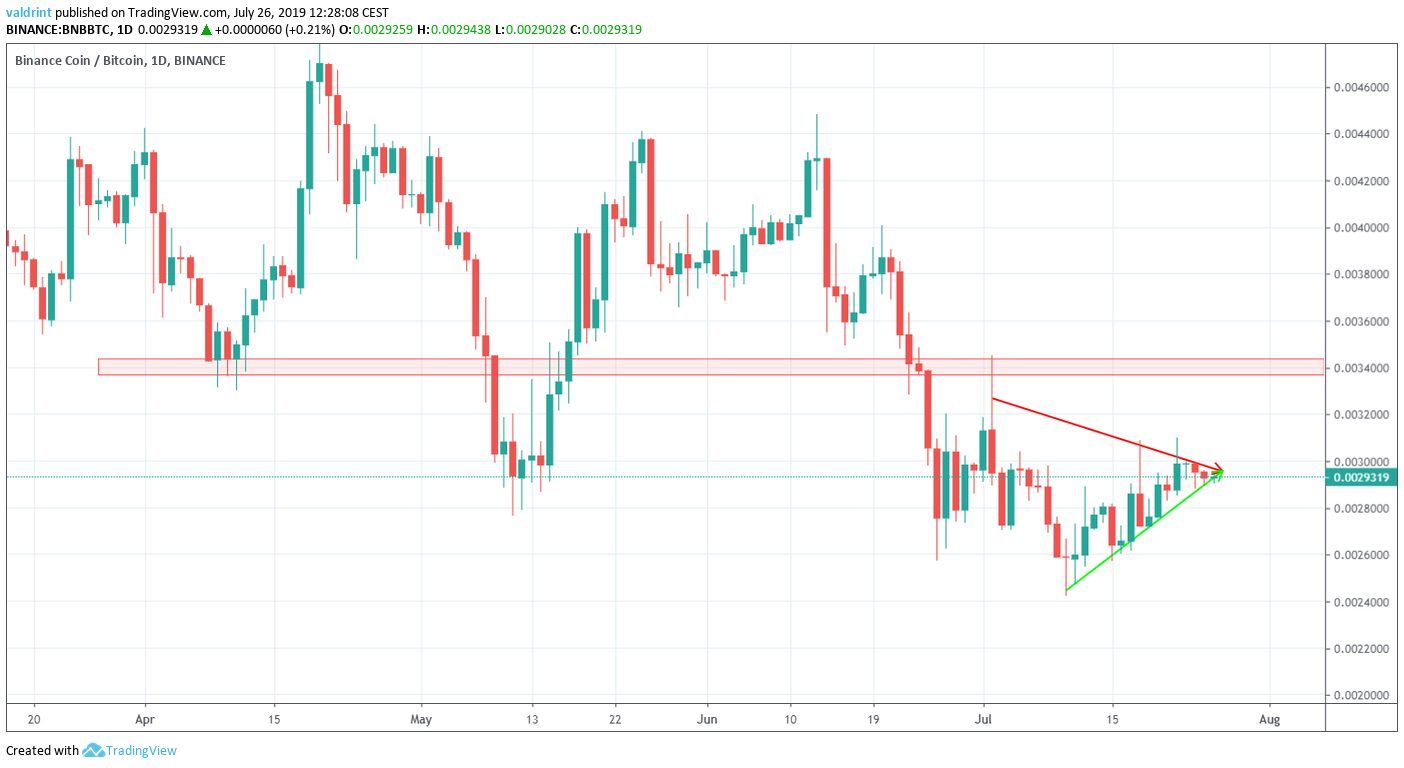
The closest resistance area is found near 40,000 satoshis.
We believe that the price will reach it.
Summary
The BNB price is trading inside a symmetrical triangle.
According to our analysis, BNB is likely to break out.
However, a short-term decrease could occur before it does.
Do you think the Binance Coin price will reach the resistance area outlined above? Let us know in the comments below.
Disclaimer: This article is not trading advice and should not be construed as such. Always consult a trained financial professional before investing in cryptocurrencies, as the market is particularly volatile.
Images are courtesy of Shutterstock, TradingView.


