
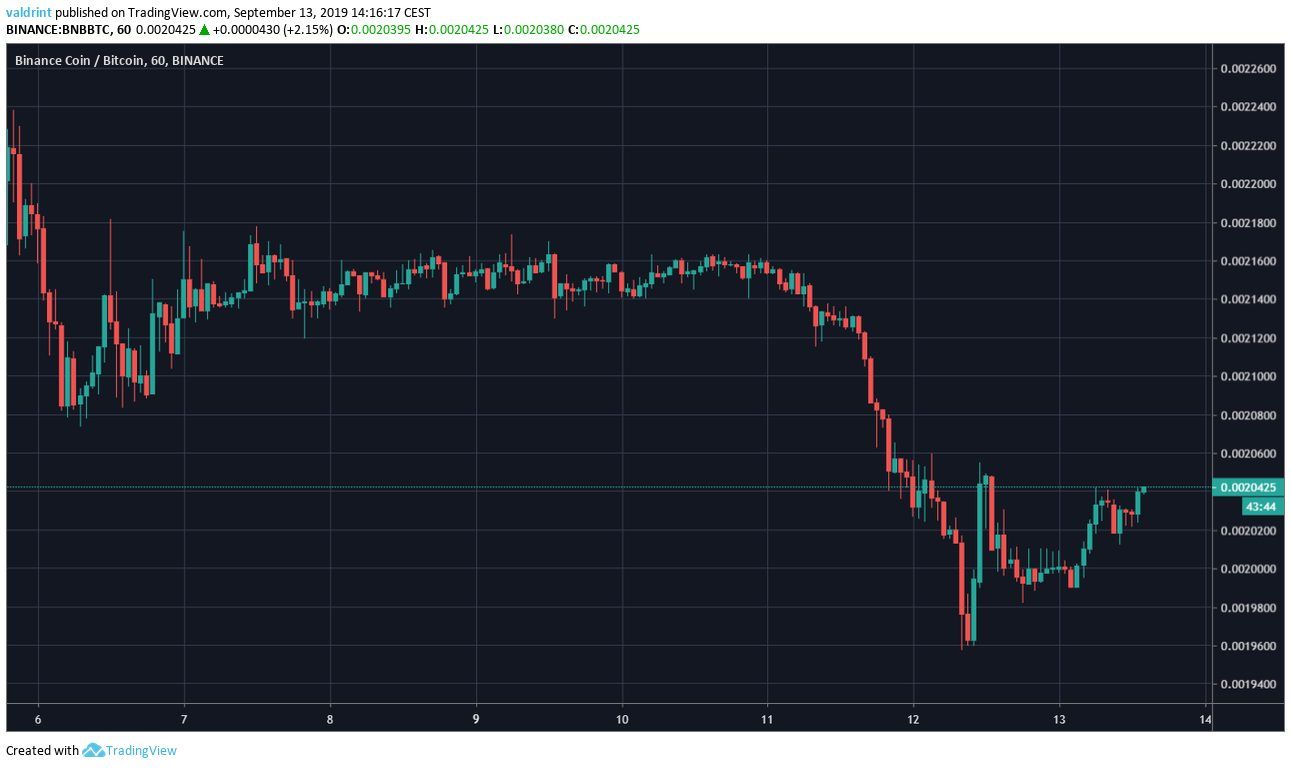
On September 5, 2019, the Binance Coin price reached a high of ₿0.00223. A period of gradual decrease and consolidation followed, lasting until September 11, when a rapid decrease began. The price reached a low of ₿0.00195 the next day. It has been increasing since.
Will BNB reach new highs, or are there further decreases in store? Keep reading below if you want to find out.
For our previous analysis, click here.
For those of you more interested in a video analysis, please click below:
https://www.youtube.com/watch?v=remBgZzo8Qs
Binance Coin Price: Trends and Highlights for September 13
- BNB/BTC is trading inside a descending channel.
- The daily RSI and MACD have generated bullish divergence.
- The price is trading inside a short-term ascending triangle.
- There is resistance at ₿0.00240.
Descending Channel
A look at the daily chart shows that BNB has been trading inside a descending channel since the beginning of July.
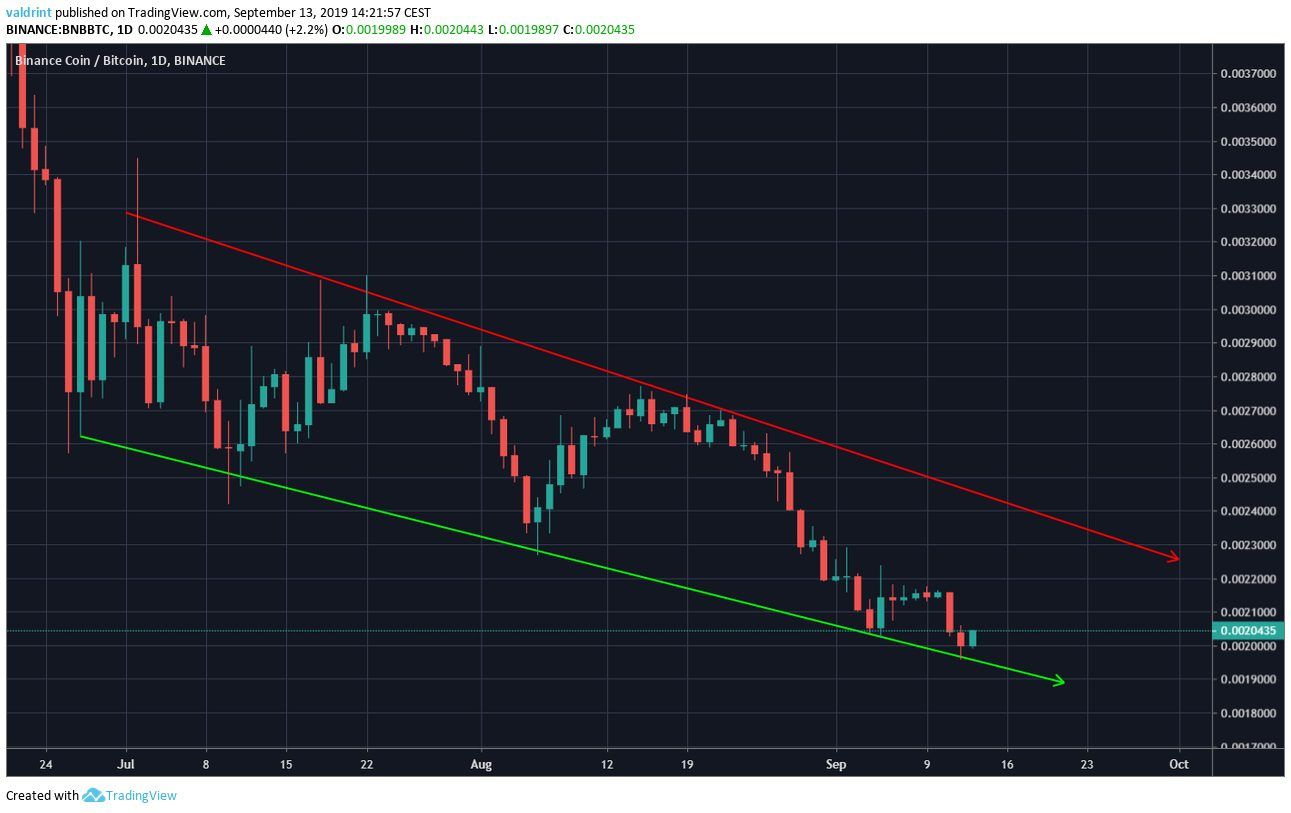
At the time of writing, the BNB price was trading right on the support line, having touched it for the fifth time.
The previous times it has done so, it began moving upward towards the resistance line.
Let’s take a look at technical indicators and see if that is likely.
Possible Reversal
A look at the RSI & MACD suggests that an upward move is likely to begin soon.
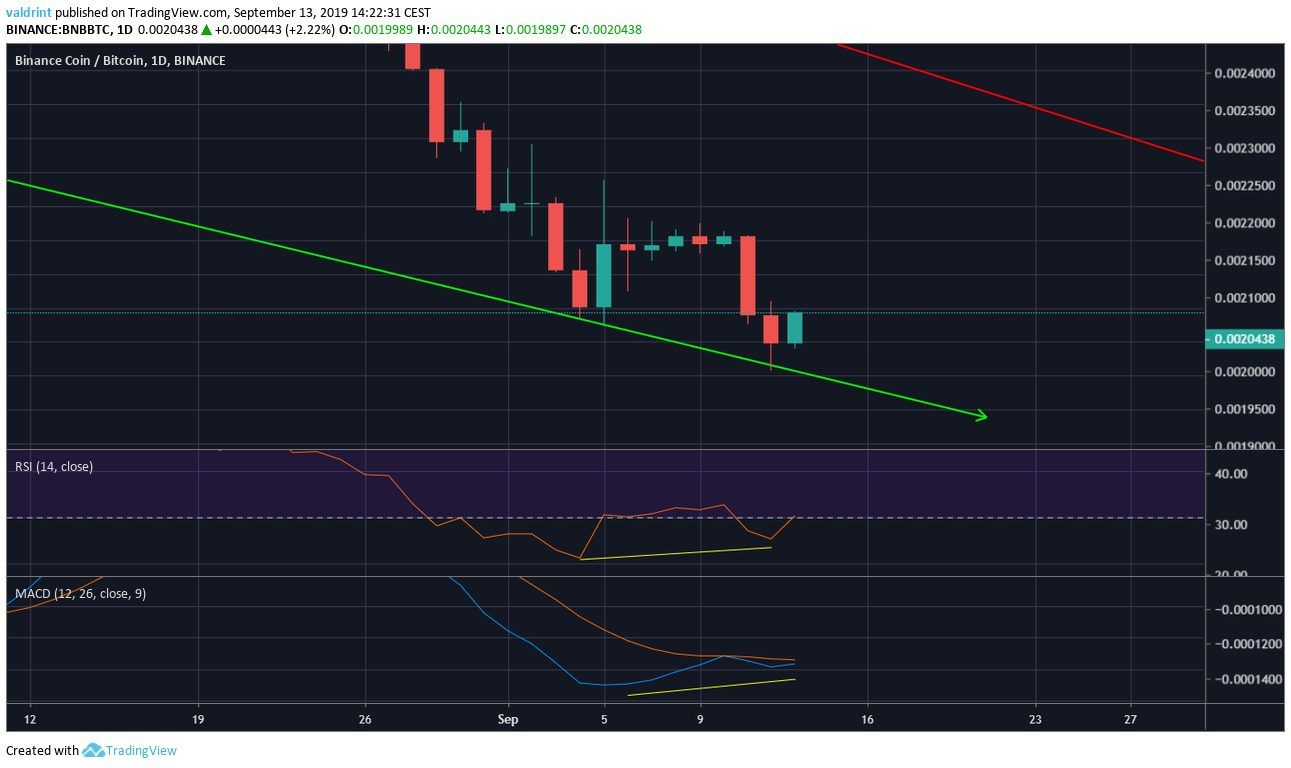
Both have been generating bullish divergence.
The divergence is especially visible during the two lower lows corresponding with the support line.
The fact that the divergence is transpiring on the support line and is visible in both indicators makes us believe that BNB will soon begin an upward move towards the resistance line of the channel.
Short-Term Movement
When we move back to the hourly chart, we can see that the price is trading inside an ascending triangle.
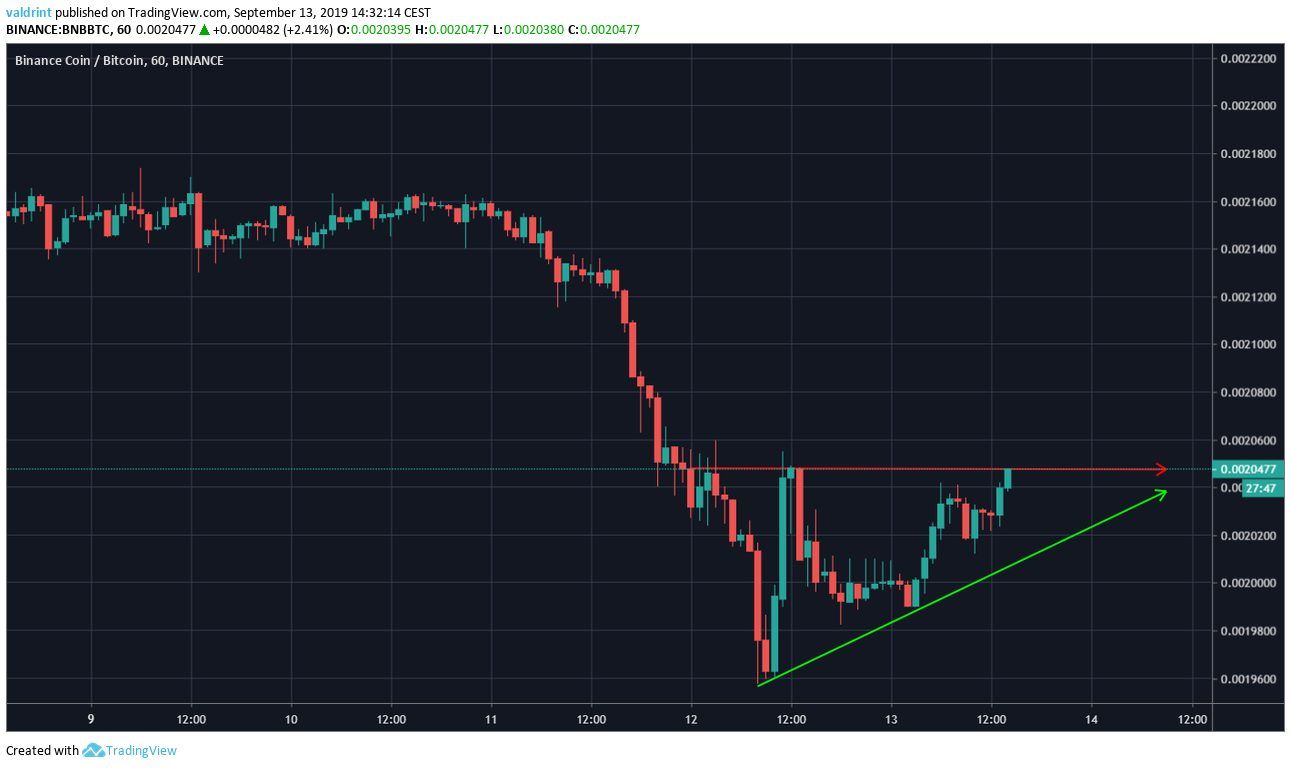
The ascending triangle is considered a bullish pattern, making a price breakout more likely.
Projecting the height of the triangle to the breakout point gives us a likely target for the ensuing breakout.
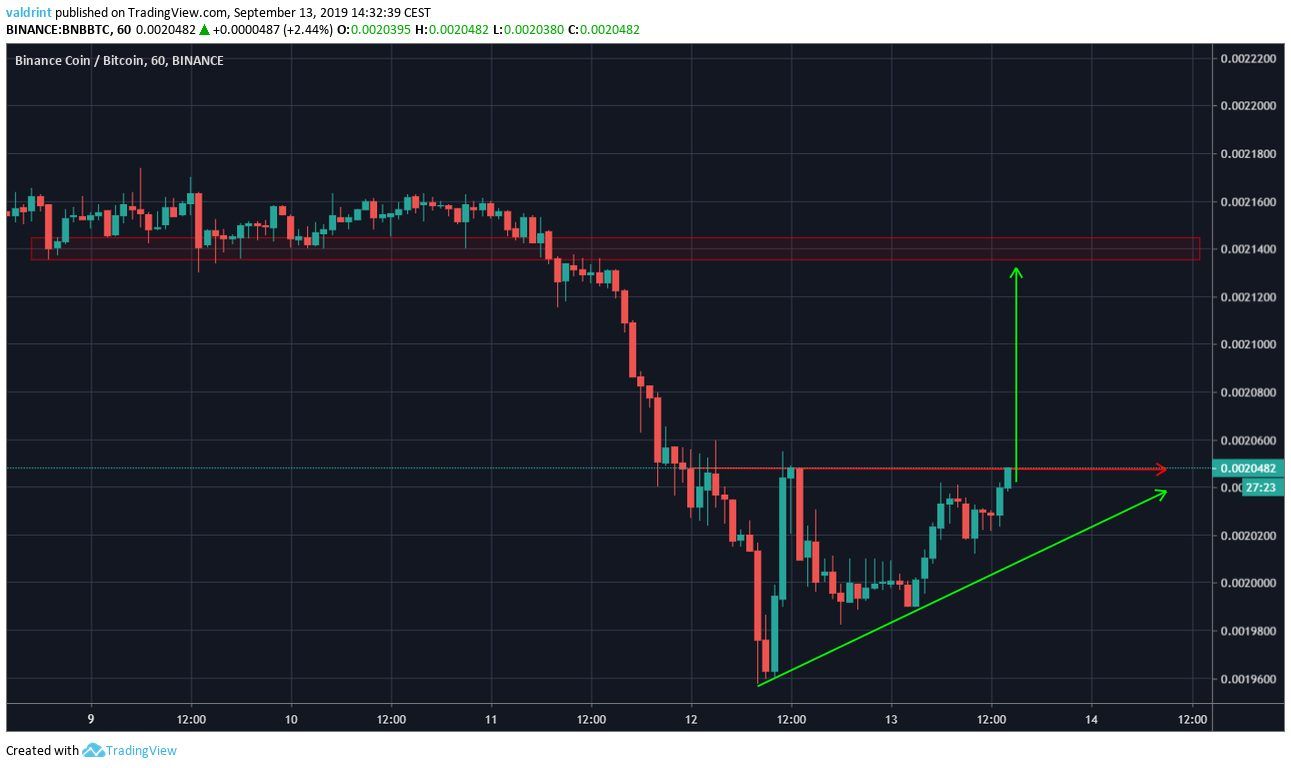
Doing so gives us a target of nearly ₿0.00240, where the closest resistance area is.
We believe it is likely that the price will breakout and reach this area.
Binance Coin Price Summary
The BNB price has been trading inside a descending channel.
According to our analysis, it is likely to begin an upward move towards the resistance line.
For hypothetical trading purposes, we consider BNB a buy at levels near ₿0.0020.
Do you think BNB will reach the resistance line? Let us know in the comments below.
Disclaimer: This article is not trading advice and should not be construed as such. Always consult a trained financial professional before investing in cryptocurrencies, as the market is particularly volatile.
Images are courtesy of Shutterstock, Trading
