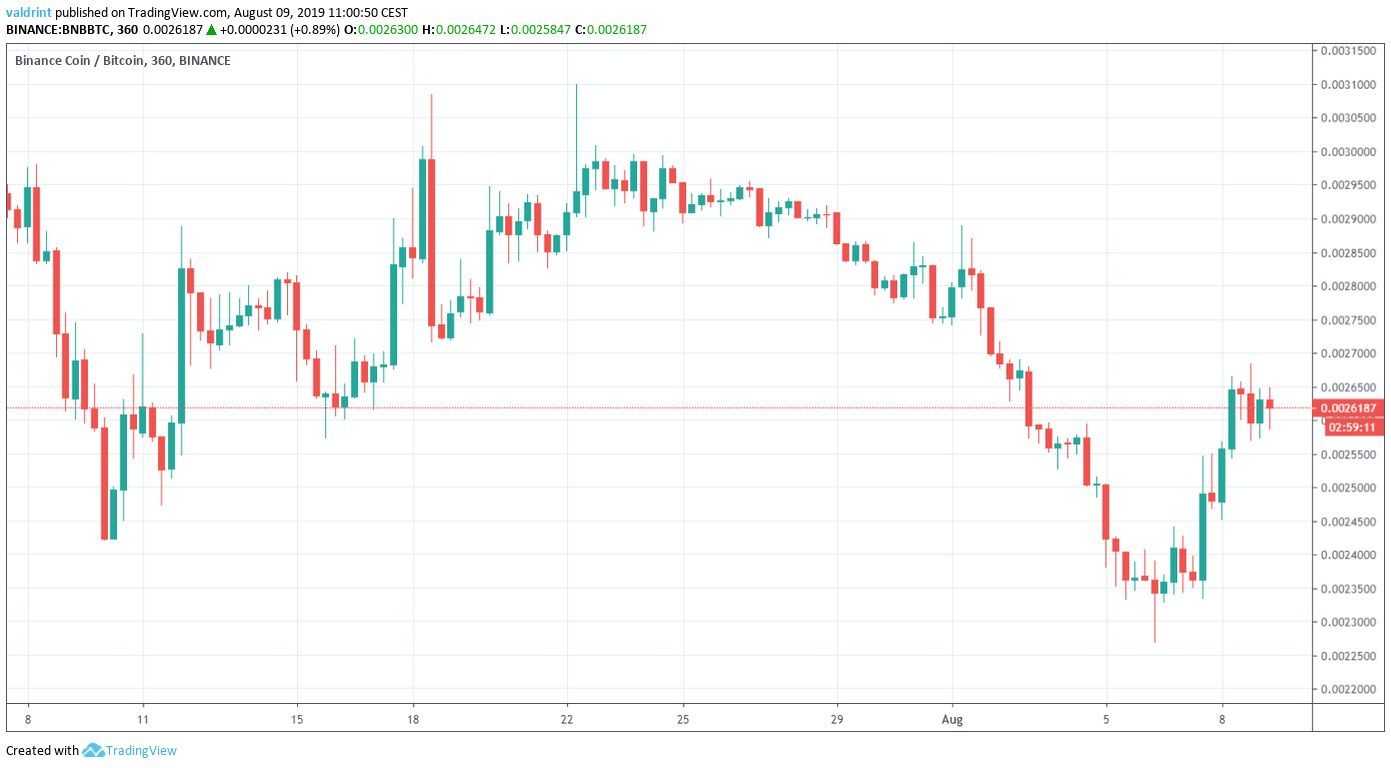
On July 10, 2019, the BNB price reached a low of 24,219 satoshis. An upward move began shortly after. On July 22, it reached a high of 31,000 satoshis. It has been decreasing since, reaching lows of close to 22,500, before beginning another upward move.
Where will BNB go to next? Continue reading if you are interested in finding out.
For our previous analysis click here.
If you are interested in margin trading cryptocurrencies with a multiplier of up to 100x on our new partner exchange with the lowest fees, follow this link to get a free StormGain account!
BNB Price: Trends and Highlights for August 9
- BNB/BTC is trading inside a descending wedge.
- There is support at 24,000 and 22,500 satoshis.
- Long-term RSI is bullish.
- Short-term RSI is bearish.
Current Pattern
A look at the daily time-frame shows us two things:
- BNB is trading inside a descending wedge.
- There is a support area at 24,000 satoshis.
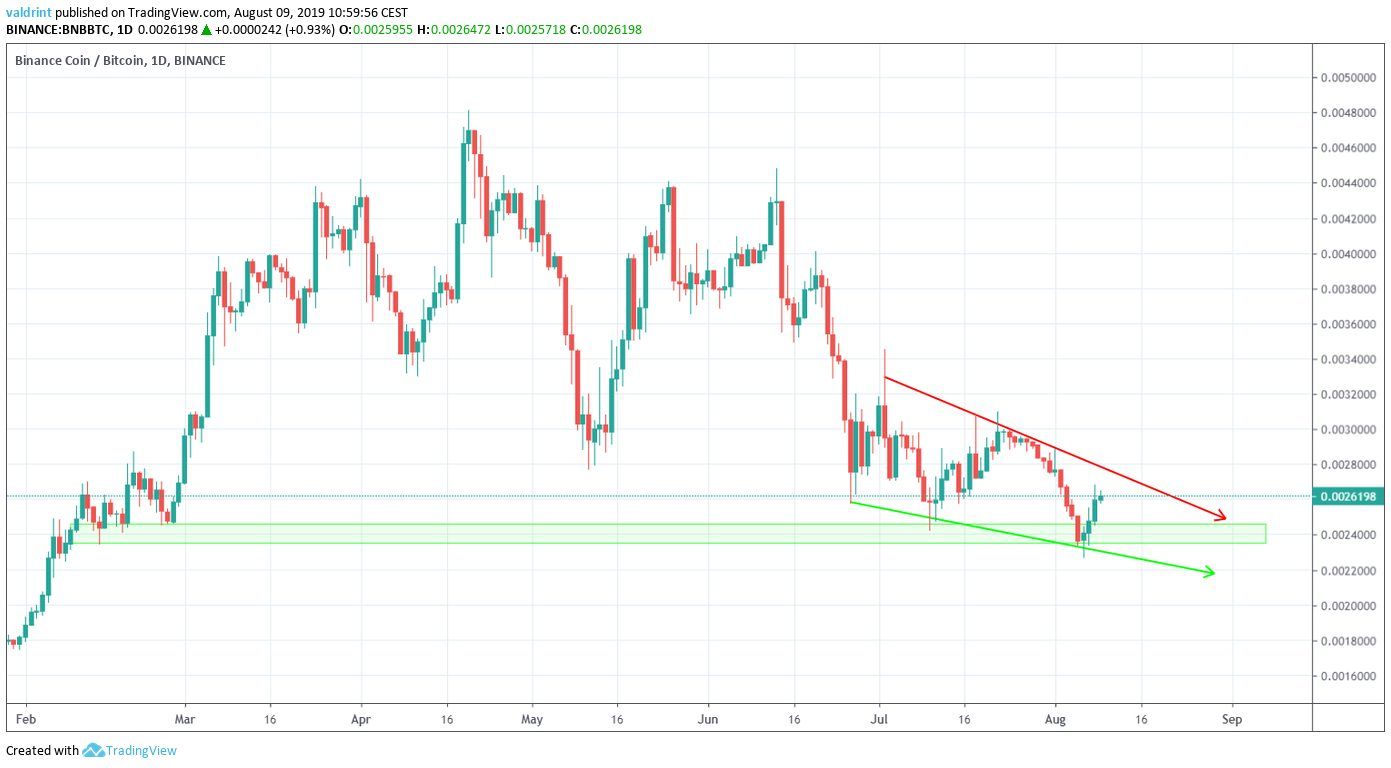
The price reached the support line for the third time on August 2, before beginning an upward move towards resistance.
At the time of writing, it had almost reached the resistance line.
Since the descending wedge is a bullish pattern, a breakout seems likely at first glance.
Let’s take a look at some technical indicators and find out if that will occur.
Trade cryptocurrencies on the world’s largest exchange by volume, Binance, by clicking this link!
Technical Indicators
We will begin with the RSI.
We can see below that it has been generating bullish divergence for the entire duration of the wedge.
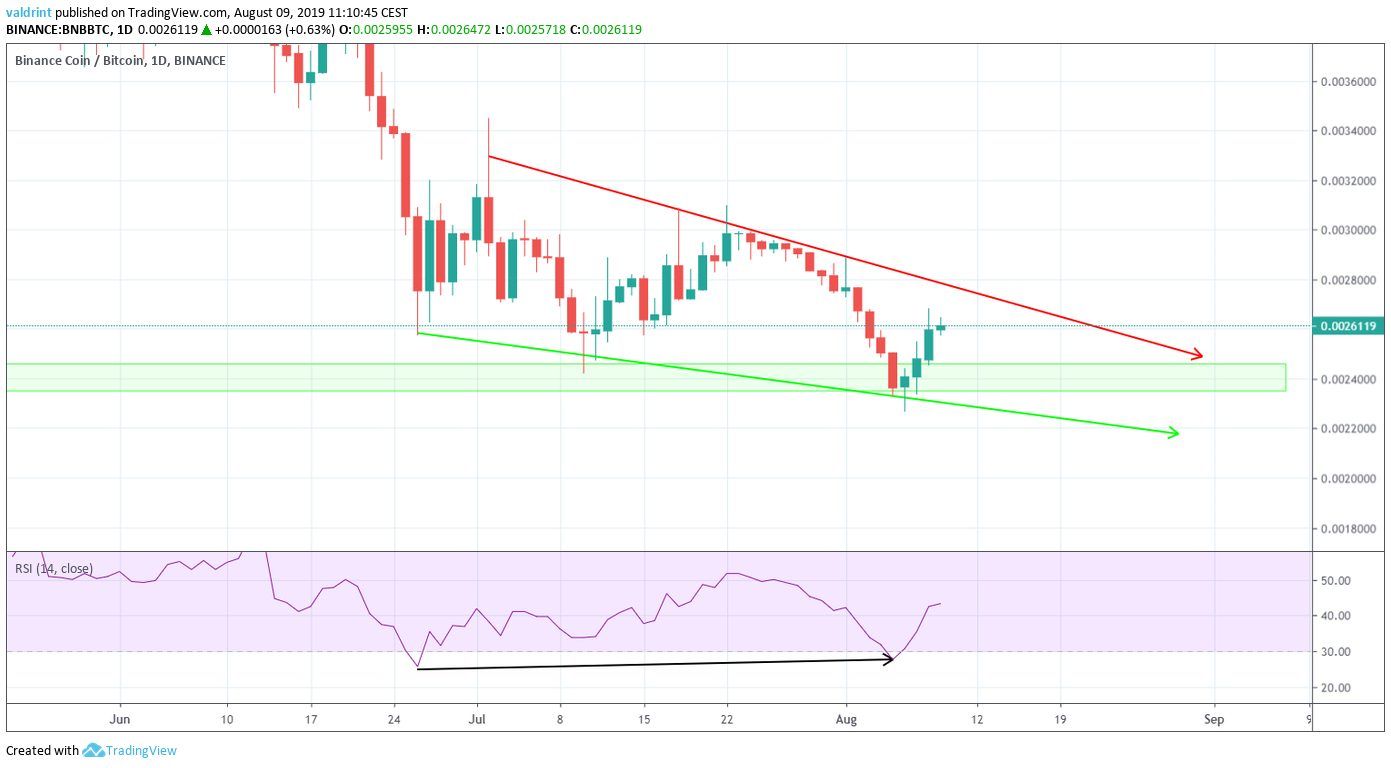
This makes it likely that a breakout will occur.
However, since the wedge is not projected to finish for quite some time, it does not discount the possibility that the price will again decrease to the support line before breaking out.
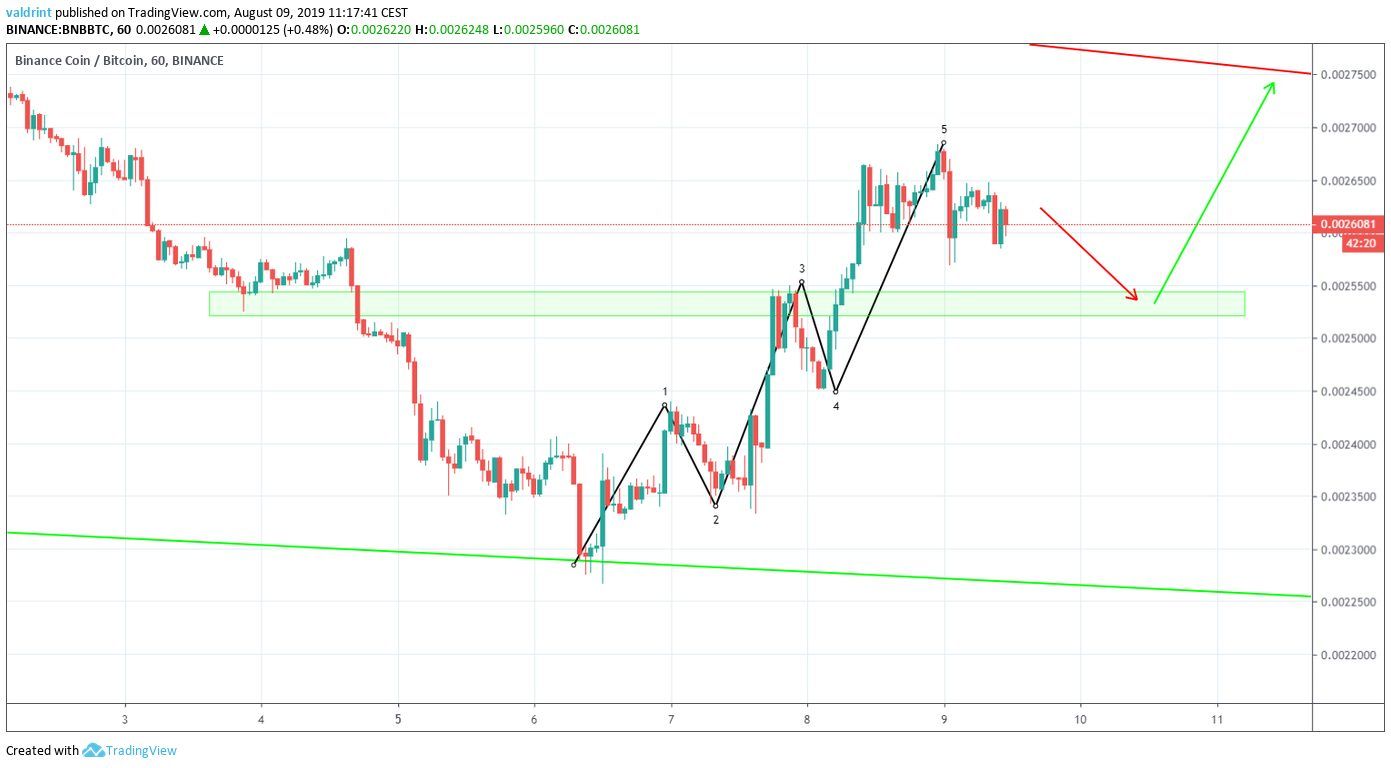
In the short-term, the recent upward move from support to resistance followed a standard five-wave formation.
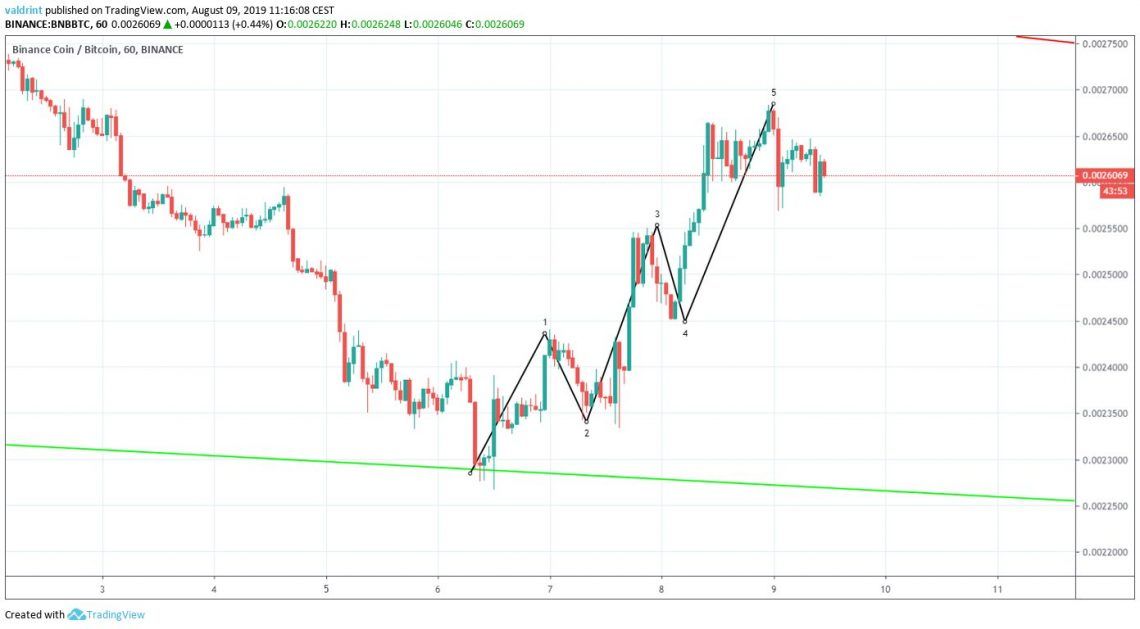
Additionally, there is one support area at 25,250 satoshis.
Since the price often corrects after a five-wave formation, it is likely that the price will decrease until it reaches the support area before resuming its upward movement.
This possibility is supported by the hourly RSI, which has been generating bearish divergence during the most recent highs.
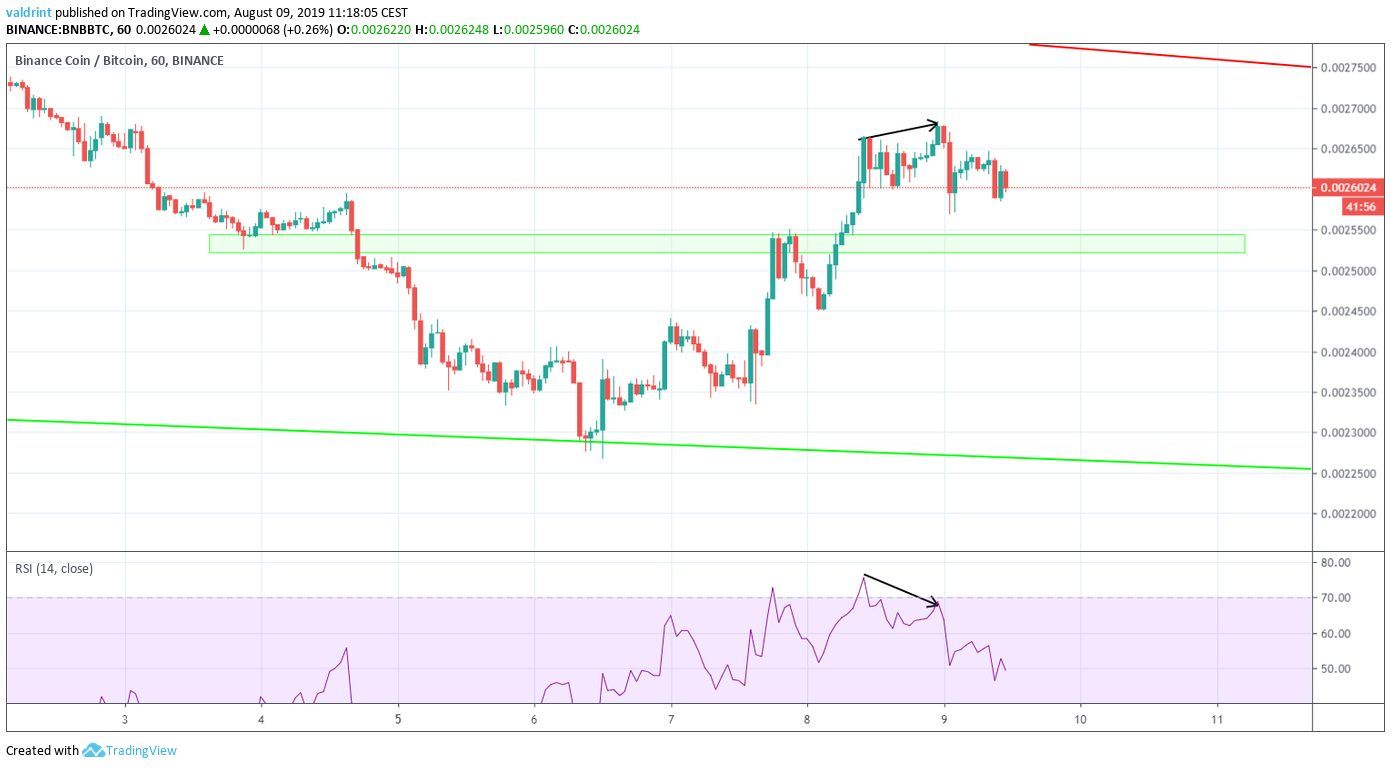
The combination of these indicators and price movement makes us believe that BNB will decrease to the support area before resuming its upward movement and making a breakout attempt.
Binance Coin Price Summary
The BNB price is trading inside a descending wedge.
According to our analysis, it will reach the resistance line and make a breakout attempt after a short-term decrease.
Do you think the Binance Coin price will reach the resistance line of the wedge? Let us know in the comments below.
Disclaimer: This article is not trading advice and should not be construed as such. Always consult a trained financial professional before investing in cryptocurrencies, as the market is particularly volatile.
Images are courtesy of Shutterstock, TradingView.